All procedures described in this protocol have been performed in accordance with guidelines and regulations for the use of vertebrate animals approved by the Institutional Animal Care Use Committee (IACUC) at Augusta University and at Nova Southeastern University which is accredited by the Association for Assessment and Accreditation of Laboratory Animal Care International (AAALAC). Note that Dr. Suzuki was employed by Augusta University where the mouse dental fluorosis experiments were completed.
1. Extraction of mandibular incisors in a mouse dental fluorosis model
- Feed fluoride-free diets to C57BL/6 mice (5-week-old, male) from 1 week prior to fluoride until termination of fluoride treatment.
- Prepare fluoride water by adding NaF in distilled water followed by vacuum filtration using a 0.2 µm filter. Give animals fluoride water as NaF (0 ppm and 125 ppm; N=5/group) ad libitum for 6 weeks. Replace fluoride water with a freshly prepared batch every 2 days.
- After 6 weeks of fluoride water treatment, euthanize animals with CO2 followed by decapitation.
- Extract the hemi mandibular with incisor from each mouse. To collect the hemi mandibular with incisor, cut the muscles around the mandibular jaw without applying excessive force.
- Place the hemi mandibular in PBS and keep it at 4 °C until μ-CT analysis (optional). Separate the incisor from the mandibular using a scalpel (#15) and scissors without damaging or breaking the specimen.
- Wash the isolated incisor with PBS and perform dehydration by immersing it in increasing strength of alcohol (70% and 100% ethanol) for 2-3 h.
NOTE: If the tissue (e.g., pulp) is not sufficiently dehydrated, resin impregnation is likely to be inhibited and subsequent evaluation will likely be inadequate. - After dehydration with ethanol, embed the incisor horizontally in resin. Continue to step 3.
2. Extraction of maxillary alveolar bones in a mouse ligature-induced periodontal bone resorption (L-PBR) model
- Administer 0.8 mL of ketamine (100 mg/mL) + 0.1 mL of Xylazine (100 mg/mL) + 9.1 mL of PBS intraperitoneally (i.p.) to mouse (C57BL/6, 8-12-week-old, male) as anesthetics. The dosage is 0.01 mL/g (weight). Apply ophthalmic ointment to both eyes to prevent dryness under anesthesia.
- Place the anesthetized mouse on a heating pad for 5-10 min. Assess responses to tail/toe pinches and the intactness of the ocular reflex. Confirm that the mouse is unresponsive to the noxious stimuli and the reflex is absent.
- Place the mouse on the treatment table and keep the mouth open by means of a ligature 5-0 silk suture tied to a magnetic post on the treatment table.
- Under a surgical microscope, wind the ligature (Braided silk suture 6-0) around one side of the maxillary second molar (single layer) using micro needle holders. Minimize individual differences in analysis by using one side as the treatment side and the other side as the control.
- Tie the ligature and make a knot on the palate side. After making a knot, cut the remaining ligature as short as possible so that the excessive ligature does not interfere with chewing or eating. This is important to ensure that the ligature will not loosen by chewing during the subsequent observation period.
NOTE: Do not leave the animal unattended until it has regained sufficient consciousness to maintain sternal recumbency. Do not return the animal that has undergone surgery to the company of other animals until fully recovered. Maintain sterile conditions during survival. - Feed diet and water to mice ad libitum for 2 weeks. After 2 weeks of ligation, euthanize mice with CO2 followed by decapitation.
- Extract both side maxillae (ligature side and control side) with molars from each mouse. To collect maxillae with molars, cut the muscles and bone around the maxillary jaw using scissors without applying excessive force. Place each maxilla in PBS and keep it at 4 °C until µCT analysis (optional).
- Separate the alveolar bone with molars (1st to 3rd) from the maxilla using a scalpel (#15) and scissors without damaging or breaking the specimen.
- Wash the isolated alveolar bone with PBS then dehydrate and degrease by immersion in increasing strength of alcohol (70% and 100% ethanol) for 2-3 h.
NOTE: If the tissue (e.g., pulp and bone) is not sufficiently dehydrated, resin impregnation is likely to be inhibited and subsequent evaluation will likely be inadequate. - After dehydration with ethanol, embed the alveolar bone horizontally in resin. Continue to step 3.
- Optional: Perform µCT evaluation before microhardness testing.
- Before microhardness testing, perform nondestructive structural analysis (e.g., µCT) using the same sample for microhardness testing as a complementary evaluation (Figure 1). Structural information (3D image, mineral density, volume) by µCT could support to evaluate sample mechanical properties and quality that may affect microhardness results.
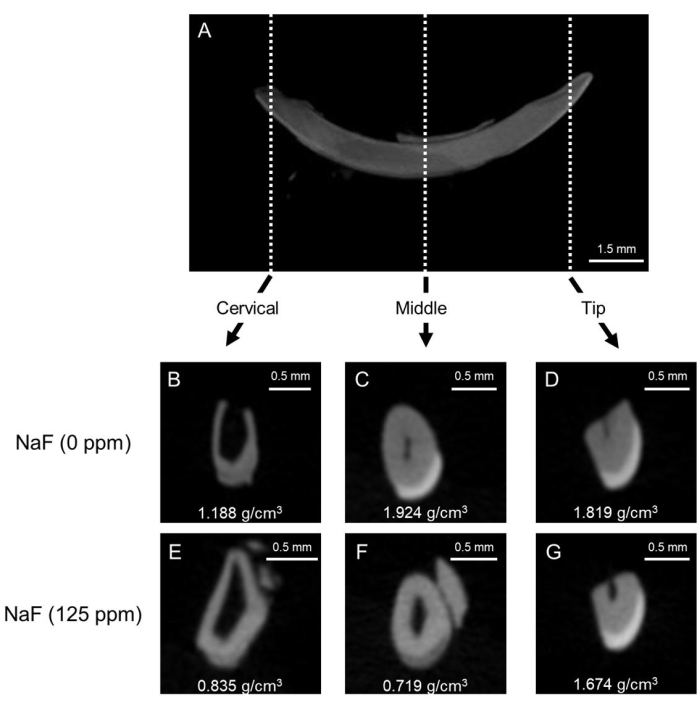
Figure 1: Representative μCT images of enamel in control and fluoride-treated mice incisors. (A) Representative μCT sagittal image of mandibular incisor. (B-D) μCT coronal images of control incisor (NaF 0 ppm). (E-G) μCT coronal images of incisor treated with NaF (125 ppm). Representative enamel mineral density (EMD) is shown (g/cm3). Please click here to view a larger version of this figure.
3. Embedding samples in resin
- Continue from step 1.7 (dental fluorosis model) or step 2.10 (L-PBR model).
- Coat the inside surface of the mounting cup (1 inch) with a thin layer of petrolatum. Mix resin (cold setting embedding resin) according to instructions. Pour the resin and hardener into the provided plastic cup in a 15:2 volume ratio and carefully mix with a wooden spatula for at least 2 min. Avoid air bubbles.
- Place dehydrated and degreased incisor (Figure 2A) or alveolar bone with molars (Figure 2B) oriented horizontally and parallel to the bottom of the mounting cup (1 specimen per cup).
- Pour the mixed resin (just enough resin, about 1.5 mL) into the mounting cup to completely cover the specimen. Avoid adding more resin than necessary, as excess resin will impede the polishing process (Figure 2C,D). Place the mounting cup containing specimen on a hot plate at 50 °C for at least 8 h to promote resin polymerization. This procedure contributes to holding the specimen in a stable position.
NOTE: Depending on the sample size, adjust the amount of resin to completely cover the specimen. Do not fill too much resin, otherwise more time will be needed to remove superfluous resin. - After curing, remove the resin containing the specimen from the mounting cup. Remove burrs and arrange the specimen's plane and the opposite side plane as parallel and flat using an advanced grinder-polisher with rough water-resistant abrasive paper (Grit 60/P60 and 120/P120) under water flooding. Keep the height of specimen to approximately 3 mm for incisor and alveolar bone (Figure 2E,F).
NOTE: When the specimen is analyzed by SEM following the microhardness measurement, the thickness of the sample should be about 3 mm so that subsequent SEM observation will not be affected. Smaller samples are more difficult to manipulate with the grinder. For the samples intended for microhardness only, the specimen height can increase to about 10-20 mm. - Trim the external shape to make a rectangular solid resin block and round corners (approximately, width 30 mm, length 10 mm for incisor (Figure 2G) and width 10 mm, length 5 mm, for alveolar bone (Figure 2H)) using a precision sectioning saw.
- Once the rough shape correction is complete, remove debris and particles from the resin block using an ultrasonic cleaner (about 1 min). Continue to step 4.
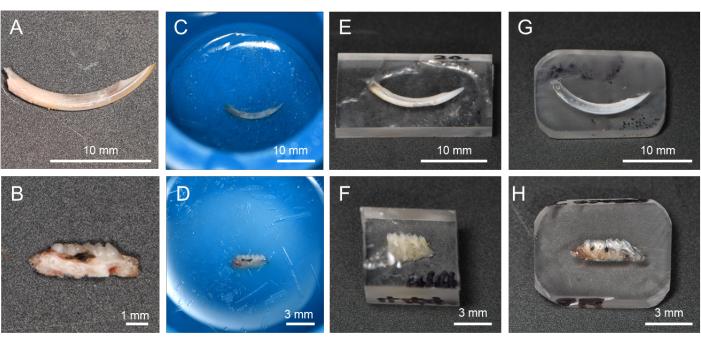
Figure 2: Flow of resin-embedding and polishing procedure. (A) Dehydrated and degreased incisor. (B) Dehydrated and degreased alveolar bone in L-PBR. (C, D) Incisors and alveolar bone immersed in resin. (E, F) By cutting off the resin, it is easier to polish the target tissue surface. (G, H) Resin corners rounded for the polishing process. Abbreviations: L-PBR = ligature-induced periodontal bone resorption. Please click here to view a larger version of this figure.
4. Polishing of specimens
NOTE: Polishing of specimens is done manually using waterproof abrasive papers (from rough to finer) on an advanced grinder-polisher under water flooding.
- Place a rough water-resistant abrasive paper (Grit 600/P1200) on the grinder. Place the trimmed and cleaned resin block (from step 3.7) on the rough water-resistant abrasive paper.
- While pouring water, hold the resin block and polish the specimen's evaluation surface on the grinder-polisher (Speed 1-10 x g). At this time, be careful to hold the resin block so that the evaluation surface is parallel to the ground. To keep the evaluation surface intact, check the surface with the naked eye or under a microscope.
NOTE: Note that the grinder rotates clockwise, and uniform pressure can lead to an unparallel surface. To obtain a parallel surface, keep the glider rotational speed constant and press the specimen carefully for a few seconds, and then rotate the specimen 180° to press for the same amount of time. Rough abrasive paper may remove not only resin but also specimen. - Change the abrasive paper to the Grit 800/P2400 and place the resin block on it. Repeat step 4.2.
- Remove debris and particles from the resin block using an ultrasonic cleaner (about 1 min).
NOTE: Before proceeding, using an ultrasonic cleaner to remove any surface debris to prevent clogging is recommended. - Next, perform serial polishing using finer abrasive papers; polishing order is 12 µm, 9 µm, 3 µm, 1 µm and 0.3 µm.
- Place a lapping film (12 µm) on the grinder-polisher table without rotation and place the resin block on the lapping film.
NOTE: In this experiment, the grinder table is suitable to get a flat surface condition under water flooding. Alternatively, a large plane mirror (or similar one) that provides parallelism can also be used. - Under water cooling, carefully polish the specimen's evaluation surface on the lapping film by hand. Move the sample vertically, horizontally, and diagonally for the same number of seconds under water injection with strokes of 2 to 3 cm (1 inch). When the polishing procedure is properly achieved, the resin specimen will stick to the lapping film.
- Remove debris and particles as in step 4.4. Change the abrasive paper to the next size according to the serial polishing order (from 12 µm to 0.3 µm) and place the resin block on it.
- While pouring water, hold the resin block and carefully polish the specimen's surface on the lapping film by hand. Remove debris and particles as in step 4.4.
- Repeat steps 4.5 – 4.8 to complete the final polishing (0.3 µm). After completing the final polishing (0.3 µm), the specimen should have a mirror finish surface (Figure 3A).
- Clean the surface of the specimen with ethanol (100%) to degrease and dehydrate and store resin blocks at room temperature until microhardness testing. During storage, avoid excessive moisture and dust. Continue to step 5.
5. Vickers microhardness test
NOTE: Indentation of a mirror finish surface specimen is done using a microhardness tester. Testing is performed with a load of 25 g for 10 s with a Vickers tip.
- Vickers microhardness test for incisors (dental fluorosis model)
NOTE: Enamel can be divided into three layers from outside (oral cavity side) to inside (pulp side); namely, the superficial layer, the middle layer, and the deep layer (dentin-enamel junction, DEJ) (Figure 3B)16. In this protocol, three enamel layers are tested.- Set loading force to 25 g and loading duration to 10 s. Place the resin block on the stage.
- Indent 6 points in each enamel layer (superficial, middle and DEJ) and dentine in each region (cervical, middle and tip; Figure 3B).
- Measure the length of the two diagonals (d1 and d2; Figure 3B) to calculate the Vickers microhardness value (HV; Figure 4).
- Vickers microhardness test for alveolar bone (L-PBR model)
- Set loading force to 25 g and loading duration to 10 s. Place the resin block on the stage.
- Indent 3-6 points in each mesial and distal side of alveolar bone from the alveolar crest. Indent alveolar bones between 1st and 2nd molar (white square), and 2nd and 3rd molar.
NOTE: In this protocol, 6 points in each mesial and distal side (total 12 points) were evaluated for the control (intact) bone, and 3 points in each side (total 6 points) were evaluated for L-PBR. The number of indentation points depends on the conditions of the lesion (e.g., too much bone loss limits the indentation area).
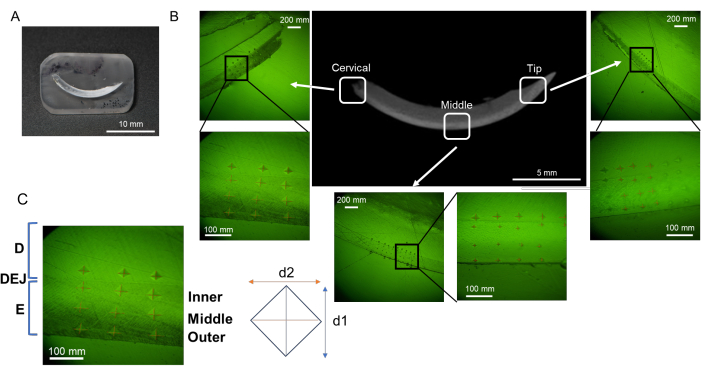
Figure 3: Evaluation regions of microhardness in mandibular incisor. (A) Mirror finish surface sample containing mandibular incisor. (B) Indentations in each region; cervical, middle, and tip (NaF 0 ppm). (C) Three enamel layers; from DEJ, Inner, Middle, and Outer enamel. Abbreviations: D = dentin, E = enamel, DEJ = dentin enamel junction Please click here to view a larger version of this figure.
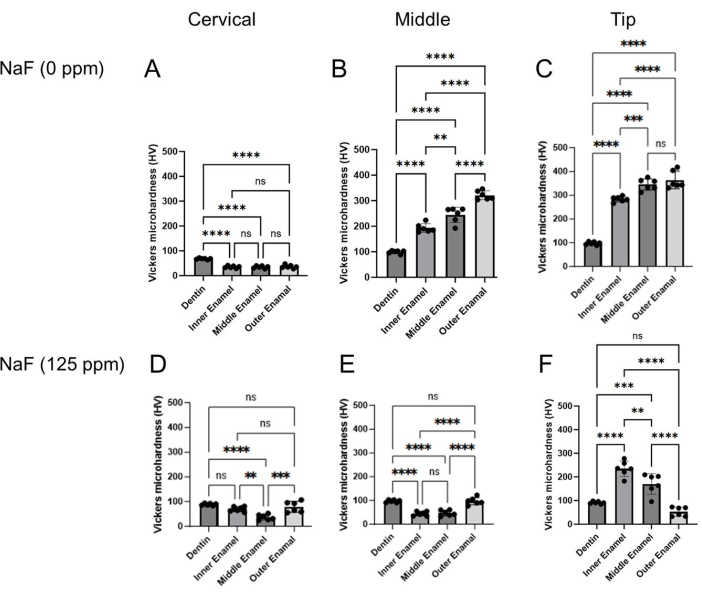
Figure 4: Vickers microhardness of enamel treated with or without NaF. The microhardness of dentin and three enamel layers were evaluated in each region, cervical, middle, and tip region. (A-C) Control and (D-F) NaF (125 ppm) treatment. Data are presented as mean ± SD. Significant differences were evaluated by one-way ANOVA with Tukey's post-hoc test. p values < 0.05 were considered statistically significant. **p < 0.005, ***p < 0.0005, ****p < 0.0001 Please click here to view a larger version of this figure.
Dental fluorosis model: Figure 1 shows representative μCT images of incisors in control and fluoride-treated mice. In the control (Figure 1B-D), the cervical region showed lower enamel mineral density (EMD) of 1.188 g/cm3 (Figure 1B) compared to the middle (1.924 g/cm3) and tip (1.819 g/cm3; Figure 1C,D). In the fluoride-treated enamel (Figure 1E-G), only one sample out of five was evaluated for EMD in the cervical region (0.835 g/cm3; Figure 1E and Supplementary Figure 1). The EMD in all regions decreased compared to the control (Figure 1F,G). The low EMD levels were consistent with the low enamel microhardness values. As shown in Figure 3, six points were indented at dentin and three layers of enamel (inner, middle, and outer) in the cervical, middle, and tip regions. In the control, each enamel layer's microhardness was lower than dentin in the cervical region (Figure 4A). In the middle and tip regions, enamel microhardness of each layer was significantly higher than that of dentin (Figure 4B,C). Among the three enamel layers, microhardness increased from the inner to the outer enamel in each middle and tip region (Figure 4B,C). Dentin had a microhardness value around 100 HV with small variations in cervical, middle and tip regions, whereas enamel microhardness was significantly different in regions and in enamel three layers. These results suggest that enamel microhardness significantly differs depending on indentation sites (regions and enamel layers). In the fluoride-treated tooth, contrary to the control, enamel microhardness was less than dentin even in the middle region (Figure 4E). In the tip region, microhardness significantly decreased from the inner to the outer enamel layer (Figure 4F). These gradient differences of microhardness among enamel layers are difficult to evaluate by μCT images.
L-PBR model: Figure 5A shows μCT images of alveolar bone in the ligature-induced periodontal bone resorption (L-PBR) model. The representative bone mineral density (BMD) (mean of the mesial and distal sides of alveolar bone around second molar) was 0.76 g/cm3 in control bone and 0.61 g/cm3 in L-PBR. Bone resorption levels were quantified by the distance from the cement enamel junction (CEJ) to the alveolar bone crest (ABC). The CEJ-ABC length was significantly increased in L-PBR compared to the control bone (Figure 5B). Figure 6 shows microhardness indentation sites and corresponding μCT images. From the alveolar bone crest, five indentations were done in each medial and distal side (total 10 sites) in the control bone between 1st and 2nd molar indicated by the white square (Figure 6A). The 3 indentations in each mesial and distal side (total 6 sites) were measured in the L-PBR (Figure 6B). Vickers microhardness values (HV) were the means of indentations of alveolar bones between 1st and 2nd molar (Figure 6B; White square), and between 2nd and 3rd molar (Figure 6B; Blue square). Alveolar bone BMD and HV values showed a lower tendency in L-PBR (affected by periodontal diseases) compared to control (healthy) alveolar bone.
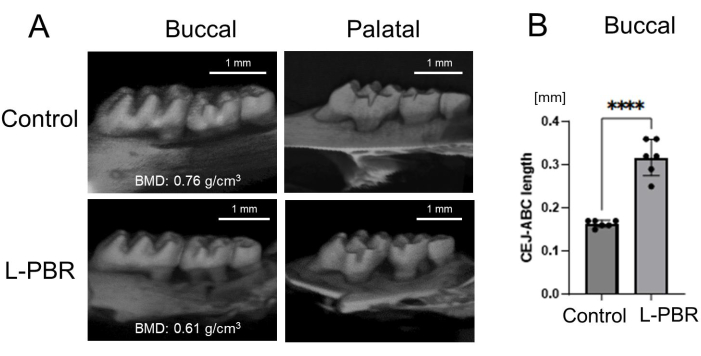
Figure 5: Representative μCT image and bone loss in the L-PBR model. (A) Representative μCT images in the L-PBR model (Control and L-PBR group). The representative bone mineral density (BMD; mean of the mesial and distal sides of alveolar bone around second molar) is shown (g/cm3). (B) Distance from the mesial and distal CEJ of the maxillary second molar to the alveolar bone crest in the root apical direction. Data are presented as mean ± SD. Significant differences were evaluated by t-test. p values < 0.05 were considered statistically significant. **** p < 0.0001. Abbreviations: L-PBR = ligature-induced periodontal bone resorption. CEJ = cement enamel junction, ABC = alveolar bone crest. Please click here to view a larger version of this figure.
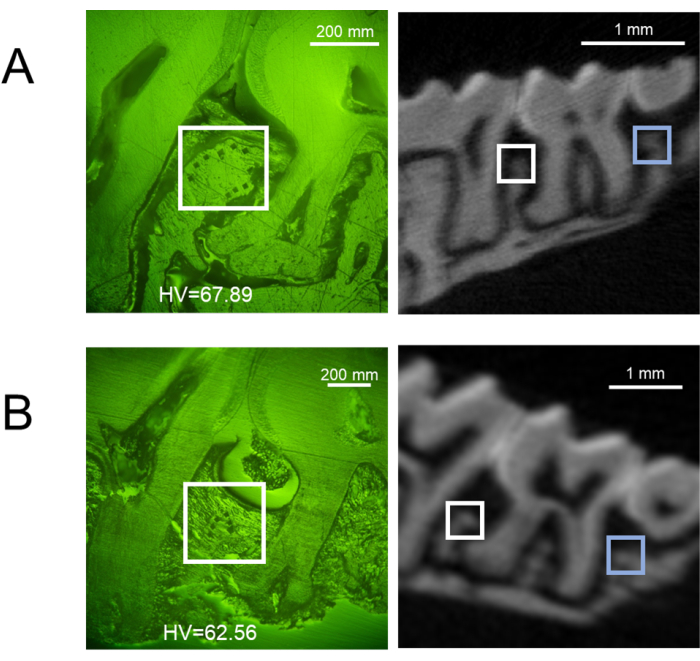
Figure 6: Representative microhardness results in the L-PBR model. Representative buccal side of indentation sites (left) and the corresponding μCT image (right) of (A) control alveolar bone, and (B) L-PBR. White squares show indentation areas in the alveolar bone between M1 and M2. Blue squares show indentation areas in the alveolar bone between M2 and M3. Microhardness values (HV) are the means of indentations in white and blue square areas. M1: 1st molar, M2: 2nd molar, M3: 3rd molar. Abbreviations: L-PBR = ligature-induced periodontal bone resorption. Please click here to view a larger version of this figure.
Supplementary Figure 1: μCT image of enamel treated with NaF (coronal section). NaF (125 ppm) caused enamel hypo-mineralization, which was significantly observed in the cervical and middle regions. Only one sample (sample no. 1) out of five barely showed enamel in the cervical and middle regions. Please click here to download this File.
