1. Labeling of SBDS-FlAsH with the FlAsH Fluorescent Dye 4',5'-Bis(1,3,2 dithioarsolan-2-yl) Fluorescein
- Mix 3 nmol of the SBDS-FlAsH protein (the FlAsH-tag corresponds to the tetracysteine motif Cys-Cys-Pro-Gly-Cys-Cys genetically engineered in the C-terminus of the recombinant SBDS protein) with 3 nmol of the 4',5'-bis(1,3,2 dithioarsolan-2-yl) fluorescein dye in 5 µl volume of Anisotropy buffer (50 mM Tris-HCl pH 7.5, 300 mM NaCl, 5 mM MgCl2, 10% glycerol, 5 mM β-mercaptoethanol).
- Let the reaction proceed for 8 hr at 4 °C. Dialyze the sample against Anisotropy buffer overnight to remove the free dye.
- Use the Lambert-Beer law to quantify the % of labeled protein. Measure the absorbance at 280 nm and 508 nm in a spectrophotometer using a quartz cuvette of appropriate volume. NOTE: Consider the following molar absorption coefficients (M-1 cm-1):
 Equation 1
 - Calculate the concentration of labeled SBDS-FlAsH protein using Equation 2.
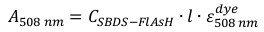 Equation 2
 - Calculate the concentration of total SBDS protein using Equation 3 by substituting the calculated CSBDS-FlAsH from the previous step.
 Equation 3
 - Calculate the percentage of labeled protein using Equation 4.
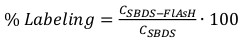 Equation 4
2. Fluorescence Anisotropy Experiments
NOTE: Anisotropy experiments were done in a spectrofluorometer equipped with a polarization toolbox and data collection was performed using the anisotropy program provided in the software of the equipment. The excitation wavelength was set at 494 nm with a spectral bandwidth of 8 nm and the emission was recorded using a band-pass filter of 530±25 nm. Measurements were done at 25 °C in a 200 µl cuvette with a 5 mm path length.
- In a fluorescence cuvette, place 200 µl of 30 nM SBDS-FlAsH in an anisotropy buffer and titrate 2 µl of 30 µM EFL1. Mix thoroughly and let the reaction stand for 3 min before measuring the anisotropy value.
- Repeat step 2.1 until a total volume of 40 µl of EFL1 has been added.
3. Data Analysis
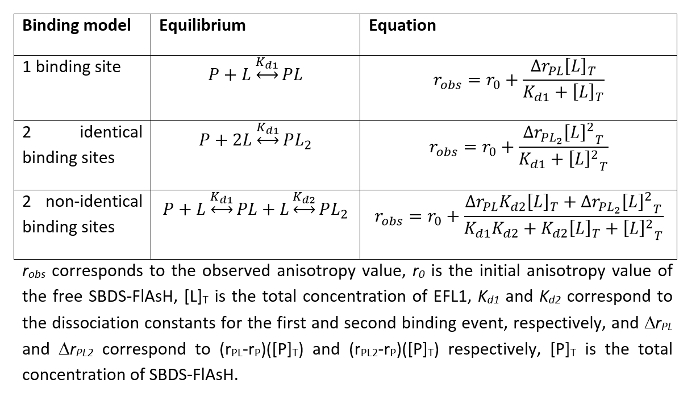
- Fit the data to the appropriate binding model using a nonlinear least squares regression algorithm. Equations for the most common binding models are presented in Table 1.
- Evaluate the best model that describes the interaction between the proteins by inspecting the residuals of the fit. Support the chosen model with additional experiments.
Table 1. Common protein-protein interaction binding models and the mathematical equations that describe them.