1. Prostate Sample Collection
- Collect the prostate samples at the time of prostatectomy. The specimen is oriented using anatomic landmarks. The prostate and seminal vesicles are painted as follows: right side green, left side blue.
- A random transverse midsection of the prostate is taken perpendicular to the rectal surface, frozen in liquid nitrogen, and stored at -80 °C9.
- Banked slices of specimens are photocopied, oriented (anterior, posterior, right and left), quadrisected. Sections are cut using the Cryostat.
- Sections are stained with H&E and reviewed by a pathologist to determine and delineate tumor versus normal areas on the stained slides and a corresponding image. The marked areas are used as a guide to indicate areas from which to extract the tumor tissue from which RNA will be extracted in the subsequent steps.
2. Isolating Total RNA, Including miRNA, from Samples
- Place frozen prostate samples on dry ice and referring to the delineated photocopy, cut out a small portion of the prostate tumor (between 50 to 100 mg).
- Homogenize the prostate tumor tissue in 1 mL of TRIzol Reagent. The quantities in the following steps are based on use of 1 mL of TRIzol Reagent.
Note: Here we have used TRIzol Reagent for extracting RNA, however other kits that isolate small RNA-containing total RNA can also be used.
- Incubate the homogenized samples for 5 minutes at room temperature.
- Add 0.2 mL of chloroform to the samples and shake vigorously for 15 seconds. Incubate samples for 3 minutes at room temperature, then centrifuge at 12,000 x g for 15 minutes at 4 °C.
- Transfer the colorless upper aqueous phase to fresh tubes, and add 0.5 mL of isopropyl alcohol. Incubate samples for 10 minutes at room temperature, then centrifuge at 12,000 x g for 10 minutes at 4 °C.
- Carefully aspirate the supernatant without disturbing the pellet containing the RNA. Wash the RNA pellet with 1 mL of 75% ethanol. Vortex the sample and re-sediment by centrifugation for 5 minutes at 7,500 x g at 4 °C.
- Carefully aspirate the supernatant and dry the RNA pellet for 5-10 minutes, making sure the RNA pellet is not completely dry. Re-dissolve in Nuclease-free water appropriate to pellet size. Measure the concentration of RNA using the NanoDrop 1000 spectrophotometer (measure absorbance at 260 nm and 280 nm).
- Check the quality and integrity of the RNA samples using Agilent Bioanalyzer.
3. Reverse Transcription of RNA
- Reverse transcription of RNA was performed using miScript Reverse Transcription Kit according to manufacturer’s instructions (Qiagen). This kit includes a reverse transcriptase and a poly(A) polymerase. The miScript RT Buffer includes Mg2+, dNTPs, oligo-dT primers, and random primers.
- Use between 10 pg and 1 μg of RNA to synthesize cDNA. If using more than 1 μg of RNA, scale up the reaction linearly to the appropriate volume.
- Prepare a master mix that contains 5X miScript RT Buffer (4 μl), miScript Reverse Transcription Mix (1 μl), and RNase-free water to bring reactions to final volume of 20 μl. Also include template RNA (up to 1 μg) in the master mix.
- Incubate the samples for 60 minutes at 37 °C followed immediately by an incubation for 5 minutes at 95 °C. This step can be performed in a PCR machine, heating block, or water bath. Thermocyclers are the most suitable and accurate method. Store the cDNA on ice for short term, and -20 °C for long term storage.
4. Generating a Standard Curve
- Prior to experiment with target miRNAs, a standard curve is generated by using cDNAs of known concentrations against their crossing points (CP) (Figure 2).
- Prepare a series of dilutions of 2-fold, 10-fold, 50-fold, 250-fold, and 1250-fold the original cDNA of a sample that is known to have a substantial expression of your gene of interest.
- Run the PCR as specified in Section 5 “Real-time PCR for detection of miRNA”, with the modification that cDNA is in serial dilutions not a static 40x dilution.
- Perform analysis using RelQuant software (Roche) to generate your standard curve.
Note: a new standard curve must be generated for each gene of interest.
5. Real-time PCR for Detection of miRNA
- Real time PCR for miRNAs was performed using miScript SYBR Green PCR Kit and miScript Primer Assay according to manufacturer’s instructions (Qiagen). Prepare a master mix containing 2x QuantiTect SYBR Green PCR Master Mix, 10x miScript Universal Primer, 10x miScript Primer Assay, and RNase-free water. Prepare a master mix for a 20 μl volume reaction.
- The Primer Assay is specific to the miRNA of interest. To reconstitute 10x miScript Primer Assay, centrifuge the vial briefly, and add 550 μl TE buffer, pH 8.0. Vortex the vial briefly to mix, aliquot primers to smaller volumes, and store at -20 °C. Two primers are required: primers for the target gene and the reference gene. RNU6B is usedas the reference gene.
- Dilute the cDNA 40x and store extra aliquots at -20 °C.
- cDNA serves as the template for the PCR. Use 2 μl of 40x diluted cDNA and dispense to the 20 μl light cycler capillaries (Roche).
- Add 18 μl of the master mix to each capillary, and centrifuge using a capillary adapter.
- Place the capillaries in a capillary based Real-Time cycler, such as LightCycler 3.5 Real-Time PCR System with a 32-capillary carousel format.
- Run the PCR cycling program as follows:
To activate HotStarTaq Polymerase that is in the 2x QuantiTect SYBR Green PCR Master Mix, pre-incubate at 95 °C for 15 minutes.
Followed by 50 cycles of:
Denaturation, 15 s, 94 °C;
Annealing, 30 s, 55 °C;
Extension, 30 s, 70 °C. - Select a sample to be the calibrator, and set its normalized target amount to 1. Compare the relative expression of the miRNA in all the other samples to the calibrator.
Note: Within a study, the same calibrating sample should be used to maintain consistency of results.
6. Analyzing Data
- Amplification curves for the PCR reactions are depicted graphically and numerically by Molecular Biochemicals LightCycler Software version 3.5 (Roche). Quantify reactions in the “Quantification” tab, and export the data to a text file.
- Import the data to the RelQuant analysis software (Roche) to generate quantification results. Import separate files for target gene, reference gene, and standard curve data.
- Specify the position of calibrator for both target and reference gene. Also specify positions of the samples. Data is expressed as the target to reference ratio of different samples divided by the target to reference ratio of the calibrator. The standard curve previously generated for a particular miRNA and housekeeping gene is used as a reference standard for extrapolating quantitative data for miRNA targets of unknown concentrations.
- Three replicates of samples are analyzed as a group and mean concentrations and standard deviations of the triplicate is calculated. If one of the triplicates is inconsistent with the rest of the set, it will be excluded by the program.
7. Representative Results
An example of qPCR analysis on prostate samples is shown in Figure 3. Results are depicted numerically, as well as graphically. The graphs showing the expression levels of the reference gene, U6, begin exponential amplification at about cycle 20, while expression of the target gene, miR-98, showed delayed amplification approximately at cycle 25. The data from this experiment was exported as text file and analyzed by RelQuant analysis software. Positions of the capillaries containing the calibrator and samples are specified. Figure 4 illustrates how the calibrator is set to be 1, and the expression of other samples relative to the calibrator.
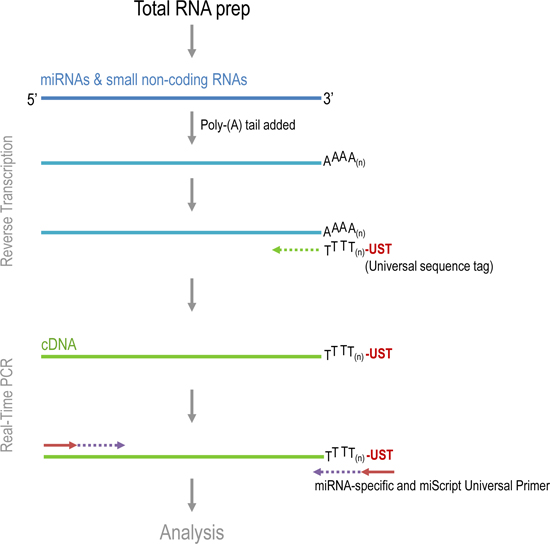
Figure 1. Various steps in miScript reverse-transcription and Real-time PCR.
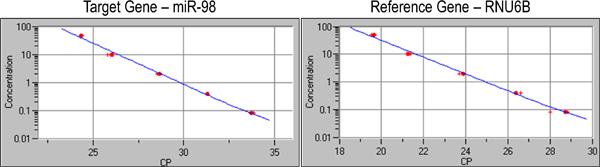
Figure 2. A standard curve is generated by using a series of dilutions of 2-fold, 10-fold, 50-fold, 250-fold, and 1250-fold the original cDNA sample.
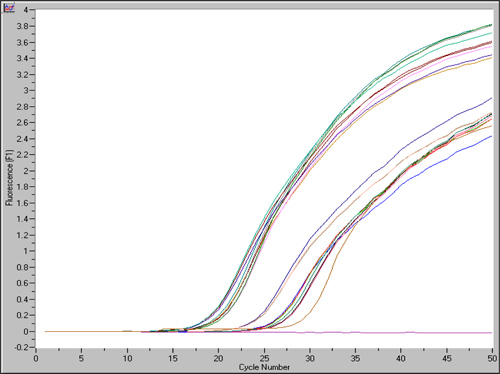
Figure 3. Roche Molecular Biochemicals LightCycler Software shows the entire information of the experiment graphically and by text. Quantitative Real-time PCR amplification plots show increased in fluorescence from different samples.
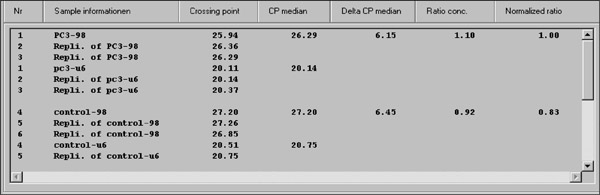
Figure 4. Data were quantified using RelQuant LightCycler analysis software. Usually, three replicates of samples are analyzed as a group and samples that produce clearly inconsistent results are excluded and mean concentrations and standard deviations of the triplicate is calculated.
