In this manuscript, we present a high-throughput, semi-automated cryohistology platform to produce aligned composite images of multiple response measures from several rounds of fluorescent imaging on frozen sections of mineralized tissues.
There is an increasing need for efficient phenotyping and histopathology of a variety of tissues. This phenotyping need is evident with the ambitious projects to disrupt every gene in the mouse genome. The research community needs rapid and inexpensive means to phenotype tissues via histology. Histological analyses of skeletal tissues are often time consuming and semi-quantitative at best, regularly requiring subjective interpretation of slides from trained individuals. Here, we present a cryohistological paradigm for efficient and inexpensive phenotyping of mineralized tissues. First, we present a novel method of tape-stabilized cryosectioning that preserves the morphology of mineralized tissues. These sections are then adhered rigidly to glass slides and imaged repeatedly over several rounds of staining. The resultant images are then aligned either manually or via computer software to yield composite stacks of several layered images. The protocol allows for co-localization of numerous molecular signals to specific cells within a given section. In addition, these fluorescent signals can be quantified objectively via computer software. This protocol overcomes many of the shortcomings associated with histology of mineralized tissues and can serve as a platform for high-throughput, high-content phenotyping of musculoskeletal tissues moving forward.
Biological research often requires efficient phenotyping, which is frequently associated with some sort of histological analysis1-3. This need is even more evident with the ambitious projects to disrupt each gene in the mouse genome4. These histological analyses can range from assessing cell morphology and/or anatomical features to mapping expression of specific genes or proteins to individual cells. In fact, one of the fundamental contributions of histology to the field of genomics is the ability to associate a specific molecular signal to a specific region or cell type.
Traditional methods of histology, especially for musculoskeletal tissues, are often time consuming and laborious, requiring sometimes weeks to fix, decalcify, section, stain, and image the specimen then analyze the images via human interpretation. Analyzing multiple molecular signals, whether via immunohistochemistry, in situ hybridization, or special stains, requires multiple sections and even multiple specimens to perform appropriately. In addition, these multiple responses cannot be co-localized to the same cell and sometimes cannot be co-localized to a specific region within a given specimen. As the genomics and epigenomics field moves into the digital age, the histological field must also follow suit to provide efficient, high-throughput, and automated analysis of a variety of molecular signals within a single histological section.
Indeed, there is a demand for improved histological techniques that can associate multiple molecular signals to specific cells within a given specimen. Recently, we have published a new high-throughput cryohistological method for assessing several response measures within a given section from mineralized tissue5-14. The process involves stabilizing the cryosection with frozen cryotape, adhering the taped section rigidly to a microscope slide, and conducting several rounds of staining and imaging on each section. These rounds of images are then aligned manually or via computer automation prior to image analysis (Figure 1). Here, we present detailed protocols of this process and provide examples where these techniques have improved our understanding of different biological processes.
The University of Connecticut Health Center institutional animal care and use committee approved all animal procedures.
1. Fixation and Embedding
2. Tape-stabilized Tissue Sectioning
3. Adhesion of Sections to Microscope Slides
4. Application of Reference Markers to Slides
5. Multiple Rounds of Staining
NOTE: By choosing a compatible sequence of imaging, staining, and reimaging steps, it is possible to detect and co-localize many biological signals on the same tissue section. Each round of imaging/staining/reimaging has to be developed for the particular histological question. The imaging/staining/reimaging sequence typically involves acquiring the endogenous fluorescent signals (e.g., cellular GFP, mineralization dyes, in vivo imaging probes) on the first round of imaging followed by fluorescent multiplexed immunostaining and multiple rounds of enzymatic activity stains. Lastly, the section can be stained using chromogenic dyes (e.g., H&E, toluidine blue, safranin O, etc.) to highlight the tissue architecture. Presented in this section are custom methods adapted from commercially available protocols.
6. Multiple Rounds of Imaging
7. Image Assembly
A General Workflow for the High-Throughput, Multi-Image Cryohistology
Figure 1 represents the general workflow used for this technique. It includes several steps from fixation through several rounds of imaging and finally image alignment/analysis. The process can take as little as a week to go from sample fixation through 4 rounds of imaging, which is less time than it takes to decalcify these type of samples. The order of the imaging typically begins with the endogenous signals that are already in the specimen (e.g., GFPs, mineralization labels, etc.), then multiplexed fluorescent immunostaining followed by fluorescent enzymatic activity assays (e.g., TRAP, AP, etc.) and cell cycle analysis assays (e.g., EdU) and finally finishes with a chromogenic stain (e.g., toluidine blue O, hematoxylin, safranin O, etc.).
Representative Example from a Juvenile Ankle Joint6
The purpose of this particular study was to demonstrate the correlation between expression of different types of collagen (i.e., Col1a1, Col2a1, and Col10a1) with mineralization of the fibrocartilage of the Achilles tendon-to-bone insertion site (i.e., enthesis). Therefore, a triple transgenic fluorescent reporter mouse including Col1a1-GFPTpz, Col2a1-CFP, and Col10a1-mcherry was used to identify cells expressing each transgene. The first round of imaging was of the endogenous transgene expression from a two-week-old mouse, which corresponds to when the enthesis mineralizes in the Achilles tendon (Figure 4B). The second round of imaging was then conducted on the multiphoton microscope to acquire images of the collagen architecture via two photon second harmonic generation (SHG, Figure 4C). This step was used to identify cells at the base of the collagen fibers within the enthesis. The third round of imaging was an immunostaining step for Indian hedgehog (IHH), which is one of the main signaling ligands that promotes mineralization of the enthesis (Figure 4D). The fourth round of imaging was AP staining using a blue alkaline phosphatase substrate kit, which elicits both Cy5 fluorescence and blue chromogenic signals, to visualize areas of active mineral deposition (Figure 4E). Finally, the fifth round of imaging was TB staining to visualize the anatomical features including the proteoglycan content within the fibrocartilage (Figure 4F). All images were manually aligned within image editing software. The five rounds of imaging were conducted over a 4-day period, which followed 3 days of sample processing and sectioning (7 days total).
Representative Example from an Adult Knee Joint11
The purpose of this experiment was to determine the mineralization changes that occur in the enthesis of the medial collateral ligament (MCL) of the knee following joint destabilization via transection of the anterior cruciate ligament (ACL). Mineralization changes can be seen in the MCL enthesis as early as two weeks post-surgery in these 3-month-old mice. To monitor mineral apposition of fibrocartilage within the enthesis, a mineral label was given to the mice on the day of surgery (demeclocycline) and the day before sacrifice (calcein) at 2 weeks post-surgery. The mice also included Col1a1-CFP and Col10a1-mcherry fluorescent reporters to monitor collagen expression of unmineralized and mineralized fibrochondrocytes, respectively. The first round of imaging was of the endogenous signals, which in this case corresponded to the fluorescent proteins and fluorescent mineralization labels (Figure 5A). The second round included TRAP staining to demonstrate expression of this enzyme in mineralizing fibrochondrocytes in the enthesis as well as osteoclasts in the underlying bone marrow (Figure 5B). The third round was AP staining to demonstrate regions of active mineralization of fibrochondrocytes as well as osteoblasts of the underlying bone (Figure 5C). Finally, TB staining was conducted for the fourth round (Figure 5D). All images were manually aligned within image editing software. Once again the total time taken from tissue harvest to image alignment was 7 days.
Representative Example of Trabecular Bone from Distal Femur
The purpose of this study is to phenotype the skeleton of mice with varying genetic backgrounds by conducting automated dynamic histomorphometry (www.bonebase.org). Three-month-old mice were given two mineralization labels (calcein 7 days prior to sacrifice and alizarin complexone 2 days prior to sacrifice). Distal femurs from four separate mice were embedded within the same frozen block and then cut together. The section containing four bones was glued down to the slide. Next, another section containing 4 additional bones was glued down adjacent to the first section. Therefore, a total of 8 bones were applied to each slide (Figure 3B). This process was conducted on 8 female and 8 male mice at 3 different levels within the bone marrow, yielding a total number of 12 slides. The reference markers (microspheres) were applied within the epiphysis and the mid-diaphysis on the dry sections (Figure 3C). All 12 slides were stained for calcein blue and imaged for accumulated mineral (calcein blue) and mineralization labels (calcein and alizarin complexone) during the first round of imaging (Figure 6A). The slides were then imaged for TRAP activity (Figure 6B) in the second round and AP activity (Figure 6C) in the third round of imaging. Finally, the slides were stained with toluidine blue in the fourth round (Figure 6D). The reference markers were imaged during every imaging round, including the chromogenic round, and were aligned using the custom software. To provide an idea of the throughput for this procedure, 32 bones (16 femurs and 16 vertebrae) were embedded in 8 blocks, 3 sections were taken from each block, the sections were distributed across 12 slides, and the 12 slides were imaged 4 times producing 96 composite image stacks. The total time to perform this experiment was 8 days.
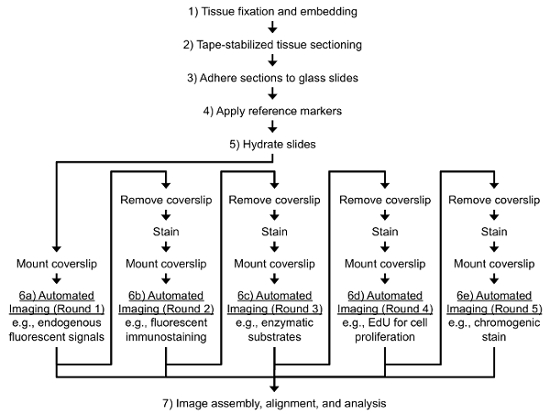
Figure 1. Typical Workflow for the Protocol. General steps include 1) tissue fixation, 2) tape-stabilized cryosectioning, 3) adherence of taped sections to glass slides, 4) application of reference markers, 5) multiple rounds of staining and 6) imaging, and 7) image assembly, alignment, and analysis. Please click here to view a larger version of this figure.
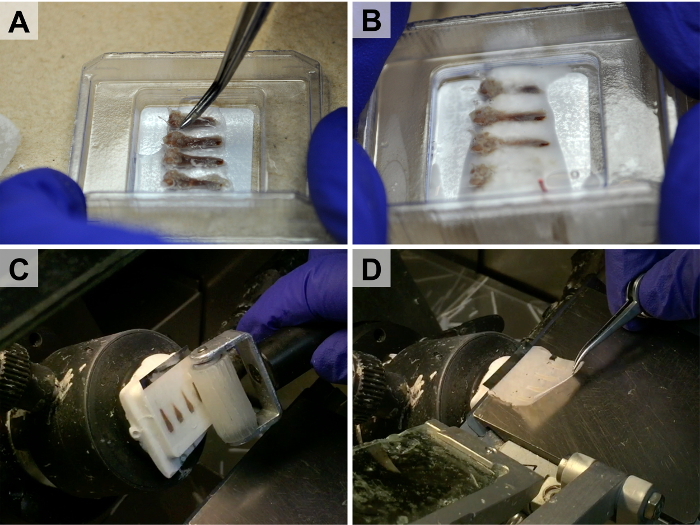
Figure 2. High-throughput Embedding and Tape-stabilized Cryosectioning. Because of the stability the cryotape provides, multiple bones can be embedded adjacent to each other (A-B) and sectioned simultaneously (C-D). A piece of dry ice is used during the embedding process to rigidly fix the bones in place prior to freezing the entire cryo-block (B). The cryotape is rolled onto the block (C) and the section remains stuck to the tape during sectioning (D). Please click here to view a larger version of this figure.
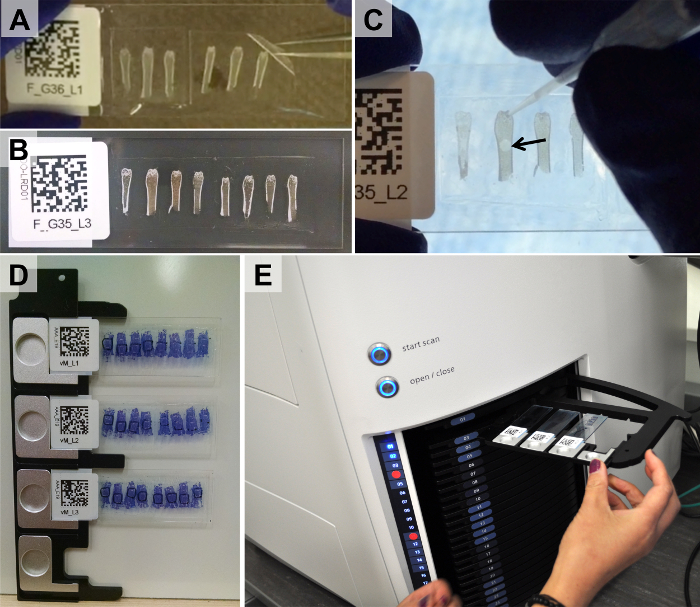
Figure 3. Adherence of Taped Sections to Glass Slides, Application of Reference Markers, and Loading of Slides into Tray of Slide-scanning Microscope. Taped sections are glued to the surface of glass slides with either UV-curing or chitosan-based adhesive (A). Following curing or drying, only a thin, flat layer of adhesive remains between the cryotape and glass surface (B). Reference markers are applied to dry slides (C, arrow points to drop of microsphere solution). Slides are then mounted in microscope trays (D) and loaded into the microscope (E). Please click here to view a larger version of this figure.
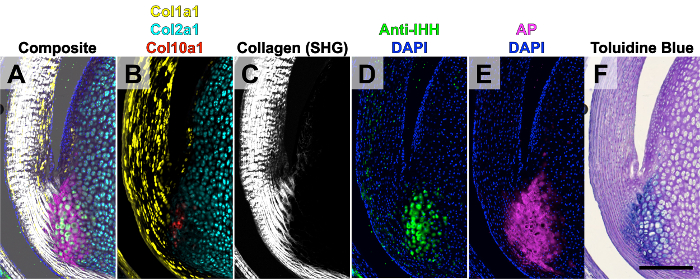
Figure 4. Five Rounds of Imaging of the Achilles Tendon from a Two-week-old Mouse. The composite image stack (A) was created from five rounds of imaging. Round 1 (B): endogenous Col1a1-GFPTpz, Col2a1-CFP, and Col10a1-mcherry transgene expression. Round 2 (C): collagen second harmonic generation (SHG) on the two photon microscope. Round 3 (D): immunostaining for IHH. Round 4 (E): AP enzymatic activity. Round 5: toluidine blue O (F). This figure has been modified from Dyment et al., 20156. Scale bar = 200 μm. Please click here to view a larger version of this figure.
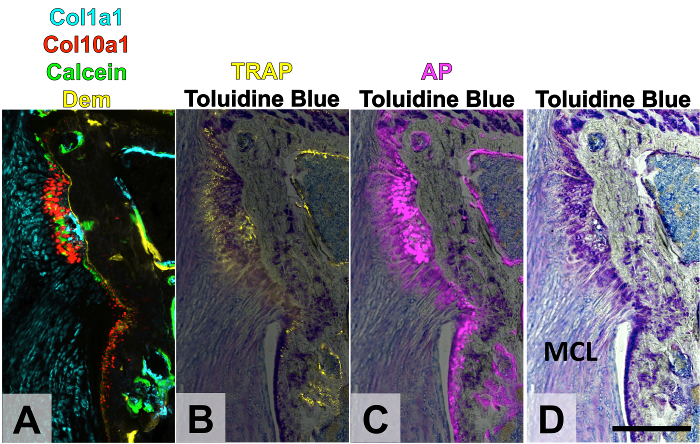
Figure 5. Four Rounds of Imaging of MCL Enthesis Following Joint Destabilization. Knees were destabilized in three-month-old mice, leading to increased mineralization of the MCL enthesis. A demeclocycline mineral label was given the day of surgery and a calcein mineral label was given the day before sacrifice. Round 1 (A): endogenous Col1a1-CFP, Col10a1-mcherry transgene expression with demeclocycline and calcein mineral labels. Round 2 (B): TRAP enzymatic activity. Round 3 (C): AP enzymatic activity. Round 4 (D): toluidine blue O. The TRAP and AP signal was overlaid on top of the TB signal in panels B-C. The yellow channel can be used again for TRAP because the TRAP buffer decalcifies the tissue, removing the demeclocycline label. This figure has been modified from Dyment et al., 201511. Scale bar = 200 μm. Dem: demeclocycline, TRAP: tartrate-resistant acid phosphatase, AP: alkaline phosphatase, MCL: medial collateral ligament. Please click here to view a larger version of this figure.
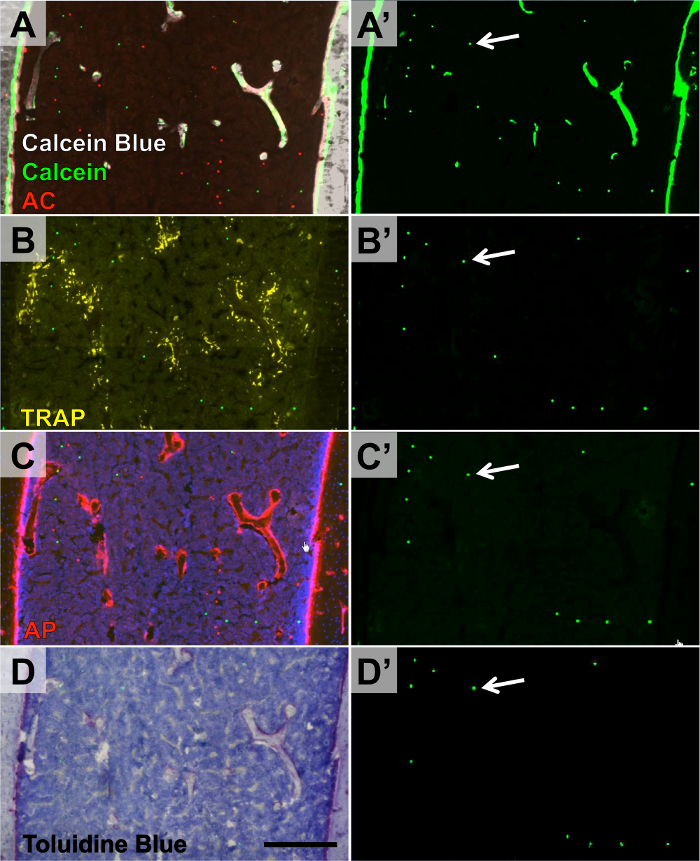
Figure 6. Four Rounds of Imaging within Distal Femur Containing Microsphere Reference Markers. Three-month-old mice were given calcein and alizarin complexone mineral labels. Round 1 (A-A'): endogenous calcein and alizarain complexone labels in addition to calcein blue staining of accumulated mineral. Round 2 (B-B'): TRAP enzymatic activity. Round 3 (C-C'): AP enzymatic activity. Round 4 (D-D'): toluidine blue O. The green microspheres were imaged during each round (A'-D', arrow denotes the same microsphere in all images). Scale bar = 200 μm. Please click here to view a larger version of this figure.
Chitosan adhesive | UV-curing adhesive | |
Adhesive mechanism | Evaporation | UV Polymerization |
Curing time | > 24 hr | < 20 min |
Can sections be removed after adhesive cures? | Yes | No |
Is cured adhesive dissolvable? | Yes, in acidic solutions with low pH | No |
Does adhesive withstand heat antigen retrieval? | No | Yes |
Is adhesive auto-fluorescent? | No | Minimal in UV range |
Table 1. Comparison Between Chitosan Adhesive and UV-curing Adhesive
Cryotape | Tape-Transfer System | |
Possible to section mineralized bone using this system? | Yes | Yes, but pieces of mineralized bone may not transfer completely to the slide |
Possible to section mineralized joints using this system? | Yes | Yes |
Possible to section brain using this system? | Yes, but tissue may fall off of tape after multiple rounds of imaging | Yes |
Possible to cut multiple samples embedded in the same block? | Yes | Yes |
Possible to conduct multiple rounds of imaging on same section? | Yes | Yes |
Table 2. Comparison Between Cryotape System and Tape-transfer System
Here we have presented a detailed cryohistology protocol to co-localize and quantify several biological measures by aligning images from multiple rounds of staining/imaging on a single section. The method outlined using the cryotape is especially useful as it maintains the morphology of difficult to section tissue (e.g., mineralized bone and cartilage). In addition, the sectioned tissue is adhered firmly to the glass slide, allowing for multiple rounds of staining/imaging of the same section; unlike traditional methods where serial sections are each stained with a different protocol. Using serial sections can pose an issue when attempting to co-localize signals between the sections, something that is not a problem with single sections that have been stained and imaged with multiple rounds.
The first tape-stabilized tissue sectioning product on the market was a tape transfer system16, 17. It uses plastic tape coated with a cold temperature adhesive that is placed on the surface of the tissue cryoblock. When the cryostat blade cuts beneath the tape, the section is removed intact and adherent to the tape. Subsequently the tape is placed sample side down onto slides that are coated with UV-curing glue such that the tissue becomes rigidly attached to the slide. Once the tape is pealed away from the section, the slide can be processed for either fluorescence or chromogenic histology. The background fluorescence of the adhesives is low, and multiple rounds of staining and imaging works well with most soft tissues. However with mineralized sections, there can be loss of mineral fragments when transferring the tissue from the adhesive tape to the glass slides. In addition, it is a relatively expensive system to install in the cryostat (> $ 8,000) and consumable costs are high (> $ 2/slide).
Another tape stabilization strategy developed by Dr. Tadafumi Kawamoto uses an adhesive coated polyvinylidene chloride film to capture the tissue section. In their protocol, a fresh frozen tissue is sectioned onto the tape and immediately fixed in PFA or ethanol18. Subsequently, the tape is stained and then mounted on a glass slide with the sample side down for microscopic examination. Thus each staining protocol is performed on a different taped section.
We have modified and added to the Kawamoto protocol in a number of ways including fixing the sample in formalin prior to embedding. This step is critical to fix the soluble cytoplasmic GFP of transgenic animals within the limits of the cell. We have utilized the cryotape for a wide range of tissue types5-13. Laboratory personnel with limited histological experience can produce high-quality sections with this method. The primary advantages of this protocol are the relative low cost (no special instrumentation, < $ 1.00 per slide), no loss of mineral fragments, and the ability to perform multiple rounds of staining and imaging on the same section.
Because imaging the same regions of a slide multiple times in repetition would be unreasonable for a large number of slides even using a motorized stage, another critical step of this protocol is the utilization of a slide-scanning microscope to increase consistency and throughput. The microscope is a digital slide scanner that operates under both epifluorescence and transmitted light. It is equipped with a 10-position motorized turret and both B&W and color cameras. The true novelty of the system, in our hands, is that specific regions of interest can be quickly and easily defined by the user or detected automatically by the imaging software. These regions of interest can then be saved from the first round of imaging and then reloaded quickly during the subsequent rounds. Therefore, the same regions of interest are imaged during each round of imaging. Based on user-defined parameters in the software, the microscope will autofocus and scan tiled images that are stitched during acquisition within the regions of interest.
The order by which the user performs the multiple rounds of staining is important. The general order is outlined in Figure 1. The number of fluorophores that can be sufficiently separated via fluorescent microscopy is the primary limiting factor to the number of response measures that can be acquired on a given section. However, fluorescent channels can be reused in certain cases. For instance, calcein blue and demeclocycline both emit a strong signal in the yellow channel used to measure TRAP activity. This bleed-through is avoided though because the TRAP buffer decalcifies the section, thereby removing the mineral prior to imaging the TRAP activity. In addition, DAPI counterstain will emit in the yellow channel as well. However, the user can replace DAPI with another counterstain in the red or far-red range. In addition, antibodies can be stripped and re-stained with different antibodies using the same fluorescent channels. Therefore, this method is quite adaptable to increasing the number of response measures that can be recorded on a given section.
There are certain limitations with the presented protocol. 1) The cryotape may not adhere sufficiently to certain tissues. For instance, formalin-fixed brain sections tend to fall off the tape after multiple rounds of staining. For tissues such as this, the tape transfer system may be more appropriate as the tissue is adhered to the glass surface via UV-activated adhesive (see Table 2 for comparison between these two methods). 2) The chitosan adhesive, while providing transparent optical properties, will not survive harsh processing steps that include high temperatures or strong acids. Therefore, the UV-activated adhesive is more suitable for these applications (see Table 1 for comparison between these two adhesives).
The cryohistological protocols presented here also lend themselves to higher throughput and automation. For instance, the tape stabilization provided by the cryotape allows for relatively novice users to cut multiple bones or joints at once in the same block, significantly increasing throughput. Using an automated scanner significantly reduces technician time and cost related to imaging, which has typically been the rate-limiting step in our experience. Being able to consistently and reliably image the same region of interest several times in a short period of time provides a platform for automated, objective analysis of tissues. In fact, our group has developed a platform for computer-automated alignment and histomorphometry of bone. First, the software aligns the multiple rounds of images based on the fluorescent reference markers. Then, the aligned images are fed into a histomorphometry pipeline where the computer software defines the region of interest and objectively measures several static and dynamic measurements (see more at www.bonebase.org)13. This platform was made possible because of the increased throughput and consistency provided by the cryotape sectioning, digital slide-scanning microscope, and custom analysis software. This protocol represents a significant advancement in high throughput cryohistology and should be of use to those imaging difficult to section tissues such as bone as well as those inexperienced with tissue sectioning.
The authors have nothing to disclose.
The authors would like to acknowledge the following funding sources: NIH R01-AR063702, R21-AR064941, K99-AR067283, and T90-DE021989.
10% neutral buffered formalin | Sigma Aldrich | HT501128-4L | Multiple suppliers available. Toxic. Can be substituted with 4% paraformaldehyde. |
Sucrose | Sigma Aldrich | S9378 | Multiple suppliers available. |
PBS | Sigma Aldrich | P5368 | Multiple suppliers available. |
Cryomolds | Fisher Scientific | Fisherbrand #22-363-554 | Different sizes can be used depending on tissue |
Cryomatrix | Thermo Scientific | 6769006 | Can be substitituted with other cryomatrices. However, PVA/PEG-based resins have worked best in our hands. |
2-methyl-butane | Sigma Aldrich | M32631 | Multiple suppliers available. |
Cryostat | Leica Biosystems | 3050s | Can be substituted with other brands/models. |
Specimen disc | Leica Biosystems | 14037008587 | Can be substituted with other brands/models. |
Cryostat blades | Thermo Scientific | 3051835 | Can be substituted with other brands/models. |
Cryotape | Section Lab | Cryofilm 2C | |
Roller | Electron Microscopy Sciences | 62800-46 | Can be substituted with other brands/models. |
Plastic microscope slides | Electron Microscopy Sciences | 71890-01 | Can be substituted with other brands/models. |
Glass microscope slides | Thermo Scientific | 3051 | Can be substituted with other brands/models. |
Norland Optical Adhesive, 61 | Norland Optical | Norland Optical Adhesive, 61 | |
UV Black Light | General Electric | F15T8-BLB | |
Glacial acetic acid | Sigma Aldrich | ARK2183 | Multiple suppliers available. |
Chitosan | Sigma Aldrich | C3646 | Multiple suppliers available. |
InSpeck red microscopheres | ThermoFisher Scientific | I-14787 | |
InSpeck green microspheres | ThermoFisher Scientific | I-14785 | |
Calcein Blue | Sigma Aldrich | M1255 | Multiple suppliers available. |
Calcein | Sigma Aldrich | C0875 | Multiple suppliers available. |
Alizarin complexone | Sigma Aldrich | A3882 | Multiple suppliers available. |
Demeclocycline | Sigma Aldrich | D6140 | Multiple suppliers available. |
NaHCO3 | Sigma Aldrich | S5761 | Multiple suppliers available. |
Glycerol | Sigma Aldrich | G5516 | Multiple suppliers available. |
ELF 97 yellow fluorescent acid phosphatase substrate | ThermoFisher Scientific | E-6588 | |
DAPI | ThermoFisher Scientific | 62247 | Multiple suppliers available. Can be substituted with Hoechst 33342 or other nuclear dyes. |
TO-PRO-3 (Cy5 nuclear counterstain) | ThermoFisher Scientific | T3605 | |
Propidium Iodide | ThermoFisher Scientific | R37108 | Multiple suppliers available. |
Sodium acetate anhydrous | Sigma Aldrich | S2889 | Multiple suppliers available. |
sodium tartrate dibasic dihydrate | Sigma Aldrich | T6521 | Multiple suppliers available. |
Sodium nitrite | Sigma Aldrich | S2252 | Multiple suppliers available. |
Tris | Sigma Aldrich | 15504 | Multiple suppliers available. |
MgCl2 hexahydrate | Sigma Aldrich | M9272 | Multiple suppliers available. |
NaCl | Sigma Aldrich | S7653 | Multiple suppliers available. |
Fast Red TR Salt | Sigma Aldrich | F8764 | Multiple suppliers available. Can also be substituted with other substrate kits such as Vector Blue (Vector Laboratories, Cat# SK-5300) |
Naphthol AS-MX | Sigma Aldrich | N4875 | Multiple suppliers available. |
N,N dimethylformamide | Sigma Aldrich | D158550 | Multiple suppliers available. |
Toluidine blue O | Sigma Aldrich | T3260 | Multiple suppliers available. |
Axio Scan.Z1 | Carl Zeiss AG | Axio Scan.Z1 | Other linear or tiled scanners may also be used. |
DAPI Filter Set | Chroma Technology Corp. | 49000 | |
CFP Filter Set | Chroma Technology Corp. | 49001 | |
GFP Filter Set | Chroma Technology Corp. | 49020 | |
YFP Filter Set | Chroma Technology Corp. | 49003 | |
Custom yellow (ELF 97) Filter Set | Chroma Technology Corp. | custom; HQ409sp, HQ555/30m, 425dxcr | |
TRITC Filter Set | Chroma Technology Corp. | 49004 | |
Cy5 Filter Set | Chroma Technology Corp. | 49009 | |
CryoJane Tape Transfer System | Electron Microscopy Sciences | 62800-10 | Multiple suppliers available. |
CryoJane Tape Windows | Electron Microscopy Sciences | 62800-72 | Multiple suppliers available. |
CryoJane Adhesive Slides | Electron Microscopy Sciences | 62800-4X | Multiple suppliers available. |