The acidic tumor microenvironment plays critical roles in tumor progression. To assess the effects of acidic extracellular pH on cancer cells in vitro, we established simple acidic culture systems.
Conditions of the tumor microenvironment, such as hypoxia or nutrient starvation, play critical roles in cancer progression and malignancy. However, the role of acidic extracellular pH in tumor aggressiveness and its underlying mechanism has not been extensively studied compared to hypoxic or nutrient starvation conditions. In addition, a well-defined culture method to mimic the acidic extracellular tumor microenvironment has not been fully reported.
Here we present a simple in vitro culture method to maintain acidic extracellular pH using reduced bicarbonate and increased lactate or HCl concentrations in the culture medium. The medium pH was sustained for at least 24 h and gradually decreased by 72 h following culture of PANC-1 and AsPC-1 pancreatic cancer cells. Three distinct acidic media conditions in this study highly upregulated pH-responsive genes such as MSMO1, INSIG1, and IDI1 compared to hypoxia or nutrient starvation. The upregulation of these genes can be used as a marker of acidic pH. These simple techniques are beneficial to elucidate underlying mechanisms of tumor malignancy under acidic tumor microenvironment. Therefore, our extracellular acidic pH culture system enables discovery of cellular acidic pH responses not only in cancer cells but also in primary cells, such as renal tubular cells, in relation to the other acidic disorders including, diabetic ketoacidosis, lactic acidosis, renal tubular acidosis, and respiratory acidosis.
The tumor microenvironment plays critical roles in tumor progression and cancer cell metabolism1,2,3. Cancer cells are often exposed to conditions such as hypoxia, nutrient deprivation, and acidic extracellular pH (pHe). However, the role of pHe in tumor progression has not been clarified as extensively as in hypoxia or nutrient starvation. The pHe in the tumor tissue can become acidic, reaching approximately pH 6.84,5. The acidic pH arises from aerobic and anaerobic glycolytic excretion of protons (H+) and lactate by proliferating cancer cells5,6.
Recent studies revealed that acidic pHe-induced histone deacetylation, fatty acid oxidation, and exocytosis of acidic lysosomes for adaption to the severe acidic environment7,8,9,10. However, the mechanisms through which extracellular acidification affects cancer behavior and the identity of key regulators in the acidic pH tumor microenvironment have not been fully determined. Furthermore, several reports described various acidic pH media using unclear concentrations of bicarbonate, Tris, PIPES, and HEPES buffer or lactate and HCl, but there are few reports to demonstrate the stability of the adjusted medium nor comprehensive comparison of several distinct acidic culture media7,8,9,10
To elucidate the key regulators and metabolic changes in cancer cells in the context of extracellular acidification, we established a simple in vitro culture model to maintain an acidic pHe and examined the role of pHe in cancer cells11. Using this method, we maintained an acidic culture medium with a pHe of 6.8 at 37 °C under 5% CO2, using reduced bicarbonate concentrations in the culture medium. pH 7.4 was used as normal and control medium. The medium pH was sustained for at least 24 h and gradually decreased by 72 h during culture of PANC-1 and AsPC-1 pancreatic cancer cells. Because enhanced glycolysis accelerates excretion of not only protons but also lactate7,8,9, we also established a culture method mimicking lactate-induced acidosis by adding lactate rather than reducing the bicarbonate concentration. Additionally, HCl-induced acidic pHe in the medium allows us to exclude the possibility that cellular responses to acidic pH culture medium are not due to a reduced concentration of bicarbonate. Moreover, using various media with a pH of 6.4 to 7.4 with different bicarbonate concentration, we can assess the extent of pHe effects on cellular responses.
1. Preparation of Acidic Culture Medium
2. Harvesting and Treating Cells
3. RNA Isolation
4. cDNA Synthesis
5. Measurement of Acid-responsive Gene Expression Using Real-time PCR
To determine the appropriate bicarbonate concentration, we prepared DMEM at range of 0 – 8 mM NaHCO3 (final concentration in the culture medium) and succeeded in preparing culture media with pH ranging from 6.4 – 7.4 (Figure 1). We prepared DMEM with 8 mM NaHCO3 (pH 7.4) as a control medium, and 2 mM NaHCO3 (pH 6.8) as a medium with acidic pH according to a previous report stating that the extracellular pH reaches pH 6.8 for solid tumors4,5. The pH of the acidic medium was sustained for 24 h, and gradually decreased to approximately pH 6.6 for 72 h during culture of PANC-1 and AsPC-1 cells (Figure 2). Next, to determine the amount of lactate or HCl required to adjust the control medium (pH 7.4) to pH 6.8, we added various amounts of lactate or HCl to the control medium and measured the pH of the medium, and found that the pH of the control medium with a final concentration of 22.5 µM lactate and 6.25 mM HCl reached a value of 6.8 (Figure 3).
The effect of extracellular acidification using a medium with low pH can be easily evaluated based on upregulation of acidic pH-responsive genes such as MSMO1, IDI1, and INSIG1. Expression of these genes was highly increased under low pH compared to their expression under hypoxia or nutrient starvation (Figure 4). In addition, the upregulation of these genes was not specific to a medium in which the acidic pH was caused by reduced bicarbonate levels, and they were also upregulated by a medium in which acidic pH was caused by the addition of lactate and/or HCl (Figure 5). Comparison of cellular responses to media in which the acidic pH is derived from reduced bicarbonate levels or the addition of lactate or HCl enables us to determine if cellular responses are specific to certain types of acidification. Upregulation of acidic pH responsible genes such as IDI1, MSMO1, and INSIG1 under extracellular low pH also occurs in normal cells (Figure 6), so our method can be applied to not only tumor cells but also normal cells. Under high pH condition, the expression level of pH-responsible genes was not upregulated in PANC-1 and AsPC-1 cells (Figure 7), which can be used as negative control.
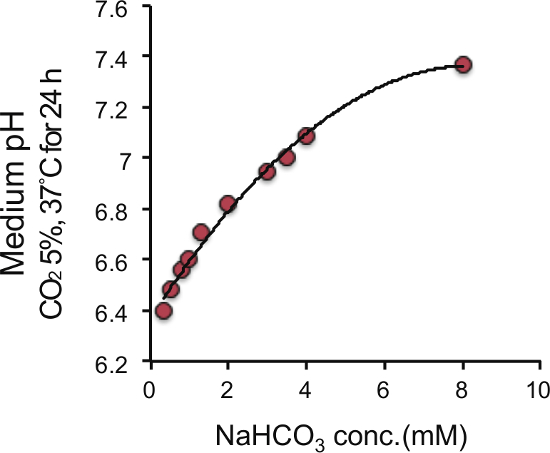
Figure 1. Correlation between NaHCO3 concentration and medium pH. Horizontal axis shows concentration of NaHCO3 and vertical axis shows medium pH at 37 °C under 5% CO2. Please click here to view a larger version of this figure.
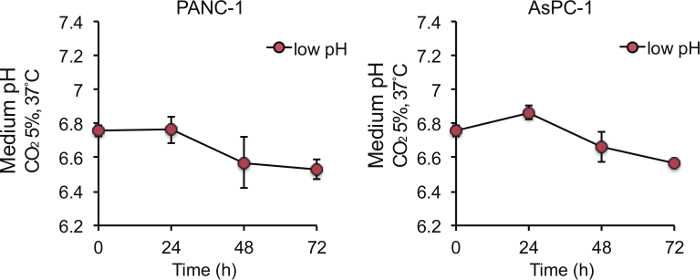
Figure 2. Change of medium pH of low-pH (pH 6.8) culture medium during 72 h-culture. Medium pH was sustained for 24 h and gradually decreased for 72 h during culture of PANC-1 and AsPC-1 cells. 5.0 x 10⁵ cells were seeded to a 10-cm dish in 10 mL of medium, incubated for 24 h, and changed to low pH culture medium. Data are presented as the mean ± SEM of at least three independent experiments. Please click here to view a larger version of this figure.
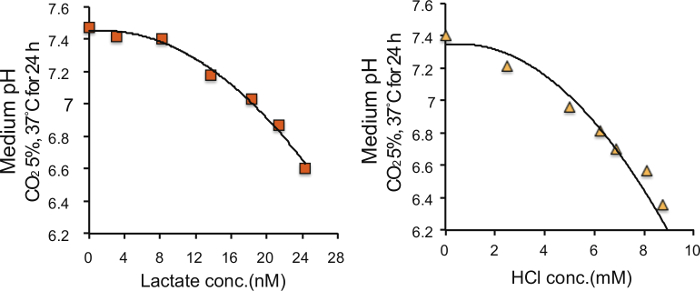
Figure 3. Correlation between lactate or HCl concentrations and pH of the medium. The control medium (pH 7.4) was buffered with various concentrations of lactate or HCl. Please click here to view a larger version of this figure.
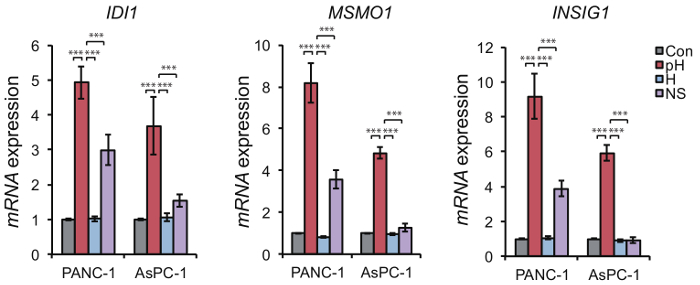
Figure 4. Transcriptional upregulation of acidic pH-responsive genes in response to low pH. Expression level of MSMO1, IDI1, and INSIG1 was higher in PANC-1 and AsPC-1 cells in the context of low pH (pH) than under hypoxia (H) or nutrient starvation (NS) conditions after 24 h. Data are presented as the mean ± SEM of at least three independent experiments. Student's t-tests were performed for the indicated comparisons. ***p <0.005. Please click here to view a larger version of this figure.
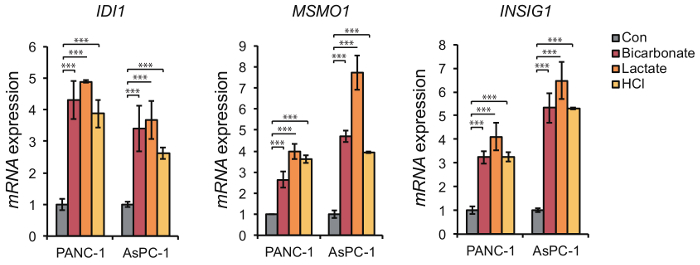
Figure 5. Transcriptional upregulation of acidic pH-responsive genes in response to lactic acidosis and HCl-mediated acidosis. Expression of IDI1, MSMO1, and INSIG1 mRNAs in PANC-1 cells and AsPC-1 cells was determined by quantitative real-time polymerase chain reaction analysis under control (Con; pH 7.4), low pH (pH; pH 6.8, reduced amount of NaHCO3), lactic acidosis (lactate; pH 6.8, increased amount of lactate), and HCl-mediated acidosis (HCl; pH 6.8, increased amount of HCl) conditions for 24 h. Data are presented as the mean ± SEM of at least three independent experiments. Student's t-tests were performed for the indicated comparisons. ***p <0.005. Please click here to view a larger version of this figure.
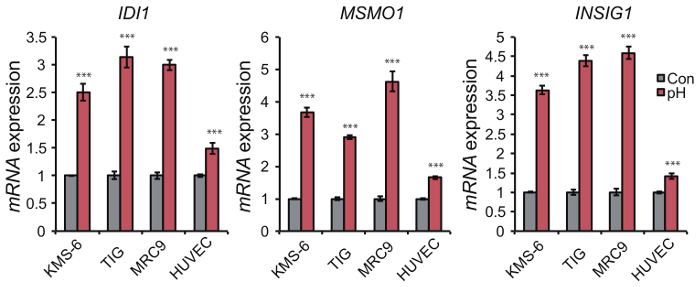
Figure 6. Transcriptional upregulation of acidic pH-responsive genes in response to low pH in normal cells. Expression level of MSMO1, IDI1, and INSIG1 was upregulated in fibroblastic KMS-6, TIG, and MRC9 cells and endothelial HUVEC cells after 24 h. Data are presented as the mean ± SEM of at least three independent experiments. Student's t-tests were performed for the indicated comparisons. ***p <0.005. Please click here to view a larger version of this figure.
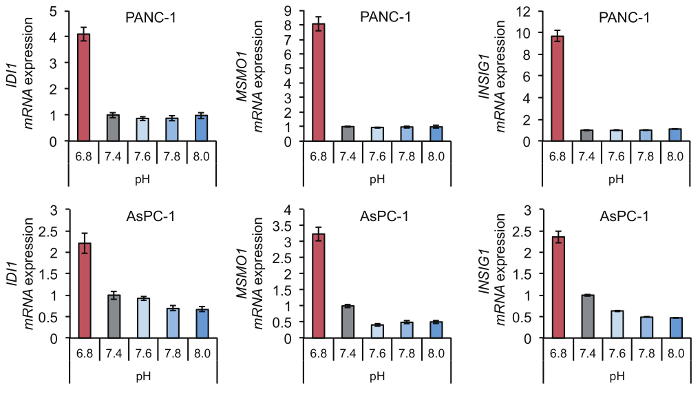
Figure 7. Expression level of acidic pH-responsible genes under high pH (pH 7.6 to 8.0) condition in comparison under low pH (pH 6.8). The expression level of pH-responsible genes such as IDI1, MSMO1, and INSIG1 remains unchanged under high pH (pH 7.6 to 8.0) conditions in PANC-1 and AsPC-1 cells after 24 h. Data are presented as the mean ± SEM of at least three independent experiments. Please click here to view a larger version of this figure.
Primer | Forward primer sequence | Primer | Reverse pimer sequence | ||
ACTB | 5'-AGAAGGAGATCACTGCCCTGGCACC-3' | ACTB | 5'-CCTGCTTGCTGATCCACATCTGCTG-3' | ||
MSMO1 | 5'-ATCATGAGTTTCAGGCTCCATT-3' | MSMO1 | 5'-AAGCACGATTCCAATGAAAAAT-3' | ||
INSIG1 | 5'-TGGCAGCTTCCCAAGTATTC-3' | INSIG1 | 5'-ACTGCGGGTTGGTAATTGAG -3' | ||
IDI1 | 5'-TGGATAAAACCCCTGTGGTG-3' | IDI1 | 5'-CAACATCCGGCATAACTGTG-3' |
Table 1. List of primers used in quantitative real-time PCR analysis.
Here, we described a simple acidic pH culture system and its evaluation process. The combination of three methods of medium acidification, i.e., reduced bicarbonate concentration, lactate addition, and HCl addition, enabled us to investigate the pH-response mechanism thoroughly and to compare the cellular response to other tumor microenvironmental conditions such as hypoxia or nutrient starvation.
The key of this method is to determine the appropriate concentrations of bicarbonate, lactate, and HCl in the culture medium. Measuring the medium pH with various bicarbonate concentrations when performing this method for the first time is important to determine the appropriate amount of NaHCO3 in the medium. During this process, it is necessary to measure the medium pH after 24 h of incubation at 37 °C under 5% CO2, as medium temperature and equilibrium status of CO2 greatly affect the medium pH. Autoclaving of bicarbonate is frequently recommended, as bicarbonate easily becomes flat. Cell density and cell confluency are crucial factors because large numbers of growing cancer cells easily acidify the culture medium even in control samples. In addition, responses to the extracellular acidic pH depend on the condition of the cells and may fade as cells are passaged, so cells with less than 10 passages were used for the experiments.
Our method has significantly demonstrated the stability of medium pH for 24 h and compared several acidic pH media. In this protocol, medium pH of 6.8 was used as a low pH condition, but serial acidic pH between pH 6.4 and 6.9, in addition to serial basic pH media between pH 7.4 and 8.0, were used to investigate cellular response against extracellular acidification.
We mainly focused on cancer cells, but this method can be used for other types of cells within the tumor microenvironment, including stromal cells, immune cells, and vascular endothelial cells. We and others reported that at least some pH sensitive mechanisms in cancer cells are common in normal cells7. It is also possible to apply this method for the analysis of other primary cells as well as embryonic stem cells and induced pluripotent stem cells. One limitation of this culture system could be the difficulty of maintaining the acidic pH condition in long-term experiments.
Acidosis is associated with various types of diseases. This method can be applicable not only in cancer research but also in studying acidic disorders such as diabetic ketoacidosis, renal tubular acidosis, and respiratory acidosis.
The authors have nothing to disclose.
We thank the members of the Division of Genome Science and Laboratory for Systems Biology and Medicine, RCAST, The University of Tokyo. We especially thank Dr. H. Aburatani, Dr. T. Kodama, (LSBM, RCAST, The University of Tokyo), Dr. K. Tomizuka, Dr. T. Yoshida, and Dr. A.
Kunisato (Kyowa Hakko Kirin Co., Ltd.) for helpful discussions and support. This work was partly supported by Grant-in-Aid for Young Scientist (A) (26710005, T.O.), Grant-in-Aid for Scientific Research on Innovative Areas (26116711 and 16H01567, T.O.), and Grant-in-Aid for Challenging
Exploratory Research (16K14605, T.O.) from the Ministry of Education, Culture, Sports, Science and Technology of Japan, the Takeda Science Foundation (T.O.), the Kobayashi Foundation of Cancer Research (T.O.), and the Project for Cancer Research and Therapeutic Evolution (P-CREATE) and the Practical Research for Innovative Cancer Control from Japan Agency for Medical Research and Development, AMED (T.O.).
Reagents | |||
Dulbecco's Modified Eagle Medium“Nissui” 2 | Nissui | 05919 | |
Fetal Bovine Serum | Thermo Fisher | 10438 | |
NaHCO3 | Wako | 191-01305 | |
L-glutamine solution | Thermo Fisher | 25030-081 | |
Penicillin-Streptomycin Mixed Solution(Stabilized) | Nacalai | 09367-34 | |
0.5g/l-Tripsin/0.53mmol/l-EDTA Solution, with Phenol Red | Nacalai | 32778-05 | |
0.5%-Trypan Blue Stain Solution | Nacalai | 29853-34 | |
Lactic acid solution | Sigma-Aldrich | 252476 | |
Hydrochloric acid solution | Sigma-Aldrich | H9892 | |
RNeasy Plus Mini Kit | QIAGEN | 74134 | |
SuperScript IV First-Strand Synthesis System | Thermo Fisher | 18091 | |
Power SYBR Green PCR Master Mix | Applied Biosystems | 4368702 | |
Name | Company | Catalog Number | Comments |
Cell lines | |||
PANC-1 | ATCC | CRL-1469 | |
AsPC-1 | ATCC | CRL-1682 | |
KMS-6 | JCRB Cell Bank | JCRB0432 | |
TIG | JCRB Cell Bank | ||
MRC9 | ATCC | CCL-212 | |
HUVEC | ATCC | CRL-1730 | |
Name | Company | Catalog Number | Comments |
Equipment | |||
NanoDrop One Microvolume UV-Vis Spectrophotometer with Wi-Fi | Thermo Fisher | ND-ONE-W | |
QuantStudio 5 Real-Time PCR System | Thermo Fisher | CRL-1682 |