We present a microfluidic cancer-on-chip model, the "Evolution Accelerator" technology, which provides a controllable platform for long-term real-time quantitative studies of cancer dynamics within well-defined environmental conditions at the single-cell level. This technology is expected to work as an in vitro model for fundamental research or pre-clinical drug development.
Conventional cell culture remains the most frequently used preclinical model, despite its proven limited ability to predict clinical results in cancer. Microfluidic cancer-on-chip models have been proposed to bridge the gap between the oversimplified conventional 2D cultures and more complicated animal models, which have limited ability to produce reliable and reproducible quantitative results. Here, we present a microfluidic cancer-on-chip model that reproduces key components of a complex tumor microenvironment in a comprehensive manner, yet is simple enough to provide robust quantitative descriptions of cancer dynamics. This microfluidic cancer-on-chip model, the "Evolution Accelerator," breaks down a large population of cancer cells into an interconnected array of tumor microenvironments while generating a heterogeneous chemotherapeutic stress landscape. The progression and the evolutionary dynamics of cancer in response to drug gradient can be monitored for weeks in real time, and numerous downstream experiments can be performed complementary to the time-lapse images taken through the course of the experiments.
Cancer has been increasingly recognized as a complex ecosystem that depends not only on the continued dysregulation of mutated cell populations but also on vital interactions between cancer cells and the host microenvironment. In this sense, cancer evolves on an adaptive landscape manifested by a combination of factors, including a heterogeneous tumor microenvironment and crosstalk with a variety of host cells, all of which contribute selective pressures for further genetic or epigenetic changes1,2,3. In the context of solid tumors, uneven distribution of chemotherapeutics and other resource gradients contributes to their molecular heterogeneity and may play a role in the development of drug resistance, increased angiogenesis to particular tumor subpopulations, and even metastasis4,5,6. Conventional in vitro 2D cell culture studies, while possessing large-scale, convenient experimental capacity, provides mean-field, uniform, and fixed conditions, often lacking the precise spatial and temporal environmental control necessary to truly emulate in vivo tumor dynamics. Thus, there is a need for more representative ex vivo models to reproduce the tumor microenvironment prior to animal models in the drug development pipeline in order for a better prediction of cancer progression as well as responses to drugs within dynamical stress landscapes. Microfluidics have been proposed to bridge the gap between 2D cell culture studies and more complex in vivo animal studies that may not be able to support controllable quantitative studies7,8,9.
An ideal in vitro system to characterize cancer cell dynamics should possess the ability to generate a heterogeneous microenvironment to mimic the adaptive cellular responses that may take place in a tumor, as well as allow for the observation of these dynamics at a single-cell resolution. In this article, we describe a microfluidic cell culture platform, a PDMS-based device called the "Evolution Accelerator" (EA), that allows for parallel in vitro studies of cancer cell dynamics at cellular resolution with real-time data acquisition over the course of weeks, while stably maintaining gradients of stress across the culture landscape. The design of this platform is based on our previous work, in which the evolutionary dynamics of organisms in a metapopulation can be accelerated10,11. Specifically, in a group of spatially separated populations that interact at some level, when exposed to a heterogeneous stress landscape, the most fit species can dominate in a local population faster compared with that of a large uniform population. The advantageous species then migrate to neighboring microhabitats in search of resources and space, and eventually dominate the entire population. As shown in Figure 1, the pattern of the microfluidic EA chip is composed of (i) a pair of serpentine channels that provide fresh media circulation and construct fixed boundary conditions for chemical diffusion, and (ii) the hexagonal cell culture region which consists 109 interconnected hexagonal and 24 half-hexagonal chambers in the center, resembling a honeycomb structure. The chip is 100 µm in depth. Media channels and cell culture region are connected with small slits (about 15 µm wide), which prevent direct media flow and the resulting shear stress across the cell culture area, yet still allow chemicals to diffuse through small slits and exchange nutrients, metabolic waste, etc. The generation of chemical gradients is demonstrated in Figure 1B, where one media channel contains 0.1 mM of fluorescein while the other channel is free of fluorescein. Cells are cultured on a gas permeable membrane, encapsulated by the microstructures through the positive back pressure on the membrane against the chip. The components of the device holder are illustrated in Figure 2, and the experimental setup is illustrated in Figure 3, where the culture is maintained on an inverted microscope at 37 °C, with above 85% relative humidity, and conditioned under normoxia gas composition.
This system provides detailed observation of localized cellular interactions via brightfield and fluorescent channels and allows for spatially-resolved downstream assays such as immunofluorescence, Western blot, or mass spectrometry. We have previously demonstrated as a proof-of-principle of this microfluidic cancer-on-chip model on the long-term co-culture of epithelial and mesenchymal PC3 prostate cancer cells12 as well as the emergence of drug-resistance polyploid giant cancer cells using the epithelial PC3 cell line13. While we present the application of this platform to understand the spatiotemporal dynamics of epithelial PC3 and mesenchymal prostate cancer cells under a stress gradient of docetaxel, the microfluidic system can be easily applied to any combination of cell lines and resource (i.e., drug, nutrient, oxygen) gradients.
1. Fabrication of microfluidic device
2. Media and cell line preparation
3. Experimental setup
4. Single-cell time-lapse imaging
5. Image processing and analysis
Validation of optimum cell growth on chip
A major goal of the experiment platform is to reproduce key components and interactions in a complex tumor microenvironment in a comprehensive manner, yet simple enough to provide quantitative, reliable and reproducible data. This goal can only be achieved if we have full control of the physical and biochemical environmental factors. We must either exclude the undesired factors or figure out a way to incorporate the uncontrollable factors into the quantitative model to correctly interpret the population behaviors.
The first test is to ensure optimum cell growth on the device. The cell proliferation rate on the device needs to be identical or comparable to their growth profile in conventional cell culture. As a proof of principle, human prostate cancer cell line PC3 cells were cultured in the PDMS chip without the presence of external stress. These cells were fluorescently-labeled in the cytoplasm so we could observe and quantify the population of cells using inverted fluorescent microscopy. Cells confluence, defined as the area that covered by cells, was measured at each microhabitat at different time frames given a selected intensity threshold on the fluorescent images using Fiji15. The growth curves of cells at each chosen position are plotted in Figure 4. The chosen positions are scattered across the chip, from the region near the apex of media inflow to the apex close to media outlets.
The growth curves in Figure 4B are well-aligned, suggesting the identicality of the cell proliferation profile as a function of position across the chip. The initial slope of the curves reveals the proliferation rate. The doubling time for cells in the device is around 24 hours as shown in Figure 4B from time 0 to 24 hours, which is the same as the doubling time in conventional cultureware13. Therefore, we conclude that without the presence of an external source of stress, the physical and biochemical factors are uniformly distributed, leading to the homogeneous and optimized cell growth from time 50 to 100 hours.
We further considered the ability to quantify cell dynamics between subpopulations in a microenvironment. GFP-expressing PC3-EMT and the mCherry-expressing PC3-EPI cell lines were co-cultured in the EA as shown in Figure 5. Cell confluence, defined as the percentage of area covered by the cells, is measured as the indication of the size of population. Starting from 40% confluence, the co-culture grew fully confluent within 3 days. Interestingly, we may observe the progression of each phenotype in the microenvironment. While the growth curve of total confluence is in the form of logistic growth model, the population of PC3-EMT continued to expand and PC3-EPI was suppressed in the asymptotic phase.
Demonstration of cell motility assay in a mixed population
Cell motility is an important phenotypic behavior. The motility distribution of a population can provide information about the physical interaction of cells, the mechanical properties of local microenvironment, and can sometimes be analyzed as an indication of epigenetic variation of cells. Given that our improved cell culture platform allows nearly continuous imaging, the advantage of having fine temporal resolution maximizes the potential of single cell tracking in a heterogeneous population.
We use the plugin TrackMate16 in Fiji (http://fiji.sc) with customized macro to implement and automate the tracking process. TrackMate allows the user to implement and customize a tracking algorithm using a scripting language from the Fiji Script Editor. The tracking process is divided in a series of steps: the segmentation, filtering, and particle-linking processes.
As shown in Figure 6B, we performed a "wound healing assay" as a demonstration to study cell collective migration and cell-cell interaction. PC3-EPI and PC3-EMT cells were densely seeded in the center of the device and were allowed to freely migrate toward empty region. The normalized histogram of the speed of both phenotypes is plotted in Figure 6C. The velocity of PC3-EMT was significantly higher than PC3-EPI by a factor of 1.8x, which is consistent with the fact that the mesenchymal phenotype serves as a component of cutaneous wound healing with exceptional ability to migrate as opposed to the comparably stationary epithelial phenotype.
Further, in order to observe the progression of cell motility in a stress-free environment, we performed a long-term co-culture of PC3-EPI and PC3-EMT with uniform initial seeding density and tracked the distribution of cell velocity varying with time. As shown in Figure 7A,B, after 6 days of culture, as cells reached higher confluence, the distributions of cell speed for both phenotypes leaned toward the left tails.
We may compare the ratio of number of PC3-EPI to PC3-EMT in each class interval. As shown in Figure 7C, regardless of the days of culture or density of cells, PC3-EMT dominated the high-speed region while PC3-EPI occupied the low speed zone. Although the overall velocity decreased significantly for both phenotypes, PC3-EMT remained motile and was affected less by the crowdedness of the microenvironment as shown in Figure 7D. The average speed of PC3-EPI dropped around 40% while that of PC3-EMT only dropped 14%.
There are several factors that can affect the distribution of cell velocity and the average speed, such as the crowdedness of the population. Continuous cell tracking and monitoring over all subpopulation is essential to understand the progression of phenotypic behavior. For example, if we would like to quantify the level of the mesenchymal status of an unlabeled subpopulation, it would be more informative to acquire not only the distribution of the physical quantity (e.g., velocity) of the interested subpopulation as a function of time, but also that of all the rest of the coexisting subpopulation of cells.
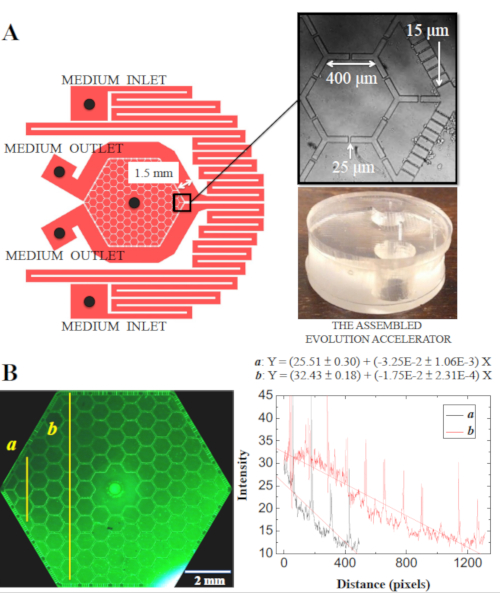
Figure 1: The syringe-pump-driven microfluidic EA chip. (A) The microfluidic device has two separate medium inlets, two outlets, and one central port for cell seeding or extraction of excessive medium. Note that between the medium inlets and the cell culture arrays, a pair of serpentine channels that allow the medium to equilibrate with the atmosphere passed below the gas-permeable membrane. (B) The generation of gradient. The syringes pump the medium with ~ 0.1 mM of fluorescein and no fluorescein respectively into the chip through the 2 medium inlets on the right, extracted out from the chip at the 2 medium outlets on the left. The concentration of fluorescein is proportional to the intensity of fluorescence signal, and is profiled near the medium inlets/outlets a and near the center b. Figure reproduced with permission from Lin et al. 201712. Please click here to view a larger version of this figure.
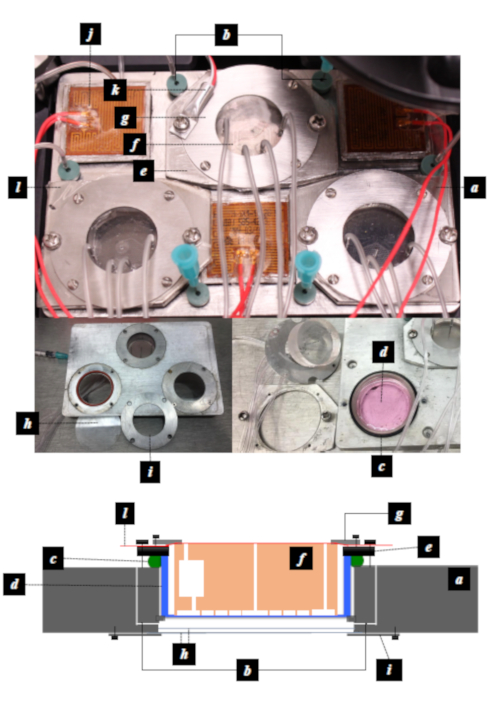
Figure 2: The components of the customized 3 well sample plate. (a) the main body of 3 well plate; (b) a pair of gas channels that allow conditioned atmosphere to be pumped in and vented out through the septa at the entrance of the gas channels; (c) an O-ring designed to seal the space between the well plate and the gas-permeable culture dish; (d) the 35 mm diameter gas-permeable culture dish; (e) the dish holder; (f) the PDMS device; (g) the PDMS chip holders; (h) the double layer 35 mm glass windows designed to maintain thermal isolation and prevent water condensation; (i) glass window holder; (j) heating pads; (k) temperature sensor; (l) the Adhesive sealer that keeps the chip from drying out. Figure reproduced with permission from Lin et al. 201712. Please click here to view a larger version of this figure.
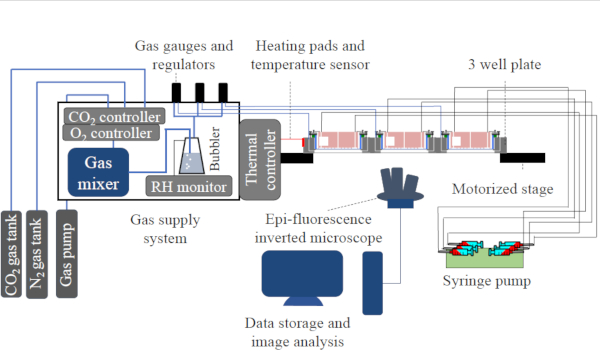
Figure 3: The schematic figure of the experimental setup. The setup of the experiment, including the gas supply system, gas channels connection, the medium supply connection and the imaging system. Figure reproduced with permission from Lin et al. 201712. Please click here to view a larger version of this figure.
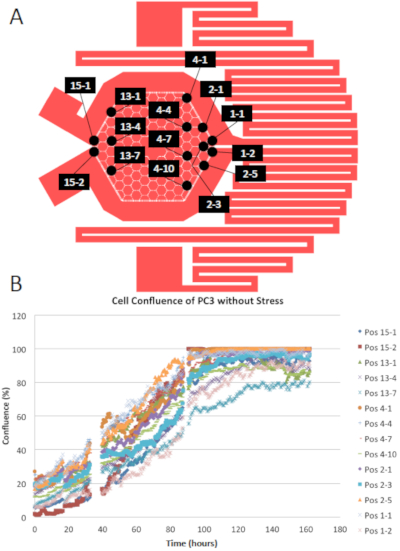
Figure 4: Growth curves of PC3 in the EA without stress. PC3 were cultured in EA without the presence of external stress. (A) Pattern of EA with position labels. (B) Growth curves of PC3 at the chosen positions in terms of cell confluence. Please click here to view a larger version of this figure.
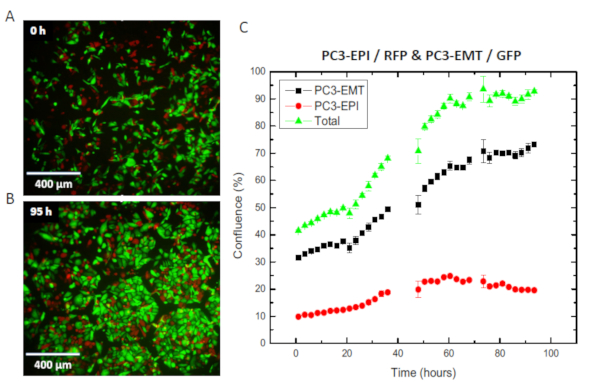
Figure 5: The co-culture of PC3-EPI and PC3-EMT in the EA without stress. PC3-EPI (red) and PC3-EMT (green) were co-cultured in the EA without the presence of external stress. (A) Overlay of two fluorescent channels at t = 0 h. (B) Fluorescent image taken at t = 95 h. (C) Growth curves in terms of cell confluence. Cell confluence of each cell type was measured on the entire chip. Each data point represents the average cell confluence at 3 consecutive time points taken at 15-min intervals. The error bars represent the standard deviation of cell confluence at the 3 consecutive time points. Please click here to view a larger version of this figure.
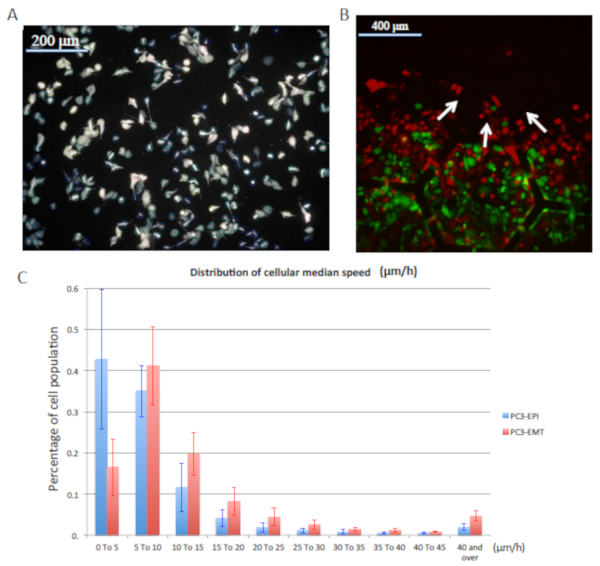
Figure 6: Cell motility assay in a mixed population. The demonstration of single cell tracking performance in a mixed population. (A) A demonstration of how cells are detected by Laplacian of Gaussian (LoG) segmentation. The circles indicate the location of cells detected by the LoG algorithm. The detected cells are linked from frame to frame based on the linear assignment problem to quantify cell motility. (B) The "wound healing assay" of PC3-EPI and PC3-EMT co-culture experiment. Cells were seeded locally up to 100% confluence with a clear boundary at the center. After the installation of the EA chip, cells were observed to migrate through the microhabitat array as indicated by the white arrows. (C) Normalized histogram of cell motility. PC3-EMT is faster than PC3-EPI by a factor of 1.8x. The error bars represent the standard deviation of 5 experiment samples. Please click here to view a larger version of this figure.
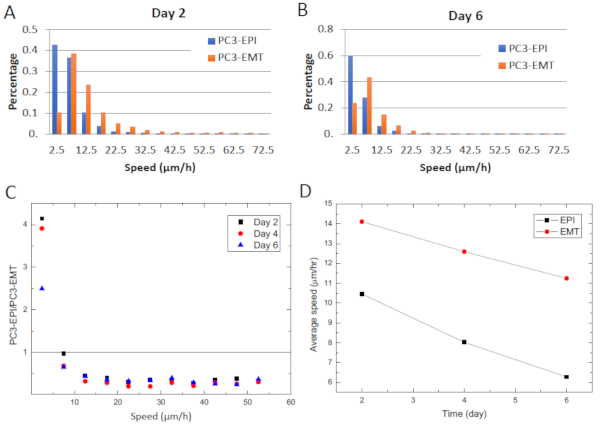
Figure 7: The motility assay of a long-term co-culture of PC3-EPI and PC3-EMT. A long-term co-culture of PC3-EPI and PC3-EMT with uniform initial seeding density. The distribution of cell velocity varies with time. (A) Normalized distribution of cell speed on day 2. (B) The normalized distribution of cell speed on day 6. (C) Ratio of number of PC3-EPI to PC3-EMT in each class interval. (D) Average speed of PC3-EPI and PC3-EMT as a function of time. Please click here to view a larger version of this figure.
Conventional cell culture was developed almost a century ago and remains the most frequently used preclinical model in biomedical research, despite its proven limited ability to predict clinical results in cancer17. Animal models offer the highest physiological relevance and reasonable genetic similarity to humans, but have long been acknowledged to have significant limitations in predicting human outcomes18. Among all the existing preclinical models, microfluidic cancer-on-chip models appear to be the most promising candidate to satisfy the unmet need in cancer research9,19,20. However, current cancer-on-chip models have yet to offer a platform that is able to reproduce key components and interactions to mimic a tumor microenvironment in a comprehensive manner, yet simple enough to provide reliable and reproducible quantitative data. Our representative data demonstrate that our microfluidic cell culture technology provides stable physical and biochemical conditions for long-term cell culture in heterogeneous microenvironments. This multifunctional platform allows the sophisticated adjustment of a time-dependent chemical gradient as well as ambient gas composition. The platform is portable and compatible to most of the fluorescent inverted microscopes for high-resolution real-time imaging, which offers multidimensional information of cells as a function of time, including cell morphology, population dynamics, cell motility and cell migration on a single-cell level.
Compared to our previous work11, we note that this pressure-sealing packaging and assembly method for our microfluidic device enables numerous downstream experiment capacities (e.g., FACS, local metabolite extraction, sub-clonal populations expansion, IF, DNA/RNA FISH, etc.) complementary to the time-lapse images taken in the course of the experiments. This capability of removing cells from specific locations in a heterogenous culture is a major advance compared to earlier devices, where the sealing surface to a chip had to be removed before one could access the culture11. Further, even in that case, the act of removing the cover significantly disturbed the culture so that local testing of cells on a single to few habitat levels was not possible. Such localized extraction was possible in our case due to the soft "resealable" nature of the flexible gas-permeable membrane.
There are several critical steps in the presented protocol. First of all, to initiate a long-term experiment with stable fluidic dynamics, microbubbles need to be avoided as much as possible. Therefore, it is important to prewarm and degas the culture medium (step 3.4.2) before loading the media into the syringes. The manipulation of media loading and dispensing should be done slowly and gently to prevent bubble formation. The PDMS pattern should be treated with oxygen plasma (step 3.4.3) before connecting to the culture media supply system. Oxygen plasma treatment ensures the hydrophilicity of the PDMS surface and significantly reduces the possibility of microbubble entrapping. In step 3.4.7., when placing the chip on top of the cell culture membrane, the PDMS chip should approach the liquid surface with a 15-degree tilt angle to get rid of the bubbles (if any) on the liquid surface inside the culture dish. Secondly, the pressure-sealing method requires a stable gas supply system that pressurizes the cell culture membrane. The pressure should be set between 0.2 to 0.6 psi. Pressure lower than 0.2 psi is insufficient for chip sealing. Above 1.2 psi, a significant amount of gas would permeate through the membrane and generate bubbles within the microfluidic pattern. We note that if the components of the metal 3-well plate are not properly assembled (including the plate body, the gas-permeable culture dish holder, a PDMS chip holder, a glass window holder, O-rings, and a pair of 35 mm glass windows), one would identify gas leakage as the pressure reading would be irresponsive to the increase of the gas flow. The leakage issue can be resolved simply by doing a leakage test and then reassembling the components.
The major form of data acquired with the utilization of the EA technology is through imaging. As mentioned previously, the EA technology can be installed on any inverted microscope. However, to fully exploit the advantages of the system, it is highly recommended to install the system on an inverted fluorescent microscope equipped with fully motorized x-y stage, motorized focus knob, motorized shutter, and motorized filter cube. Also, be aware that Perfect Focus might not guarantee satisfying image quality. We suggest using an imaging software that allows multi-dimensional image acquisition and customized imaging script. Keeping the images well-focused could be challenging without a periodic (every 24 hours or 48 hours) autofocus command, which generated a customized focus surface during the image acquisition cycle.
The presented microfluidic EA technology has been implemented to study the adaptation and evolution dynamics in prostate cancer cell metapopulations under a chemotherapeutic stress landscape12. We have also demonstrated the emergence of drug-resistance polyploid giant cancer cells in this tumor-like heterogeneous micro-ecology, showing that environmental heterogeneity combined with cell migration within tumor population would cause amplification on the emergence of resistant phenotypes13. With the ability to control and monitor the behaviors of mixed tumor cell populations under well-controlled stress gradients, our microfluidic EA technology may also serve as a platform to study regulatory mechanisms and the phenotypic transformation involved in EMT in the context of cancer therapeutic strategies21. Last but not least, the presented pressure-sealing packaging method can also be implemented in other microfluidic systems that require the sophisticated adjustment of ambient gas composition as well as the downstream experiment capacities. For instance, the same packaging method was used to incorporate different microfluidic pattern to study how bacterial population waves propagate through physical barriers22.
In summary, collective population dynamics are qualitatively different from single-cell behaviors. The microfluidic EA technology allows the quantitative study of the evolutionary dynamics and phenotypic behaviors individually and collectively as a function of time. This technology may present a more physiologically relevant in vitro model for cancer research, and potentially for preclinical drug development and screening.
The authors have nothing to disclose.
This work was supported by NSF PHY-1659940.
10 mL BD Luer-Lok tip syringes | BD | 14-823-16E | |
Antibiotic-Antimycotic | Sigma-Aldrich | A5955 | 1x anti-anti |
AZ 300 MIF | Merck KGaA | 18441123163 | Photoresist developer |
AZ1518 | Merck KGaA | AZ1518 | Photoresist |
AZ4330 | Merck KGaA | AZ4330 | Photoresist |
Cr Chromium Etchant | Sigma-Aldrich | 651826 | |
Fetal bovine serum (FBS) | Life Technologies Corporation | 10437028 | |
Heidelberg DWL 66+ laserwriter | Heidelberg Instruments | DWL66+ | Writing photomask |
Hexamethyldisilazane (HMDS) | Sigma-Aldrich | 379212 | For photoresist adhesion enhancement |
Hollow steel pins | New England Small Tube | NE-1300-01 | .025 OD .017 ID x .500 long / type 304 WD fullhard |
ibidi Heating System, Multi-Well Plates, K-Frame | ibidi | 10929 | On-stage incubator |
Luer-Lok 23 G dispensing needle | McMaster-Carr | 75165A684 | To connect syringes and tubings |
Lumox dish 35 | Sarstedt | 94.6077.331 | Gas-permeable cell culture dish |
Microposit Remover 1165 | Dow Electronic Materials | Microposit Remover 1165 | Photoresist stripper |
Microseal B Adhesive Sealer | Bio-Rad Laboratories | MSB1001 | Adhesive sealer |
O-Ring (for Lumox plate sealing) | McMaster-Carr | 9452K114 | Dash No. 27; 1-5/16" ID x 1-7/16" OD; Duro 70 |
O-Ring (for bottom glass window sealing) | McMaster-Carr | 9452K74 | Dash No. 20; 7/8" ID x 1" OD; Duro 70 |
Plasma-Preen Plasma Cleaning/Etching System | Plasmatic Systems, Inc | Plasma-Preen | Oxygen plasma system |
RPMI 1640 | Life Technologies Corporation | 11875-093 | |
Samco RIE800iPB DRIE | Samco | RIE800iPB | Deep reactive-ion etching system |
Suss MA6 mask aligner | SUSS MicroTec | MA6 | Mask aligner |
Sylgard 184 Silicone Elastomer | Fisher Scientific | NC9285739 | PDMS elastomer |
TePla M4L plasma etcher | PVA TePla | M4L | Plasma etcher |
Trichloro-1H,1H,2H,2H-perfluorooctyl-silane (PFOTS) | Sigma-Aldrich | 448931 | For silicon wafer silanization |
Tygon microbore tube (0.020" x 0.060"OD) | Cole-Parmer | EW-06419-01 | Tubings for media delivery |