Evaluation of Left Ventricular Structure and Function using 3D Echocardiography
Summary
In this article, we provide a step-by-step acquisition and analysis protocol for the volumetric assessment and speckle-tracking analysis of the left ventricle by 3D echocardiography, particularly focusing on practical aspects that maximize the feasibility of this technique.
Abstract
Three-dimensional (3D) quantification of the left ventricle (LV) provides significant added value in terms of diagnostic accuracy and precise risk stratification in various cardiac disorders. Recently, 3D echocardiography became available in routine cardiology practice; however, high-quality image acquisition and subsequent analysis have a steep learning curve. The present article aims to guide the reader through a detailed 3D protocol by presenting tips and tricks and also by highlighting the potential pitfalls to facilitate the widespread but technically sound use of this important technique concerning the LV. First and foremost, we show the acquisition of a high-quality 3D dataset with optimal spatial and temporal resolution. Then, we present the analytical steps toward a detailed quantification of the LV by using one of the most widely applied built-in software. We will quantify LV volumes, sphericity, mass and also systolic function by measuring ejection fraction and myocardial deformation (longitudinal and circumferential strain). We will discuss and provide clinical examples about the essential scenarios where the transition from a conventional echocardiographic approach to a 3D-based quantification is highly recommended.
Introduction
The assessment of left ventricular (LV) morphology and function is the predominant purpose of general and even more specific investigations in cardiology1. The widely available and noninvasive transthoracic echocardiography (TTE), which can provide dense amounts of information, is the method of choice for a convenient, fast, and cost-effective evaluation.
Measurement of LV mass, volumes, and subsequent ejection fraction holds significant diagnostic and also prognostic value2. The more accurate a given measure is, the higher its value will be. A better correlation with gold standard cardiac magnetic resonance (CMR) imaging derived values is an ongoing chase for echocardiographic techniques. Generally, clinical practice guidelines recommend the biplane Simpson's method for LV volume and ejection fraction measurement3. However, the LV is a three-dimensional (3D) structure with an often irregular shape, and therefore, several tomographic planes will undoubtedly fail in some clinical scenarios to accurately delineate LV morphology and function. Recent advancements in ultrasonic hardware and software technology permitted the development of real-time 3D imaging, which revolutionalizes echocardiographic protocols.
Moreover, the need for a quantitative approach concerning wall motion abnormalities resulted in the rise of deformation imaging4. Strain and strain rate parameters can be calculated by speckle tracking using standard grey-scale images. 3D echocardiography may also overcome several shortcomings of a two-dimensional strain assessment5. From an expensive scientific tool, 3D echocardiography started to become a powerful technique used in everyday clinical practice, and the quantification of the LV is certainly in the first line in this breakthrough.
The present article aims to guide the reader through a detailed 3D protocol by presenting tips and tricks and also by highlighting the potential pitfalls to facilitate the widespread but technically sound use of this important technique concerning the LV.
Protocol
This protocol follows the guidelines of the Semmelweis University Regional and Institutional Committee of Science and Research Ethics. The present protocol applies to a specific vendor. Although some steps remain valid regardless of the ultrasound machine and postprocessing software, important differences may exist if using other vendors' solutions.
1. Technical requirements
- Utilize an echocardiography machine capable of 3D imaging.
- Connect a 3D transthoracic echocardiography capable phased array transducer.
- Apply the built-in 3-lead ECG of the ultrasound system to allow the system to synchronize the recordings and analyses to the cardiac cycle.
2. Acquisition of the 3D echocardiographic images
- Position the patient in the left lateral decubitus position (patient lying on the left side with the left arm stretched above the head).
- Ensure that the ECG tracing on the screen is of good quality.
NOTE: This is a prerequisite for postprocessing as the software will detect the different points of the cardiac cycle based on the ECG signal. - Unfreeze the image, and start to examine the patient with the transducer. Visualize a conventional apical four-chamber view.
- Optimize the image quality by adjusting sector width to LV, lowering the depth to truncate the left atrium, and by using a slight overgain.
NOTE: Ensure the entire LV endo- and also the epicardial surface is visible. - Press the 4D button to switch to 3D mode.
NOTE: By pressing the Multi-Slice… button on the touch screen, four options will be available (5, 7, 8, 12 slices) to overview the 3D dataset using standard short- and long axis cuts. If needed, transducer positioning can be corrected to ensure the inclusion of the entire LV wall thickness from apical to mitral valve level into the pyramidal 3D dataset. The use of 12 slices (with nine adjustable short-axis views) is recommended. - Acquire 3D images using Multi Beat or Single Beat mode.
- Use the Multi Beat mode to achieve higher spatial and temporal resolution, where the dataset will be reconstructed from 2, 3, 4 or 6 cardiac cycles (this can be set-up on the screen) – end-expiratory breath-hold of the patient and stable transducer positioning needed to minimize stitching artifacts.
NOTE: Single Beat acquisition is of lower spatial and temporal resolution; however, most modern transducers have better quality and, therefore, can be used to acquire proper 3D datasets without reconstruction to undergo further analysis. As a general recommendation, volume rates over 15 volumes per second are recommended for further analysis. - When the full-volume is reconstructed from the subvolumes, and the entire LV is visible, freeze the image. Using the Cycle Select and Number of Cycles knobs, select the optimal acquired cardiac cycle(s) and press Image Store.
NOTE: Stitching artifacts are spatially or temporarily misaligned subvolumes next to each other. Datasets with a significant dropout of LV walls or with stitching artifacts are generally not suitable for further analysis. The quality of the already acquired 3D dataset can be double-checked using the Multi-Slice mode.
- Use the Multi Beat mode to achieve higher spatial and temporal resolution, where the dataset will be reconstructed from 2, 3, 4 or 6 cardiac cycles (this can be set-up on the screen) – end-expiratory breath-hold of the patient and stable transducer positioning needed to minimize stitching artifacts.
3. Postprocessing to quantify LV morphology and function
- Select a 3D dataset appropriate for further analysis.
NOTE: This part of the protocol requires the previously acquired and saved good-quality 3D images and can be performed on the ultrasound machine and a separate workstation, either. - Click on Measure | Volume, and then select 4D Auto LVQ.
- On the quad-screen (three apical views: four-, two-, and three-chamber views, and one short-axis view, the latter can be adjusted by a horizontal plane on long-axis views), the software asks Modify alignment of apical slices to standard views. If required, correct the apical views manually by tilting and rotation to show the corresponding standard view, thereby eliminating foreshortening. Set tilting to align the caliper with the long axis of the LV by dragging and moving the calipers on long-axis views. Set rotation by the corresponding or the Rotate All knobs on the machine or by adjusting the calipers on the short-axis image.
NOTE: Software recommendation can be reset by pushing the Auto Align button. - After finishing view alignment, click to the next step EDV. The end-diastolic (ED) frame is automatically detected using the ECG signal, but can be manually corrected if necessary.
- Semi-automatic detection of LV endo- and epicardial surface
- Select two landmark points manually on any apical views. Firstly, identify the LV apex and then the middle of the LV base (mitral annulus level) in any apical view. The algorithm will automatically contour the endocardial border of the entire LV.
NOTE: There are two more options: Manual, which means that two basal and one apical landmark should be set in every apical view, and Auto Init, which will automatically contour the LV without any user interaction. - Check contour credibility in three apical views, three short-axis views of different levels, and a fourth user-controlled short axis, to allow visual verification of the detected surface. Contour correction is possible by manually adding points that will then be incorporated in the contour line.
NOTE: With Undo, the previously added point can be deleted. Reset button resets the contouring to start the entire section from the beginning. Contour visibility can be adjusted to allow the appreciation of the endocardial surface on the grey-scale image. Endocardial and epicardial contouring should be performed in an accurate and consistent manner. For a detailed recommendation, please check the following reference6. - Choose the next step, which is the ESV.
- Repeat the same procedure (3.5.1-3.5.2) as mentioned in the previous points to identify and correct the endocardial contour on the end-systolic frame.
NOTE: The end-systolic (ES) frame is automatically detected using the ECG signal, but can be manually corrected if necessary. Values of end-diastolic volume (EDV), end-systolic volume (ESV), ejection fraction (EF), heart rate (HR), stroke volume (SV), cardiac output (CO) and sphericity index (SpI) are already displayed on the screen. - Press Volume waveform for the next step. The software displays a dynamic 3D model of the LV and also time-volume curve as it traces the endocardial surface throughout the cardiac cycle frame-by-frame (Figure 1).
NOTE: Here, there is a possibility to edit the endocardial border at any frame. - For the next step, press LV Mass. The software automatically contours LV epicardial contour on the end-diastolic frame and calculates LV mass (EDMass).
NOTE: If necessary, edit the contour of the epicardial surface by adding points to include (same method as previously described) in any short- or long-axis plane. It can be selected which contour to adjust: Endo, Epi, or Endo+Epi. - Press 4D Strain ROI for the next step. The software automatically contours LV epicardial contour on the end-systolic frame and calculates LV end-systolic mass (ESMass).
NOTE: If necessary, edit the end-systolic contour of the epicardial surface by adding points to include (same method as previously described) in any short- or long-axis plane. ESMass should be of similar value than EDMass. This step is essential to calculate 3D strain values by speckle tracking. - Press 4D Strain Results for the next step. The software visualizes the 3D myocardial tracking on multiple short- and long-axis planes and corresponding strain values of the 17 standard LV segments throughout the cardiac cycle, frame-by-frame. Time-strain curves and bull's eye plot are also displayed. The following parameters are calculated and can be demonstrated: longitudinal strain, circumferential strain, radial strain, area strain, rotation, and torsion.
NOTE: There is a possibility to exclude a particular LV segment from analysis if it is considered as having a low tracking quality by visual observation of images or based on the time-strain curve. However, the software recommends by default on segment approval or rejection. Color-coded strain values can be visualized on a dynamic 3D model of the LV by changing the "Layout".
- Select two landmark points manually on any apical views. Firstly, identify the LV apex and then the middle of the LV base (mitral annulus level) in any apical view. The algorithm will automatically contour the endocardial border of the entire LV.
- To terminate the analysis, press Approve & Exit.
Representative Results
3D analysis of the LV is feasible in the majority of patients. Case 1 is a healthy volunteer with normal ventricular volumes and function (Figure 1). Case 2 (Figure 2) is a 64-year old male patient with dilated cardiomyopathy and a wide QRS complex (160 ms) of left bundle branch block morphology. Gold standard CMR measurements were the following: end-diastolic volume: 243 mL, end-systolic volume: 160 mL, ejection fraction: 34%, LV mass: 163 g. Conventional linear echocardiographic measurements significantly underestimated LV volumes (end-diastolic: 139 mL, end-systolic: 76 mL) and overestimated ejection fraction (45%) and LV mass (469 g). However, 3D echocardiographic measurements are much closer to the gold standard, as shown in the Figure 2. Moreover, the analysis of myocardial mechanics by 3D speckle tracking provides meaningful data on dyssynchronous contractions and segmental dysfunction. The patient later underwent successful cardiac resynchronization therapy.
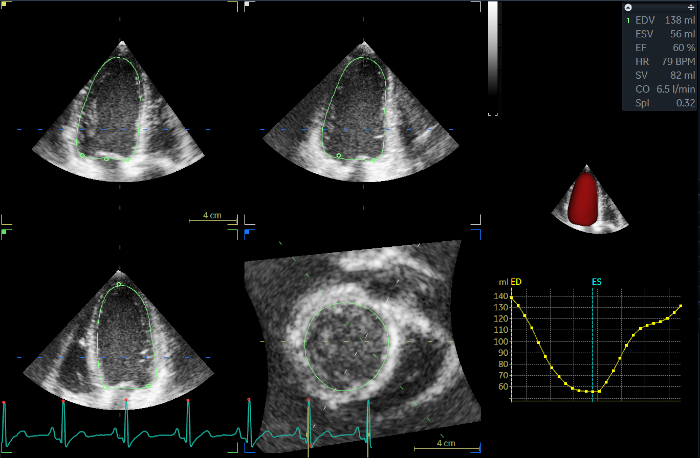
Figure 1: 3D LV analysis of an 18-year old female volunteer free from any cardiovascular diseases. The current image refers to the Volume waveform (step 3.5.5). On the left side of the screen, three different LV long-axis and one short-axis view can be seen; the green contour represents the end-diastolic endocardial surface. In the top right corner, the main results are visible, demonstrating normal LV volumes, shape, and function. Below that, 3D LV endocardial surface model (red) and time-volume curve throughout the cardiac cycle are visible. ED: end-diastolic, ES: end-systolic, EDMass: LV mass, EDV: end-diastolic volume, ESV: end-systolic volume, EF: ejection fraction, HR: heart rate, BPM: beats per minute, SV: stroke volume, CO: cardiac output, SpI: sphericity index. Please click here to view a larger version of this figure.
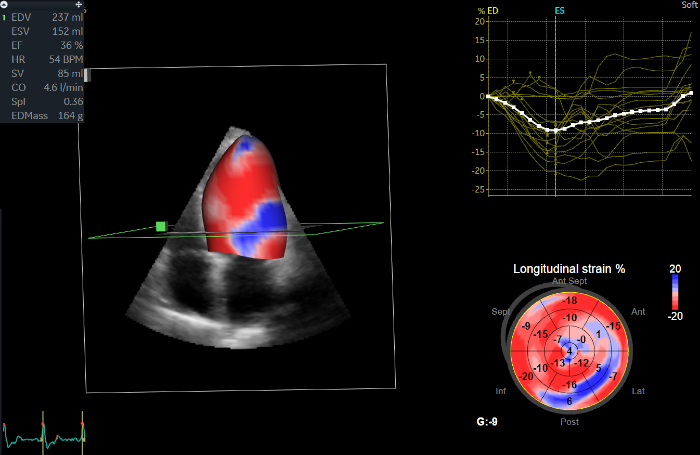
Figure 2: 3D LV analysis of a dilated cardiomyopathy patient. The current image refers to the 4D Strain Results (step 3.5.8). On the left side of the screen, color-coded longitudinal strain values are visualized on a 3D model of the LV, showing reduced strain on the lateral wall (blue). Quantitatively, end-systolic strain values are shown in the bottom right corner on the bull's eye plot of the 17 standard LV segments. In the top right corner, global and also segmental longitudinal strain values are visible on time-strain curves throughout the cardiac cycle. ED: end-diastolic, ES: end-systolic, EDV: end-diastolic volume, ESV: end-systolic volume, EF: ejection fraction, G: global, HR: heart rate, BPM: beats per minute, SV: stroke volume, CO: cardiac output, SpI: sphericity index. Please click here to view a larger version of this figure.
Discussion
LV morphological and functional measurements represent cornerstones of diagnosis, management, and follow-up of cardiac diseases; moreover, they are powerful predictors of outcome. Generally, 2D echocardiography-based evaluation of the LV is recommended by current practice guidelines; however, 3D echocardiography has been proven to be more accurate as it is free from geometrical assumptions concerning LV shape7,8. Deformation imaging by speckle tracking is a robust method to assess different directions of myocardial strain, which enables the quantification of wall motion abnormalities more sensitively5. Longitudinal strain has an established superior prognostic value compared to ejection fraction9.
Generally, the LV is acquired from a transthoracic apical window using full-volume 3D datasets reconstructed from 4 to 6 cardiac cycles during end-expiratory breath-hold, and then, sub-volumes are automatically stitched together to achieve optimal spatial and temporal resolution. The prerequisite for a proper 3D dataset is an optimized 2D image by the adjustment of transducer frequencies, depth, and by the use of a slight overgain. The goal is to include the entire LV endo- and also epicardial surface into a good quality pyramidal dataset, which could be ensured by checking several short- and long-axis views before acquisition: the user interface of the machine provides this multiplane view. One can use different transducer positioning to optimize visualization compared to the conventional view used for 2D measurements as foreshortening can be corrected during post-processing. Additional respiratory maneuvers can also be applied.
Conventional 2D methods to measure LV morphology and function have inherent limitations. They heavily rely on proper transducer positioning and manual contouring of the LV endocardial surface. Moreover, the currently recommended biplane Simpson's method takes into account only two tomographic planes and neglects the remaining, large surface of the bullet-shaped LV structure. To quantify LV volumes, geometrical assumptions about LV shape are used3. Non-3D methods significantly underestimate LV volumes10. These shortcomings are even more exaggerated in patients with irregular LV shapes and uncommon patterns of wall motion abnormalities11. LV mass is also a powerful predictor of outcome despite current M-mode, or 2D techniques bear numerous limitations. The widely applied Devereux formula using linear measurements underestimates around the normal range of LV mass; however, it significantly overestimates when significant hypertrophy is present12,13. 3D echocardiography-based measurements are more reproducible and have a better correlation with gold standard CMR. Sphericity index is a traditional but well-performing measure of LV shape, and its measurement is more representative using 3D echocardiography. Strain and strain rate measurements are becoming an essential part of research and clinical practice due to their superior sensitivity and added prognostic value14,15. Longitudinal and circumferential shortening and even rotational mechanics can be quantified by 3D speckle tracking, while data is accumulating proving their value16. 3D analysis eliminates out-of-plane motion (known limitation of 2D approach); however, lower temporal and spatial resolution of 3D datasets along with differences in software algorithms should be taken into consideration.
While the speed and robustness of 3D LV quantification attract clinicians to use it in every single patient, several limitations should be kept in mind. Despite all the improvements in image quality, there will remain a certain subset of patients whose echocardiographic window will be inadequate for a semiautomatic or even manual measurements. Clinical experience may drive the clinician to look over the measured values and to start to think about alternative techniques, such as contrast echocardiography or CMR. While "eyeballing" is discouraged, we may seek a correlation between expert anticipation and measured values. Software algorithms apply learned models of LV shape during automatic endo- and epicardial contouring; therefore, we will see a contour even in those regions which are actually out of the imaging volume. We have to try to involve the entire LV endo- and epicardial surface into the acquired volume to minimize such interpolation. When, despite all efforts, this dropout persists, the results should be interpreted with caution. Stitching artifacts are quite frequent during multi-beat reconstruction, caused by irregular rhythm, unwanted transducer or patient motion (fail to hold breath) during acquisition, or even technical issues. While 3D reconstructions are generally feasible despite these artifacts, the results should be questioned, and new analysis should be initiated using another loop free of stitching. Most modern transducers allow adequate spatial and temporal resolution (>20 volumes per second) without multi-beat acquisition, which, of course, eliminates this issue. For appropriate image acquisition and software postprocessing, the role of a stable, good-quality ECG tracing can not be overemphasized. Placing the landmarks during postprocessing is of pivotal importance, effecting significantly final values and overall tracking quality. Currently, some manual correction of automatic contouring is necessary for nearly every patient; however, we have to keep in mind that the more we interact, the more human-error may be introduced that will worsen reproducibility. A proper trade-off should be set to handle software-related contouring errors. This issue will be fine-tuned during the learning curve and will improve as the experience grows. Importantly, there are significant vendor differences in the measurement of 3D strain values, and currently there is no standardization which has already taken place in case of global longitudinal strain by 2D speckle tracking17. Tracking quality and credibility of results are higher concerning 2D speckle tracking, 3D strain measurements are preferably placed in the arena of research in the time of the writing of this article.
In conclusion, 3D echocardiography-based software solutions are providing the most accurate echocardiographic results concerning LV morphology and function. They are validated with CMR and proved to be more reproducible and even less time consuming as conventional 2D techniques. Their application in research and also in clinical life will continue to evolve. Further improvements using artificial intelligence can pave the way toward automatic quantification without human interaction.
Disclosures
The authors have nothing to disclose.
Acknowledgements
Project no. NVKP_16-1–2016-0017 (’National Heart Program’) has been implemented with the support provided from the National Research, Development and Innovation Fund of Hungary, financed under the NVKP_16 funding scheme. The research was financed by the Thematic Excellence Programme (2020-4.1.1.-TKP2020) of the Ministry for Innovation and Technology in Hungary, within the framework of the Therapeutic Development and Bioimaging thematic programmes of the Semmelweis University.
Materials
| 3V-D/4V-D/4Vc-D | General Electric | n.a. | ultrasound probe |
| 4D Auto LVQ | General Electric | n.a. | software for analysis |
| E9/E95 | General Electric | n.a. | ultrasound machine |
| EchoPac v203 | General Electric | n.a. | software for analysis |
References
- Guta, A. C., et al. Three-dimensional echocardiography to assess left ventricular geometry and function. Expert Review of Cardiovascular Therapy. 17 (11), 801-815 (2019).
- Surkova, E., et al. Current Clinical Applications of Three-Dimensional Echocardiography: When the Technique Makes the Difference. Current Cardiology Reports. 18 (11), 109 (2016).
- Lang, R. M., et al. Recommendations for cardiac chamber quantification by echocardiography in adults: an update from the American Society of Echocardiography and the European Association of Cardiovascular Imaging. Journal of the American Society of Echocardiography. 28 (1), 1-39 (2015).
- Matyas, C., et al. Comparison of speckle-tracking echocardiography with invasive hemodynamics for the detection of characteristic cardiac dysfunction in type-1 and type-2 diabetic rat models. Cardiovascular Diabetology. 17 (1), 13 (2018).
- Kovacs, A., et al. Impact of hemodialysis, left ventricular mass and FGF-23 on myocardial mechanics in end-stage renal disease: a three-dimensional speckle tracking study. International Journal of Cardiovascular Imaging. 30 (7), 1331-1337 (2014).
- Muraru, D., et al. Comprehensive analysis of left ventricular geometry and function by three-dimensional echocardiography in healthy adults. Journal of the American Society of Echocardiography. 26 (6), 618-628 (2013).
- Lakatos, B. K., et al. Relationship between Cardiac Remodeling and Exercise Capacity in Elite Athletes: Incremental Value of Left Atrial Morphology and Function Assessed by Three-Dimensional Echocardiography. Journal of the American Society of Echocardiography. 33 (1), 101-109 (2020).
- Muraru, D., et al. Intervendor Consistency and Accuracy of Left Ventricular Volume Measurements Using Three-Dimensional Echocardiography. Journal of the American Society of Echocardiography. 31 (2), 158-168 (2018).
- Kalam, K., Otahal, P., Marwick, T. H. Prognostic implications of global LV dysfunction: a systematic review and meta-analysis of global longitudinal strain and ejection fraction. Heart. 100 (21), 1673-1680 (2014).
- Muraru, D., et al. Validation of a novel automated border-detection algorithm for rapid and accurate quantitation of left ventricular volumes based on three-dimensional echocardiography. European Journal of Echocardiography. 11 (4), 359-368 (2010).
- Doronina, A., et al. The Female Athlete’s Heart: Comparison of Cardiac Changes Induced by Different Types of Exercise Training Using 3D Echocardiography. BioMed Research International. 2018, 3561962 (2018).
- Takeuchi, M., et al. Measurement of left ventricular mass by real-time three-dimensional echocardiography: validation against magnetic resonance and comparison with two-dimensional and m-mode measurements. Journal of the American Society of Echocardiography. 21 (9), 1001-1005 (2008).
- Armstrong, A. C., et al. LV mass assessed by echocardiography and CMR, cardiovascular outcomes, and medical practice. JACC Cardiovasc Imaging. 5 (8), 837-848 (2012).
- Olah, A., et al. Characterization of the dynamic changes in left ventricular morphology and function induced by exercise training and detraining. International Journal of Cardiology. 277, 178-185 (2019).
- Nagy, V. K., et al. Role of Right Ventricular Global Longitudinal Strain in Predicting Early and Long-Term Mortality in Cardiac Resynchronization Therapy Patients. PLoS One. 10 (12), e0143907 (2015).
- Kovacs, A., Lakatos, B., Tokodi, M., Merkely, B. Right ventricular mechanical pattern in health and disease: beyond longitudinal shortening. Heart Failure Reviews. 24 (4), 511-520 (2019).
- Badano, L. P., et al. Use of three-dimensional speckle tracking to assess left ventricular myocardial mechanics: inter-vendor consistency and reproducibility of strain measurements. European Heart Journal – Cardiovascular Imaging. 14 (3), 285-293 (2013).
