Morphological and Functional Assessment of the Right Ventricle Using 3D Echocardiography
Summary
Here, we provide a step-by-step acquisition and analysis protocol for the 3D volumetric assessment of the right ventricle, mainly focusing on the practical aspects that maximize the feasibility of this technique.
Abstract
Traditionally, it was believed that the right side of the heart has a minor role in circulation; however, more and more data suggest that right ventricular (RV) function has strong diagnostic and prognostic power in various cardiovascular disorders. Due to its complex morphology and function, assessment of the RV by conventional two-dimensional echocardiography is limited: the everyday clinical practice usually relies on simple linear dimensions and functional measures. Three-dimensional (3D) echocardiography overcame these limitations by providing volumetric quantification of the RV free of geometrical assumptions. Here, we offer a step-by-step guide to obtain and analyze 3D echocardiographic data of the RV using the leading commercially available software. We will quantify 3D RV volumes and ejection fraction. Several technical aspects may help to improve the quality of RV acquisition and analysis as well, which we present in a practical manner. We review the current opportunities and the limiting factors of this method and also highlight the potential applications of 3D RV assessment in current clinical practice.
Introduction
Echocardiography came a long way from its first clinical applications in the 1950s1. The first one-dimensional ultrasound probes were designed to provide simple linear diameters of the chamber walls and lumens; however, they undoubtedly represent a milestone in cardiovascular imaging. The development of two-dimensional (2D) ultrasound imaging was another major step by providing much more precise quantification of morphology and function and is still considered to be the standard method in everyday clinical practice. Nevertheless, 2D echocardiography-based assessment still carries a major limitation of the technique: imaging of a given chamber from a few tomographic planes does not adequately characterize the morphology and function of a three-dimensional (3D) structure. This problem is even more pronounced in the case of the right ventricle (RV): compared to the relatively simple bullet-shaped left ventricle (LV), the RV has a complex geometry2 that cannot be adequately quantified using linear diameters or areas3. Despite these widely known facts, RV morphology and function are usually measured by such simple parameters in the clinical practice.
For many decades, the RV was considered to have a much less important role in circulation compared to its left counterpart. Several landmark papers defeated this standpoint showing the strong prognostic role of RV geometry and function in a wide variety of diseases4,5,6,7. Numerous studies demonstrated the incremental value of RV measurement even by using relatively simple conventional parameters, which highlights the importance and need for more precise quantification of the chamber with potentially meaningful clinical value.
3D echocardiography overcomes several limitations of the 2D assessment of the cardiac chambers. While the measurement of volumes and also functional parameters free of geometrical assumptions may be of high interest in the case of the LV as well, it may gain particular importance in the assessment of the RV8. 3D-derived RV volumes and ejection fraction (EF) are shown to have significant prognostic value in various cardiovascular conditions9,10.
Nowadays, several vendors provide semi-automated solutions for 3D RV assessment with validated results against gold standard cardiac magnetic resonance (MR) measurements11,12. The technical requirements of 3D assessment are essential parts of a state-of-the-art cardiovascular imaging department nowadays, and it is expected that it will soon be part of the general equipment in every echocardiography lab. With proper expertise in 3D acquisition and post-processing, 3D RV analysis can be easily implemented into the standard examination protocol.
Protocol
The protocol follows the guidelines of the institution's human research ethics committee and the patients of the clinical cases gave their written informed consent to the study.
1. Technical requirements
- For 3D acquisition and analysis, use appropriate software and hardware. Use ECG cables of the echocardiography device; moreover, it is mandatory for the complete 3D acquisition protocol described below.
- For 3D acquisition, use a 3D echocardiographic probe and 3D-compatible ultrasound machine. For 3D RV volumetric analysis, use dedicated software.
2. Acquisition
- In the vast majority of cases, perform 3D acquisition of the RV using apical views. In opposed to the LV-focused views, a different patient positioning is recommended. If substantially better image quality can be achieved by switching to one intercostal space over the correct apical view, this foreshortened view may enable better 3D image quality. The foreshortening can be corrected during 3D analysis.
- Compared to the standard apical echocardiographic acquisition, where the left lateral decubitus position (patient lying on the left side with the left arm stretched above the head) is recommended, have the patient lean back slightly more to enable a more lateral position of the transducer.
- Choose an image depth that only includes the RV. Unnecessarily large depth may lower the acquisition frame rate with the lack of beneficial effects regarding RV volumetric analysis.
- Confirm the correct RV-focused view from 2D echocardiography images. If the free wall of the RV is poorly visualized even from this view, the expected 3D image quality will not be optimal for further analysis.
- Switch to the live 3D imaging using the 4D button, where further correction of the RV view can be performed.
- While the 3D live mode may be quite pleasing aesthetically, use the 12 Slice mode for the 3D view, which shows a triplane image of the region of interest as well as 9 cross-sectional planes that can be freely modified. By rotation and correct positioning of the cut planes, confirm the visibility of the entire RV free wall (including the outflow tract and apical segments).
- Further adjust the image by using the left tilting of the sector (second page on the touch screen) to improve RV visualization.
- Use two 3D acquisition modes for RV volumetric analysis: the multi beat and the single beat mode. Use both of these approaches in every patient however, in some cases (e.g., certain arrhythmias, severe dyspnea of the patient), only the latter one may be feasible.
- Using single beat mode, achieve a tradeoff between image quality and frame rate. Choose an optimal image depth, width, and frame rate (lower panel of the touch screen) and obtain 3D loops of the RV without any further action. This method is feasible in the majority of patients; however, it yields generally lower image quality and frame rate compared to the multi beat approach.
- In case of an average (60-70/min) heart rate, keep a lower frame rate limit of 16 frames/s for adequate RV analysis; however, if tachycardia is present even higher frame rates are recommended.
- Using the multi beat mode, reconstruct the acquired 3D loop from a given number of heart cycles that can be selected on the touch screen (2,3,4 and 6 beat modes can be used). In contrast with the single beat acquisition, generally better image quality and frame rate are expected; however, it requires relatively constant heart cycle lengths and also patient compliance due to the mandatory breath-hold maneuver. The maneuver is essential to avoid the so-called stitching artefacts: when the acquired 3D volume is stitched together, unequal cardiac cycle lengths and/or motion due to breathing may result in this phenomenon.
- After correct positioning of the probe and setting of the machine (similarly to "single beat" mode), ask the patient to take a deep breath and hold it. In this case, the expanding lungs usually cover the entire image.
- Ask the patient to exhale slowly, strictly with guidance. In parallel with the deflation of the lungs, the RV becomes visible again.
- When the entire RV (free wall and septum) reappears, ask the patient to hold breath in this state.
- By clicking to multi beat on the screen, begin the acquisition, and the 3D loop builds up during the given amount of heart cycles.
- When the acquisition is ready (the entire RV is visualized), ask the patient to breathe freely again.
- Check the obtained loop to ensure if there are no stitching or drop-out artifacts.
3. 4D RV analysis
- Using dedicated software, perform 3D volumetric analysis of the RV. After choosing the RV-focused 3D loop from the patient library, open the software from the Measurement window found in the Volume folder.
- After opening the software, orient the RV on four predefined cut planes.
- Put two markers (TV Center) to the center of the tricuspid valve in the upper and lower left long-axis planes. Adjust the long-axis of the image to the actual long axis of the RV by using the rotation tool. Reference images on the upper right edges show how the correct orientation should appear.
- On the upper and lower right panels, align the short-axis images into the correct position by rotation. Similarly to the previous step, reference images help in this process as well.
- After finishing, click Set landmarks to the next step of the analysis. Set landmarks in two images.
- On the left side, mark the tricuspid annulus at the free wall (TV free wall) and septum (TV septum) and the RV apex on the previously oriented apical four-chamber view.
- On the right side, set the RV posterior (LV/RV posterior) and anterior insertion points (LV/RV anterior) and the RV free wall (RV free wall). Similarly to the previous window, reference images in the upper right corner help regarding the correct setup. After setting all landmarks, the software automatically jumps to the next window (Review).
- In this window (Review), review and manually correct the automatic endocardial border detection throughout the entire cardiac cycle, if necessary. By default, 9 panels can be seen: on the left side, 3 moving loops (1 long-axis and 2 short-axis), on the middle the end-diastolic frames of the same images, and on the right side the end-systolic ones.
- In the case of false tracking, freely correct the endocardial borders (green lines), the tracked border by clicking on them. Using the rotation tool on the short axis, review images tracking along the entire circumference of the RV. Adjust the magnitude of correction by choosing Pen size on the right side panel. If the tracking is considered to be correct, click on the Results in the same panel.
- In the last section, review the final 3D volumetric data and other calculated parameters on the upper right side (Worksheet panel). Beyond RV volumes and ejection fraction, the software also displays 2D parameters, such as linear (mid, basal, and long-axis) diameters, as well as FAC and TAPSE values derived from the predefined apical four-chamber view. The software also shows a long- and short axis of the RV (left side), a 3D live model of the RV (upper middle), and a volume-time curve of the chamber (lower right).
- In case of the need for further adjustments in the tracking, every previous steps are available for correction by clicking on them on the right panel. If the tracking and the 3D parameters are considered to be valid, save the results by clicking on "Approve and exit" on the same panel.
Representative Results
3D analysis of the RV is feasible in a wide variety of cardiovascular diseases. Case 1 is a healthy volunteer with normal ventricular volumes and function (Figure 1). Case 2 is a post-mitral valve repair patient who is a typical example for the conflicting results of conventional 2D assessment: while TAPSE is markedly reduced, the patient does not show any signs of RV dysfunction and a maintained RV global systolic function was confirmed by normal 3D RV EF (Figure 2). Both patients had excellent echocardiography window with consequential great tracking quality. Case 3 is a semi-professional athlete with dilated cardiomyopathy (Figure 3). Only moderate image quality was achievable (the outflow tract is poorly visualized); however, 3D RV analysis was successful, showing good agreement with cardiac MR results.
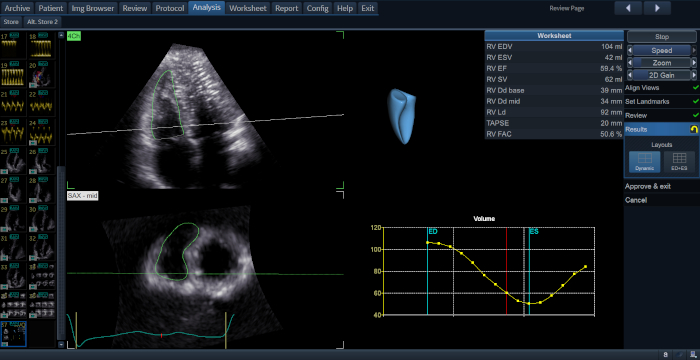
Figure 1: 3D RV analysis of a healthy volunteer. On the left panels, a long axis (upper panel) and a short axis (lower panel) image of the RV can be seen. The green line represents the endocardial border. The central upper image is a 3D model of the RV based on the current analysis. Beyond RV volumes and ejection fraction, the software displays 2D parameters, such as linear (mid, basal and long-axis) diameters, as well as FAC and TAPSE values derived from the predefined apical four-chamber view (right upper panel) and a volume-time curve is also generated (right lower panel). Please click here to view a larger version of this figure.
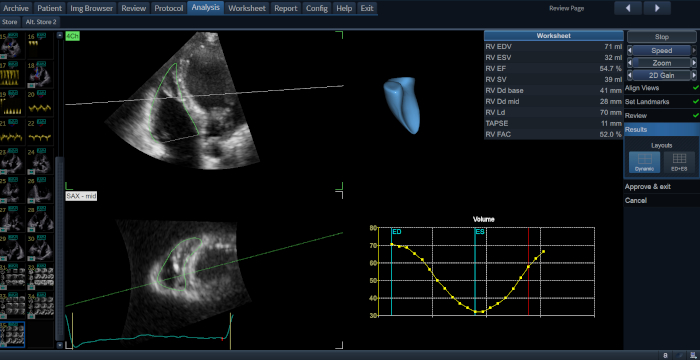
Figure 2: 3D RV analysis of a post-mitral valve repair patient. While 3D RV volumes and EF are in the normal range, TAPSE is markedly lower. Reduced longitudinal shortening of the RV is a common phenomenon following cardiac surgery however, the majority of these patients do not show signs of RV failure. 3D EF assessment confirms maintained global systolic function despite markedly reduced TAPSE values. Please click here to view a larger version of this figure.
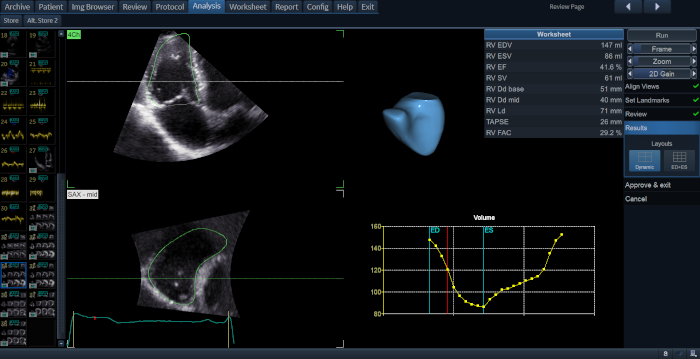
Figure 3: Case of an athlete with dilated cardiomyopathy. 3D RV volumes are increased, while 3D RV EF is mildly reduced. Note the suboptimal image quality with a poorly visualized RV outflow tract. Despite the poor echocardiographic window, RV analysis shows good agreement with cardiac MR-derived measurements considering the known systematic volume underestimation of 3D echocardiographic RV analysis compared to the gold-standard cardiac MR (RVEDV: 168 mL; RVESV: 99 mL; RVEF: 41%). Please click here to view a larger version of this figure.
Discussion
3D analysis of the RV represents an important step in everyday cardiology practice. In parallel with the growing interest of the morphology and function of the previously neglected cardiac chamber, these novel solutions provide clinically meaningful information about the right side of the heart. While 3D acquisition has several aspects that markedly differ from 2D echocardiographic imaging, by keeping special attention to the critical points and by using a thorough protocol, 3D RV analysis may progress from a scientific tool to an essential step of echocardiographic examination. With optimal image quality and proper expertise, RV volumetric analysis using echocardiography may take only a few minutes from acquisition to results with high feasibility13. The significantly lower costs and shorter procedure time make it an appealing alternative to the gold standard cardiac MR examination in several cases.
Nevertheless, 3D analysis may not be feasible in every scenario. The most important limitation factor is echocardiographic image quality: in patients with a poor 2D echocardiographic window, acceptable 3D image quality is rarely achievable. Still, it is important to mention that various maneuvers (lateral positioning of the probe, foreshortening, proper presets) may improve 3D image quality. Suboptimal visualization of the RV outflow tract is not uncommon, however it is usually well tolerated by the RV analysis solutions providing reliable results. Using 3D loops with stitching, drop-out artifacts are strongly discouraged, therefore, recording of multiple loops and post-acquisition control are highly recommended.
3D examination of the RV opens the possibility of 3D RV deformation analysis and regional assessment of the chamber as well14. It is well known that maintained EF does not preclude significant changes in RV mechanics4. Evaluation of RV deformation reveals distinct changes of RV contraction pattern in a wide variety of populations, such as post-cardiac surgery patients15,16,17, congenital heart disease18, pulmonary arterial hypertension19,20,21, and elite athletes22. Moreover, measurement of segmental morphology and function may be of high interest in diseases where regional remodeling of the RV is expected, such as arrhythmogenic cardiomyopathy23 or congenital heart disease patients24. In conclusion, post-processing of 3D RV data may provide novel parameters of the chamber with incremental diagnostic and prognostic value.
Acknowledgements
Project no. NVKP_16-1–2016-0017 (’National Heart Program’) has been implemented with the support provided from the National Research, Development and Innovation Fund of Hungary, financed under the NVKP_16 funding scheme. The research was financed by the Thematic Excellence Programme (2020-4.1.1.-TKP2020) of the Ministry for Innovation and Technology in Hungary, within the framework of the Therapeutic Development and Bioimaging thematic programmes of the Semmelweis University.
Materials
| 3V-D/4V-D/4Vc-D | General Electric | n.a. | ultrasound probe |
| 4D Auto RVQ | General Electric | n.a. | software for analysis |
| E9/E95 | General Electric | n.a. | ultrasound machine |
| EchoPac v203 | General Electric | n.a. | software for analysis |
References
- Edler, I., Lindstrom, K. The history of echocardiography. Ultrasound in Medicine and Biology. 30 (12), 1565-1644 (2004).
- Ho, S. Y., Nihoyannopoulos, P. Anatomy, echocardiography, and normal right ventricular dimensions. Heart. 92 (Suppl 1), i2-i13 (2006).
- Genovese, D., et al. Comparison Between Four-Chamber and Right Ventricular-Focused Views for the Quantitative Evaluation of Right Ventricular Size and Function. Journal of the American Society of Echocardiography. 32 (4), 484-494 (2019).
- Kovacs, A., Lakatos, B., Tokodi, M., Merkely, B. Right ventricular mechanical pattern in health and disease: beyond longitudinal shortening. Heart Failure Reviews. 24 (4), 511-520 (2019).
- Antoni, M. L., et al. Prognostic value of right ventricular function in patients after acute myocardial infarction treated with primary percutaneous coronary intervention. Circulation: Cardiovascular Imaging. 3 (3), 264-271 (2010).
- Amsallem, M., et al. Right Heart End-Systolic Remodeling Index Strongly Predicts Outcomes in Pulmonary Arterial Hypertension: Comparison With Validated Models. Circulation: Cardiovascular Imaging. 10 (6), (2017).
- Merlo, M., et al. The Prognostic Impact of the Evolution of RV Function in Idiopathic DCM. JACC: Cardiovascular Imaging. 9 (9), 1034-1042 (2016).
- Addetia, K., Muraru, D., Badano, L. P., Lang, R. M. New Directions in Right Ventricular Assessment Using 3-Dimensional Echocardiography. JAMA Cardiology. , (2019).
- Nagata, Y., et al. Prognostic Value of Right Ventricular Ejection Fraction Assessed by Transthoracic 3D Echocardiography. Circulation: Cardiovascular Imaging. 10 (2), (2017).
- Surkova, E., et al. Relative Prognostic Importance of Left and Right Ventricular Ejection Fraction in Patients With Cardiac Diseases. Journal of the American Society of Echocardiography. 32 (11), 1407-1415 (2019).
- Maffessanti, F., et al. Age-, body size-, and sex-specific reference values for right ventricular volumes and ejection fraction by three-dimensional echocardiography: a multicenter echocardiographic study in 507 healthy volunteers. Circulation: Cardiovascular Imaging. 6 (5), 700-710 (2013).
- . GE 4D RVQ White Paper Available from: https://www.imv-imaging.com/media/5879/4d_auto_rvq_whitepaper_v8.pdf (2017)
- Medvedofsky, D., et al. Novel Approach to Three-Dimensional Echocardiographic Quantification of Right Ventricular Volumes and Function from Focused Views. Journal of the American Society of Echocardiography. 28 (10), 1222-1231 (2015).
- Lakatos, B., et al. Quantification of the relative contribution of the different right ventricular wall motion components to right ventricular ejection fraction: the ReVISION method. Cardiovascular Ultrasound. 15 (1), 8 (2017).
- Lakatos, B. K., et al. Dominance of free wall radial motion in global right ventricular function of heart transplant recipients. Clinical Transplantation. 32 (3), e13192 (2018).
- Raina, A., Vaidya, A., Gertz, Z. M., Susan, C., Forfia, P. R. Marked changes in right ventricular contractile pattern after cardiothoracic surgery: implications for post-surgical assessment of right ventricular function. Journal of Heart and Lung Transplantation. 32 (8), 777-783 (2013).
- Nowak-Machen, M., et al. Regional Right Ventricular Volume and Function Analysis Using Intraoperative 3-Dimensional Echocardiography-Derived Mesh Models. Journal of Cardiothoracic and Vascular Anesthesia. 33 (6), 1527-1532 (2019).
- Pettersen, E., et al. Contraction pattern of the systemic right ventricle shift from longitudinal to circumferential shortening and absent global ventricular torsion. Journal of the American College of Cardiology. 49 (25), 2450-2456 (2007).
- Moceri, P., et al. Three-dimensional right-ventricular regional deformation and survival in pulmonary hypertension. European Heart Journal – Cardiovascular Imaging. , (2017).
- Addetia, K., et al. Three-dimensional echocardiography-based analysis of right ventricular shape in pulmonary arterial hypertension. European Heart Journal – Cardiovascular Imaging. 17 (5), 564-575 (2016).
- Addetia, K., et al. Morphologic Analysis of the Normal Right Ventricle Using Three-Dimensional Echocardiography-Derived Curvature Indices. Journal of the American Society of Echocardiography. 31 (5), 614-623 (2018).
- Lakatos, B. K., et al. Exercise-induced shift in right ventricular contraction pattern: novel marker of athlete’s heart?. American Journal of Physiology – Heart and Circulatory. , (2018).
- Corrado, D., et al. Arrhythmogenic right ventricular cardiomyopathy: evaluation of the current diagnostic criteria and differential diagnosis. European Heart Journal. , (2019).
- Luo, S., et al. Right ventricular outflow tract systolic function correlates with exercise capacity in patients with severe right ventricle dilatation after repair of tetralogy of Fallot. Interactive Cardiovascular and Thoracic Surgery. 24 (5), 755-761 (2017).
