The dimensions of the pulmonary veins (PV) are important parameters when planning pulmonary vein isolation. 2D transoesophageal echocardiography can only provide limited data about the PVs; however, 3D echocardiography can evaluate relevant diameters and areas of the PVs, as well as their spatial relationship to surrounding structures.
The dimensions of the pulmonary veins are important parameters when planning pulmonary vein isolation (PVI), especially with the cryoballoon ablation technique. Acknowledging the dimensions and anatomical variations of the pulmonary veins (PVs) may improve the outcome of the intervention. Conventional 2D transoesophageal echocardiography can only provide limited data about the dimensions of the PVs; however, 3D echocardiography can further evaluate relevant diameters and areas of the PVs, as well as their spatial relationship to surrounding structures. In previous literature data, parameters influencing the success rate of PVI have already been identified. These are the left lateral ridge, the intervenous ridge, the ostial area of the PVs and the ovality index of the ostium. Proper imaging of the PVs by 3D echocardiography is a technically challenging method. One crucial step is the collection of images. Three individual transducer positions are necessary to visualize the important structures; these are the left lateral ridge, the ostium of the PVs and the intervenous ridge of the left and right PVs. Next, 3D images are acquired and saved as digital loops. These datasets are cropped, which result in the en face views displaying spatial relationships. This step can also be employed to determine the anatomical variations of the PVs. Finally, multiplanar reconstructions are created to measure each individual parameter of the PVs.
Optimal quality and orientation of the acquired images are paramount for the appropriate assessment of PV anatomy. In the present work, we examined the 3D visibility of the PVs and the suitability of the above method in 80 patients. The aim was to provide a detailed outline of the essential steps and potential pitfalls of PV visualization and assessment with 3D echocardiography.
The drainage pattern of the pulmonary veins (PV) is highly variable with 56.5% variation in the average population1. Evaluation of the PV drainage pattern is crucial when planning PV isolation (PVI), which is the most common interventional treatment of atrial fibrillation nowadays2,3,4. Although radiofrequency catheter ablation has been the standard technology for achieving PVI, the cryoballoon (CB)-based ablation technology (CA) is an alternative method requiring less procedural time. The technique is less complicated compared with radiofrequency ablation5,6, while the efficacy and safety of CA are similar to those of radiofrequency ablation7.
The rate of procedural PV occlusion by the CB and the continuous circumferential extension of tissue injury in the PV ostium determines the permanent success of PVI after CA. One of the main determinants of PV occlusion is the variation of PV anatomy. In recent, computed tomography- (CT) and cardiac MRI-based studies, several PV parameters were identified with predictive values of short and long term success rates following CA. These parameters included variations of both the PV anatomy (left common PV, supernumerary PVs8,9,10, ostial area, ovality index8,11,12,13) and its surroundings (intervenous ridge8,14,15,16, thickness of left lateral ridge8,9,17).
Although conventional 2D echocardiography is not suitable for displaying and measuring most of the above parameters, three-dimensional transesophageal echocardiography (3D TEE) seems to be an alternative tool to visualize the PVs, as demonstrated in previous literature data18,19.
Furthermore, 3D TEE prior to PVI brings additional value compared to CT or MRI, as it not only provides data on PV characteristics for procedural design, but also clarifies whether a thrombus in the left atrial appendage (LAA) is present. This investigation is especially important prior to PVI. At the same time, 3D TEE requires less time, its procedural cost is low, and it does not expose the patient and the medical staff to radiation.
In the past, several types of CBs existed with different sizes, which made it difficult to extrapolate how the various parameters of the PVs influence the success rate of CA. Today, the newly introduced second-generation CB is used for CA, which only exists in one size. Thanks to its improved cooling effect, the second-generation CB offers a much higher performance compared to the first-generation CB20, which further highlights the importance of PV anatomy and interventional planning before PVI.
All the patients signed informed consent before examination according to approval of the local ethical committee (OGYÉI/12743/2018).
1. Preparation
2. Image acquisition
3. 3D image reconstruction and measurements
Using the above-described image acquisition protocol, the first step is to visualize the left atrial appendage (LAA) using 2D acquisition (Figure 1). The probe is in the upper (or mid) transoesophageal position at 20-45°. The image shows the LAA. The left lateral ridge and the left upper PV is displayed at 60-80° (Figure 2), and then the 3D dataset is acquired and confirmed by cropping the dataset in order to visualize the LAA and the left lateral ridge with the left upper PV ostium (Figure 3). If the dataset does not encompass the whole structure of the LAA and the left lateral ridge, the image acquisition is repeated while changing the probe angulation, flexion or changing the patient position.
The next step is to visualize the left PVs. The probe angulation is changed to at around 120° to centralize the image to the LAA, and then the probe is turned slightly counterclockwise while moving the probe head to anteflexion. When the left PV ostium is visible (Figure 4), color Doppler is used to confirm that both the upper and lower PV is visible (Figure 5). Then the 3D dataset is acquired and confirmed by cropping the image to left upper and lower PV ostia with the intervenous ridge (Figure 6). If the dataset does not encompass the whole structure of the left PV ostium, image acquisition should be repeated while changing the probe angulation, flexion or changing the patient position.
The next step is the visualization of the right PVs. The probe angulation is changed to approximately 45° to centralize the image to the LAA, and then the probe is turned slightly clockwise while moving the probe head to anteflexion. When the right PV ostium is visible (Figure 7), color Doppler-coded imaging is used to confirm that both the upper and lower PV is clearly visible (Figure 8). Then the 3D dataset is acquired and confirmed by cropping the image to the right upper and lower PV ostia with the intervenous ridge (Figure 9 and Figure 10). If the dataset does not encompass the whole structure of the right PVs ostia, image acquisition should be repeated while changing the probe angulation, flexion or changing the patient position.
The next step is to prepare the 3D dataset offline and perform the measurements. The selected 3D dataset is opened in a dedicated platform-specific or a vendor-independent software for multiplanar reconstruction of the 3D images. First, one should select a frame timed to the T wave, and then two perpendicular planes are positioned to the PV ostia. The 3rd plane represents the en face view of the ostium (Figure 11), which is suitable to measure dimensions (distances, area). If the two perpendicular planes are fitted to the ridge, the widths of the ridges can be measured.
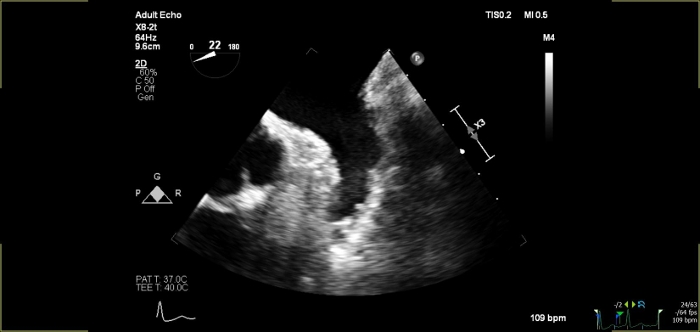
Figure 1: 2D view of the left atrial appendage at 22°.
Left atrial appendage Please click here to view a larger version of this figure.
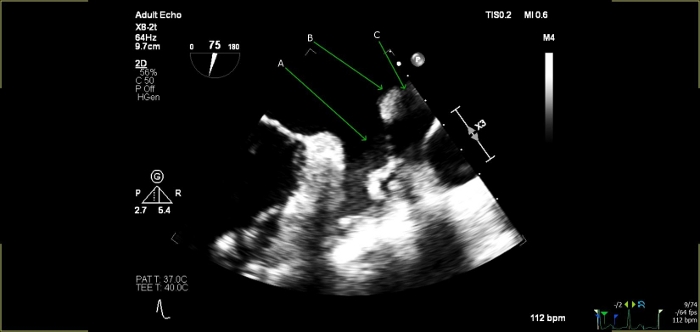
Figure 2: 2D view of the left atrial appendage at 75°.
(A) Left atrial appendage; (B) Left lateral ridge; (C) Left upper pulmonary vein Please click here to view a larger version of this figure.
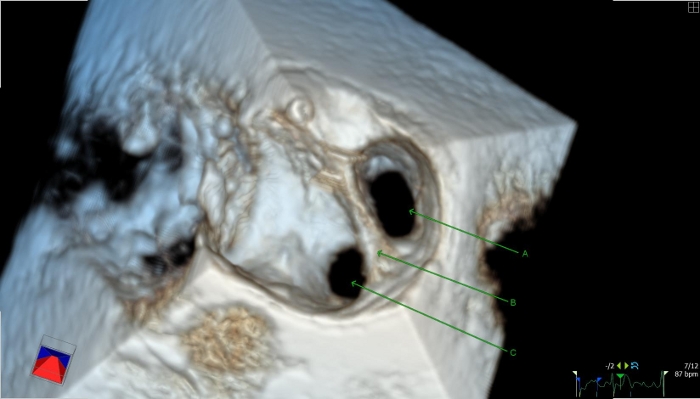
Figure 3: 3D reconstruction of the left lateral ridge and the left upper pulmonary vein.
(A) Ostium of the left upper pulmonary vein; (B) Left lateral ridge; (C) Left atrial appendage Please click here to view a larger version of this figure.
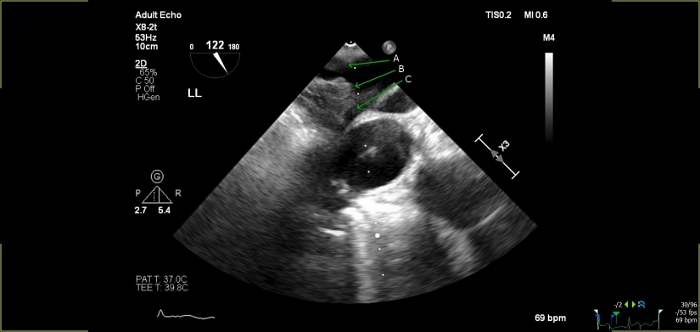
Figure 4: 2D view of the left pulmonary veins at 122°.
(A) Left lower pulmonary vein; (B) Intervenous ridge; (C) Left upper pulmonary vein Please click here to view a larger version of this figure.
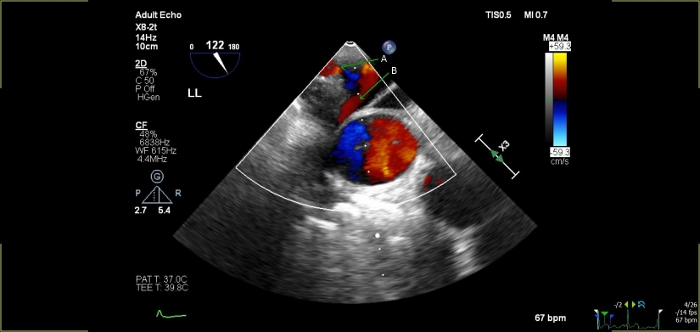
Figure 5: 2D color-coded image of the left pulmonary veins at 122° to confirm pulmonary venous flow.
(A) Left lower pulmonary vein; (B) Left upper pulmonary vein Please click here to view a larger version of this figure.
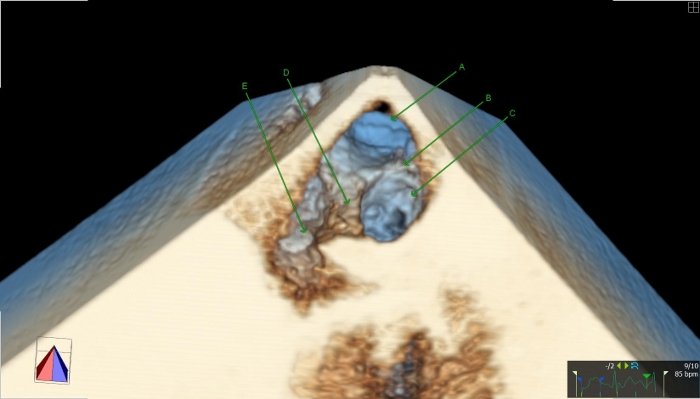
Figure 6: 3D reconstruction of the left pulmonary veins.
(A) Ostium of the left lower pulmonary vein; (B) Intervenous ridge; (C) Left upper pulmonary vein; (D) Left lateral ridge; (E) Left atrial appendage Please click here to view a larger version of this figure.
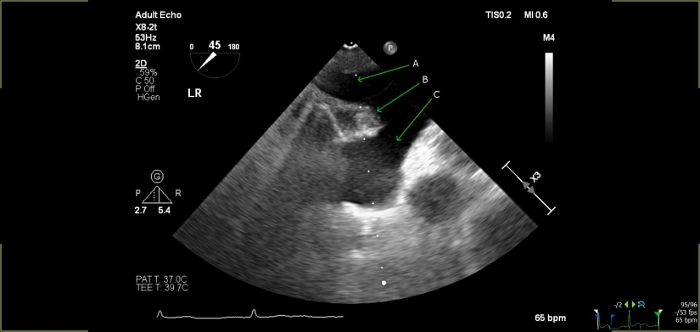
Figure 7: 2D view of the right pulmonary veins at 45°.
(A) Right lower pulmonary vein; (B) Intervenous ridge; (C) Right upper pulmonary vein Please click here to view a larger version of this figure.
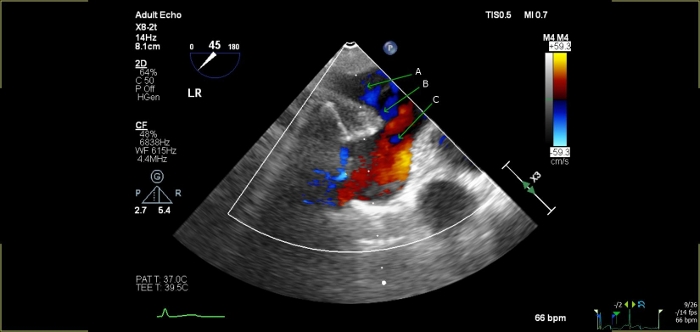
Figure 8: 2D with color-coded image of the right pulmonary veins at 45° to confirm pulmonary venous flow.
(A) Right lower pulmonary vein; (B) Intervenous ridge; (C) Right upper pulmonary vein Please click here to view a larger version of this figure.
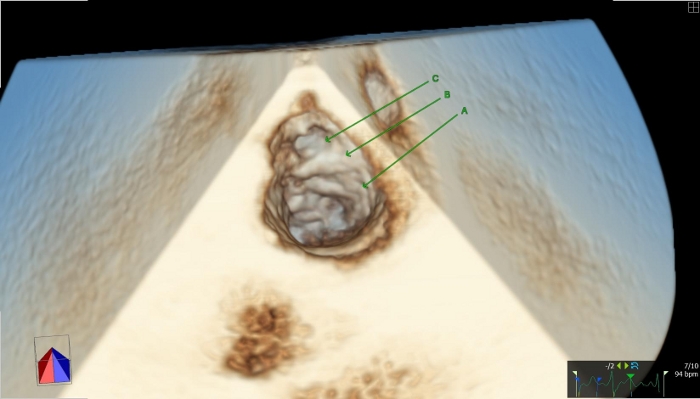
Figure 9: 3D reconstruction of the right pulmonary veins focusing on the right upper vein.
(A) Right upper pulmonary vein; (B) Intervenous ridge; (C) Right intermediate pulmonary vein (example for a supernumerous drainage pattern on the right side) Please click here to view a larger version of this figure.
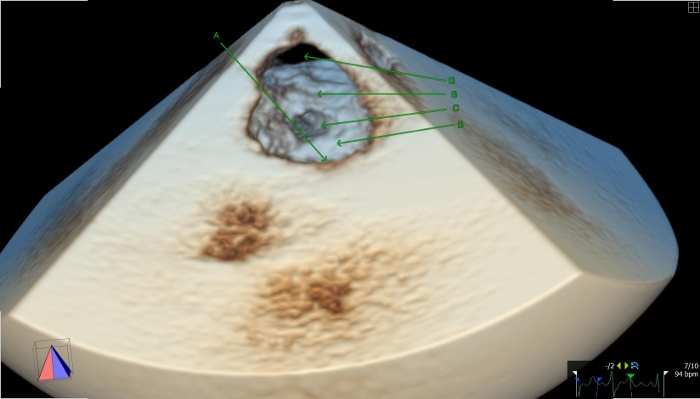
Figure 10: 3D reconstruction image of right pulmonary veins tilting the focus toward the right lower PV.
(A) Right upper pulmonary vein; (B) Intervenous ridge; (C) Right intermediate pulmonary vein (example for supernumerous drainage pattern in the right side); (D) Right lower pulmonary vein Please click here to view a larger version of this figure.
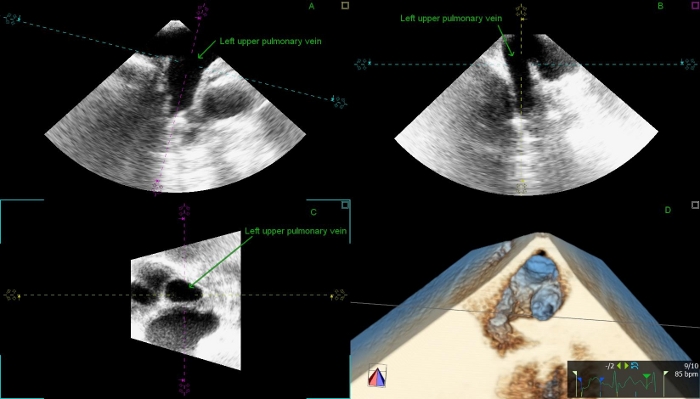
Figure 11: Multiplanar reconstructed 3D images of the left upper pulmonary venous ostium.
(A,B) Two perpendicular planes show the left upper PV longitudinally. The dotted lines represent the cutting planes. The blue one was fitted to the PV’s ostium. (C) Short axis view shows the en face view of the left upper pulmonary vein; (D) 3D dataset with a cutting plane. Please click here to view a larger version of this figure.
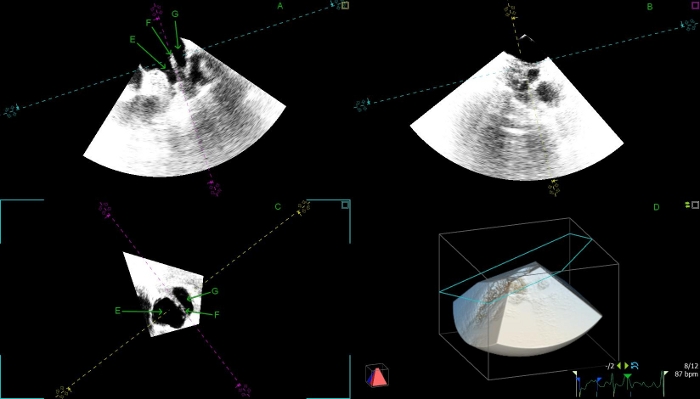
Figure 12: Multiplanar reconstructed 3D images of the left lateral ridge and left upper pulmonary vein.
(A) Left atrial appendage (longitudinal view – panel A; cross-sectional view – panel C); (B) Left lateral ridge (longitudinal view – panel A; cross-sectional view – panel C); (A) Left upper pulmonary vein (longitudinal view – panel A; cross-sectional view – Panel C) Please click here to view a larger version of this figure.
Here, we demonstrate a step-by-step methodology to study the PVs, their surrounding structures and anatomical characteristics with 3D echocardiography. The above described method for 3D imaging of the PVs is an easily standardizable method, which provides high quality 3D images in most patients suitable for precise measurements. Optimal quality and orientation of the acquired images are paramount for the appropriate assessment of PV anatomy. The 3D reconstructed images enhance the visualization of the PV drainage pattern and its anatomical variability, which may influence the success rate of PVI with CA.
3D imaging of the PVs overcomes the technical limitations of conventional 2D transoesophageal echocardiography and makes the 3D transoesophageal echocardiography method allow to substitute cardiac MRI or CT imaging of PVs before PVI, especially if the last imaging techniques are not available.
The important step is changing the patient position during the examination if the visibility of the PVs is not satisfactory. This modification contributes to improve the visibility of the PVs. Displaying the right lower PV is the most challenging part of this method. If some parts of the PV’s ostium are outside the 3D dataset due to anatomical reasons (e.g., angulation or close proximity to the transducer), the precise measurement of PV’s parameter will not be possible, which is the limitation of this method.
The authors have nothing to disclose.
This work was funded by the Hungarian Government Research Fund [GINOP-2.3.2-15-2016-00043, Szív- és érkutatási kiválóságközpont (IRONHEART)].
4D Cardio-view 3 software | Tomtec Imaging Systems GmbH | ||
Epiq 7G scanner | Philips | ||
Q-Lab Software | Philips | ||
X5-1 transducer | Philips |