By delivering and removing proteins to and from the plasma membrane, membrane protein trafficking in neurons controls the plasma membrane equipment with receptors as well as ion channels and, as a result, regulates neuronal function. Misregulation or defects in protein trafficking typically have detrimental effects on cells and result in neuronal degeneration. In humans, this may cause neurodegenerative diseases such as Alzheimer's and Parkinson's disease or Retinitis pigmentosa1. Photoreceptors in the compound eye of Drosophila melanogaster have become an in vivo model system for studying membrane protein trafficking2. This is not only due to the genetic versatility of Drosophila that allows effective genetic screens, but also because all essential components of the light-absorbing photoreceptor membrane are characterized in great detail and efficient microscopic techniques are available that can be applied to the fly eye. These techniques are the focus of this article.
In Drosophila photoreceptor cells, the apical plasma membrane forms a densely packed stack of microvilli along one side of the cell, termed rhabdomere. The rhabdomeres of photoreceptor cells R1-6 are arranged in a characteristic trapezoidal pattern while photoreceptor cells R7 and R8 form a single rhabdomere in the center of this trapezoid3. Membrane protein trafficking is needed for a regulated turnover of rhabdomeral membrane proteins such as rhodopsin and the light-activated TRP (transient receptor potential) and TRPL (TRP-like) ion channels to assure the proper amount of these phototransduction proteins in the rhabdomere. Photoreceptor membrane proteins are synthesized in the endoplasmic reticulum and transported via the Golgi apparatus to the rhabdomere. Following activation of rhodopsin by light, a rhodopsin molecule can either become inactivated by absorption of a second photon or can be removed from the rhabdomere by clathrin-mediated endocytosis. Endocytosed rhodopsin either becomes degraded in the lysosome or is recycled back to the rhabdomere4,5. The ion channel TRPL is also internalized following activation of the phototransduction cascade and undergoes a light-dependent translocation between the rhabdomere (where it is located when flies are kept in the dark) and an ER-enriched storage compartment in the cell body (to which it is transported within several hours upon illumination)6,7,8,9,10. In contrast to endocytosed rhodopsin, only small amounts of TRPL are degraded via the endolysosomal pathway, and the majority is stored intracellularly instead and recycled back to the rhabdomere upon dark adaptation6. TRPL can thus be used for analyzing light-triggered trafficking of plasma membrane proteins. Drosophila photoreceptor cells are also employed for studying neuronal degeneration. Photoreceptor cell degeneration is frequently determined by assessing the structure of rhabdomeres, which disintegrate as a result of degenerative processes5.
In order to study the subcellular localization of TRPL and rhodopsin in photoreceptor cells or photoreceptor cell degeneration, two fluorescence microscopy methods that differ with respect to analysis speed and resolution have been applied here. A very fast, non-invasive method that can be used for genetic screens but with a limited spatial resolution is the detection of fluorescence in the deep pseudopupil (DPP). The DPP is an optical phenomenon of arthropod compound eyes whose geometric origin has been explained in detail by Franceschini and Kirschfeld in 197111. In short, on several optical planes below the retina overlay-images of rhabdomeres from adjacent ommatidia can be observed. On a focal plane through the center of the eye's curvature, these superimposed projections form an image that resembles the trapezoidal layout of rhabdomeres in a single ommatidium only orders of magnitude larger. This phenomenon can also be observed independently of exogenous expression of fluorescence proteins (e.g. TRPL::eGFP8), which nonetheless make the DPP easier to detect (Figure 1A–A'')12. A second non-invasive method is water immersion microscopy that relies on imaging fluorescently tagged proteins after optically neutralizing the eyes' dioptric apparatus with water (Figure 1B–C'')12. Using the water immersion method, the relative amount of TRPL::eGFP in the rhabdomeres or cell body can be assessed quantitatively for individual photoreceptor cells. Furthermore, non-translocating fluorescence-tagged proteins can be utilized to evaluate rhabdomeral integrity and to determine the time course of a potential degeneration in a quantitative manner, as described here.
While recordings of the DPP are by far the easiest and fastest of these methods to perform, the spatial resolution of data they generate is limited. In addition, there are numerous reasons why a DPP may be absent, which are not necessarily discernible by DPP imaging itself. Since the DPP represents a summation of several ommatidia, information about individual cells is lost. Thus, low-resolution DPP imaging serves an important function in screening large numbers of flies but should generally be followed by higher resolution recordings by way of water immersion microscopy. Water immersion micrographs allow interpretations about individual cells, developmental defects, eye morphology, protein mislocalization or retinal degeneration as well as quantification of these effects. This Protocol describes these two techniques in detail.
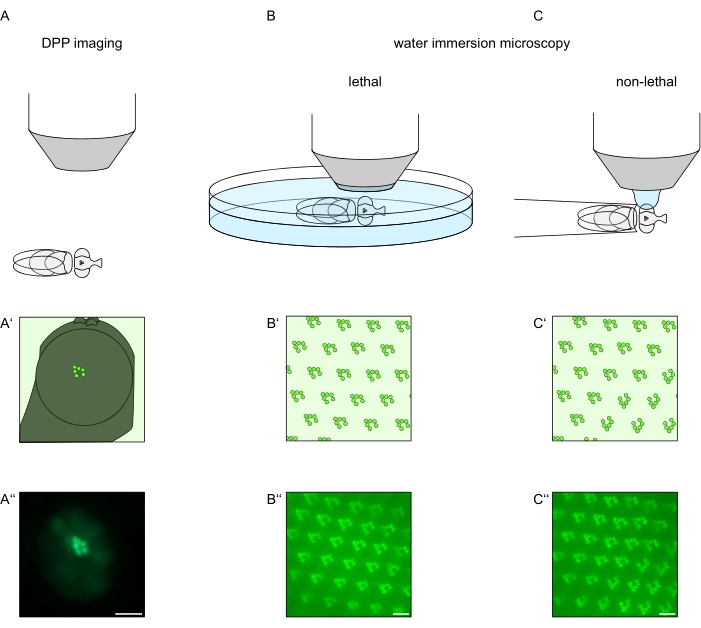
Figure 1: Overview of microscopy variations for the Drosophila eye presented in this Protocol. Schematic representations and exemplary micrographs of (A–A'') fluorescent deep pseudopupil (DPP) imaging, (B–B'') lethal water immersion microscopy of fluorescent rhabdomeres, and (C–C'') non-lethal water drop microscopy of fluorescent rhabdomeres. Scale bar (A''): 100 µm. Scale bars (B''–C''): 10 µm. The figure has been modified from reference13. Please click here to view a larger version of this figure.
1. General considerations
- Use Drosophila stocks expressing a permanently rhabdomerally located fluorescence protein for morphological analysis (e.g., TRP::eGFP, eGFP::NINAC) and translocating proteins for analyses regarding protein trafficking (e.g., TRPL::eGFP, Arr2::eGFP).
- Predetermine light exposure conditions of selected flies for the experimental approach.
- For dark-adaptation, keep the flies in dark boxes for the desired period at 25 °C. For illumination up to 16 h in translocation experiments (e.g., TRPL::eGFP expressing flies), keep flies under a fluorescent tube at room temperature.
- In experiments assessing photoreceptor degeneration (e.g., TRP::eGFP expressing flies), keep the flies under a fluorescent tube at 25 °C in a 12 h light / 12 h dark cycle for long-term illumination of up to 28 days with white light.
- For illuminating flies with colored light, use different colored transparent plastic boxes along with the fluorescent tube.
- If fly stocks with pigmented eyes are used, age animals precisely for comparative analysis, since eye pigmentation may increase significantly with age.
NOTE: For data interpretation, it is important to note that there exists a signal bias due to the optical waveguiding effect of the rhabdomeral structure. Accordingly, the fluorescence signal from the rhabdomere will always be amplified to a certain extent in DPP imaging and water immersion microscopy relative to signals obtained from the cell body. This is most prominently observed in pigmented eyes, where fluorescence from outside the rhabdomeres is absorbed by these pigments and is of particular importance when intracellularly translocating fusion proteins are to be detected. Thus, with regard to critical steps, this study considers white- and red-eyed flies separately. - Regarding water immersion microscopy, two variations are described. A faster lethal variation as well as a non-lethal variation allowing recovery for subsequent studies.
2. DPP imaging
- Prepare the working space with the needed equipment and reagents as shown in Figure 2. Anaesthetize flies (1-3 days old) of a genotype that expresses a fluorescence protein in photoreceptor cells with CO2 on a flypad. Select animals for imaging under a stereo microscope with a conventional light source and low magnification (e.g., 10x).
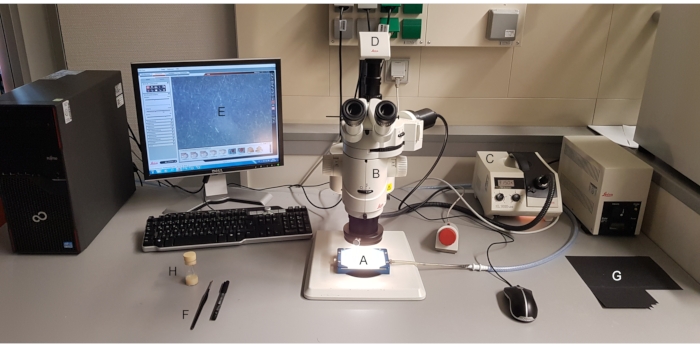
Figure 2: DPP imaging workspace. Materials needed are (A) CO2 anesthesia apparatus, (B) stereo microscope with a UV lamp and fluorescence filter set, (C) light source, (D) microscope-mounted camera with (E) software, (F) paint brush, (G) black cardboard, and (H) fly vial. Please click here to view a larger version of this figure.
- For DPP imaging, keep the selected flies anesthetized and position one of them in the center of the microscope objective on its side so that either the left or the right eye is facing the objective precisely radially (Figure 3A).
NOTE: Since the ommatidial layout of photoreceptor cells displays mirror symmetry at the dorsoventral midline, the DPP is best observed slightly above or below the eye's equator (Figure 3B).
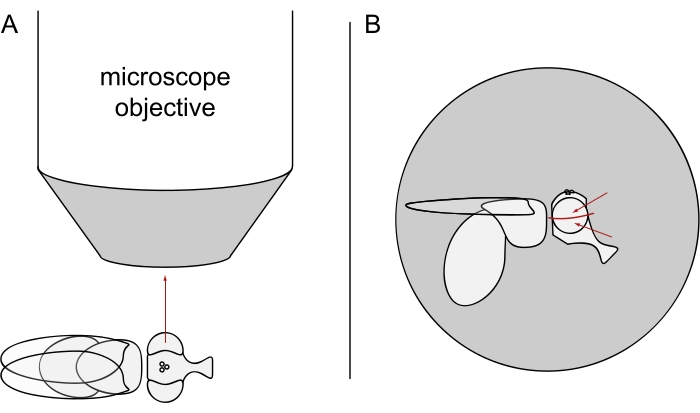
Figure 3: Positioning of the fly under the stereomicroscope for DPP imaging. (A) Illustration of the fly on its side with one eye facing the microscope objective radially. (B) The fly head needs to be turned slightly up or down such that the objective focuses on a point slightly above or below the eye's equator as indicated by the red arrows. Please click here to view a larger version of this figure.
- Increase the magnification to fit the entire eye (e.g., 100x) and center the central ommatidia of the eye. Decrease the depth of field of the microscope, e.g., by adjusting the double-iris diaphragm to a shallow setting (Figure 4A-B').
- Switch off the conventional light source and switch on the microscope UV lamp at maximum intensity and select the fluorescence filter set of the microscope according to the fluorescence protein expressed in the eyes (Figure 4C-E). Set the light path toward the microscope-mounted camera.
- Use the live imaging feature within the software to adjust the brightness of the image to a setting that detects only specific signals from the eye by adjusting the exposure time and gain value (e.g., 80 ms and 12x, respectively). Readjust the microscope focus "into" the eye (below the cornea) to generate the superimposed image of the DPP (Figure 4C-E').
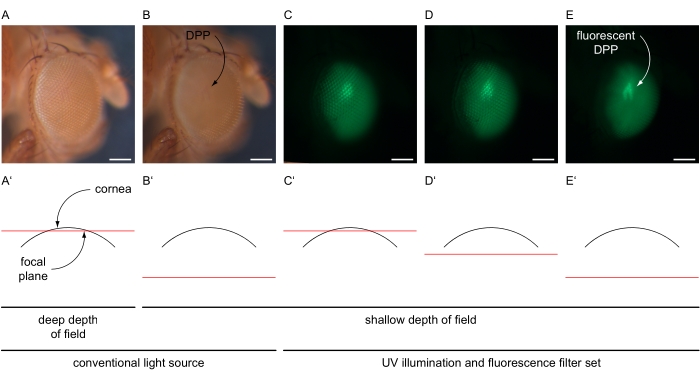
Figure 4: Illustration of DPP and fluorescent DPP imaging. Exemplary images of Drosophila eyes under conventional and UV illumination with GFP filter set, taken with varying focal planes illustrated in schematic cross-sections through the eye. (A) Micrograph recorded with bright settings of a conventional light source, 30 ms exposure time, 1x gain, deep depth of field, and focal plane near the surface of the cornea as illustrated in (A'). (B) Micrograph recorded with bright settings of a conventional light source, 30 ms exposure time, 1x gain, shallow depth of field, and focal plane approximately 180 µm below the surface of the cornea as illustrated in (B'). DPP indicated. (C–E) Micrograph recorded with high-intensity settings of UV light source and GFP filter set, 80 ms exposure time, 12x gain, shallow depth of field, and the focal plane (C') near, (D') slightly below, or (E') approximately 180 µm below the surface of the cornea. Fluorescent DPP is indicated with a curved arrow. Scale bar 100 µm. Please click here to view a larger version of this figure.
- Take a snapshot of the fluorescent DPP. Switch the microscope back to visible light and the light path back toward the oculars. Recover the imaged animal in a fly vial for further proceedings according to its DPP phenotype (e.g., crosses). Continue with the next animal in step 2.2.
3. Water immersion microscopy
- Fly preparation
- Prepare the working space with the needed equipment and reagents as shown in Figure 5. Transfer flies with predetermined age and illumination conditions into a pre-cooled 15 mL centrifuge tube and anesthetize by incubating them on ice for 15 to 30 min.
NOTE: Carry along 1-day old, dark-adapted flies as reference. Generally, dark-adapted flies should be transferred to an icebox with a lid in the dark. Light-adapted flies can be transferred to the ice in room light.
- Prepare the working space with the needed equipment and reagents as shown in Figure 5. Transfer flies with predetermined age and illumination conditions into a pre-cooled 15 mL centrifuge tube and anesthetize by incubating them on ice for 15 to 30 min.
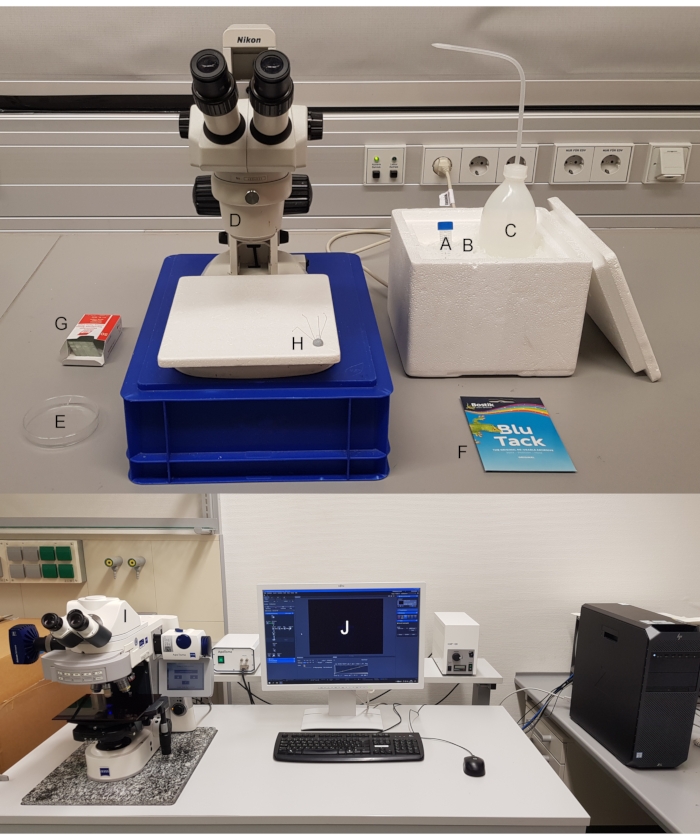
Figure 5: Water immersion microscopy workspace. Materials needed are: (A) 15 mL centrifuge tube, (B) ice flakes, (C) chilled distilled water, (D) stereomicroscope, (E) Petri dish, (F) plasticine, (G) object slide, (H) insect pins or pipette tips and scalpel, (I) fluorescence microscope with (J) software. Please click here to view a larger version of this figure.
- Select the appropriate preparation from the two described below (3.1.3 lethal variation or 3.1.7 non-lethal variation) and whenever differentiation between pigmented and non-pigmented eyes is made, follow the respective steps.
- Prepare flies for the lethal variation as follows.
- Adhere a piece of plasticine onto an object slide and another piece into the center of a Petri dish (e.g., 94 mm Ø) and keep them separate for now. Fill the Petri dish with ice-chilled distilled water and some ice flakes (Figure 6A).
- Put one ice-anesthetized fly under a stereomicroscope on top of the plasticine-coated object slide. Turn the fly on its back and pierce an insect pin through the center of the thorax (Figure 6B). Fix the pin horizontally on the plasticine-coated object slide and orient either the left or the right eye of the fly upward (Figure 6C).
- Carefully fix the object slide, with its plasticine-free side facing down, in the Petri dish preventing rotation of the fly. Make sure that the fly eye is covered with water (Figure 6D). Use a preparation needle to carefully remove any air bubbles that may have formed around the eye, and immediately proceed to image acquisition for best results.
NOTE: Significant delay in image acquisition results in reawakening and movements of the fly which may lead to blurry images.
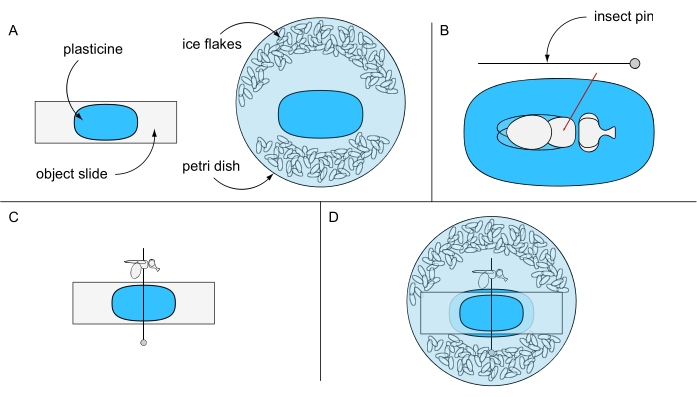
Figure 6: Preparation for lethal water immersion microscopy. Illustration of (A) plasticine-coated object slide and Petri dish, (B) pinning a fly through thorax on plasticine ground, (C) fly orientation on the plasticine-coated object slide, and (D) final experimental setup. Please click here to view a larger version of this figure.
- Prepare flies for the non-lethal variation as follows.
- Transfer one ice-anesthetized fly headfirst into a 200 µL pipette tip and push the fly toward the tip carefully with compressed air.
- Cut off the pipette tip just in front of the head using a scalpel. Using tweezers, carefully push the fly a few millimeters away from the tip. Cut off the pipette tip again and push the fly back toward the tip with compressed air so that only the head of the fly protrudes from the pipette tip.
- Adhere a piece of plasticine onto an object slide and press the pipette tip into it so that either the left or the right eye of the fly faces upward (Figure 7A). Right before image acquisition, use a laboratory pipette to adhere a large drop of chilled water to the underside of a water immersion objective (Figure 7B). Immediately proceed to image acquisition for best results.
NOTE: Significant delay in image acquisition results in reawakening and movements of the fly which may lead to blurry images.
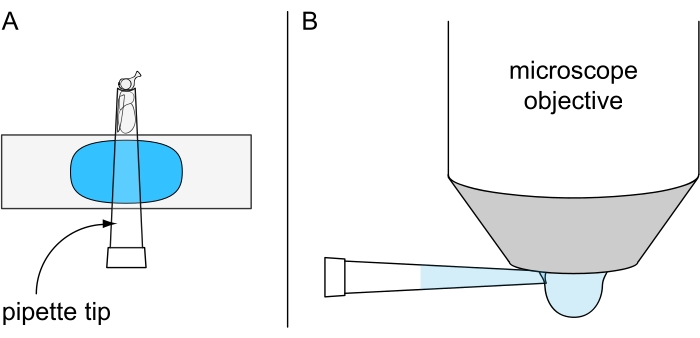
Figure 7: Preparation for non-lethal water drop microscopy. Illustration of (A) a cold-anesthetized fly fixed inside a 200 µL pipette tip mounted on plasticine-coated object slide and (B) the application of chilled water drop on the underside of the water immersion objective. Please click here to view a larger version of this figure.
- Image acquisition
- Carefully place the Petri dish (step 3.1.3) or the object slide (step 3.1.7) with the prepared fly onto the microscope stage and select a water immersion objective.
- Lower the water immersion objective manually until it contacts the water surface (step 3.1.3) or the fly's eye touches the drop (step 3.1.7) (Figure 8A,B).
- Switch on the microscope UV lamp and select the appropriate filter set. Use the eyepieces to position the fly under the objective and focus the microscope on the surface of the eye.
- Switch the light path toward the microscope camera and generate a live image in the corresponding software. Readjust the focus for the camera and evaluate the orientation of the eye, considering that the eye has to face the microscope objective radially as illustrated in more detail in Figure 8C-E.
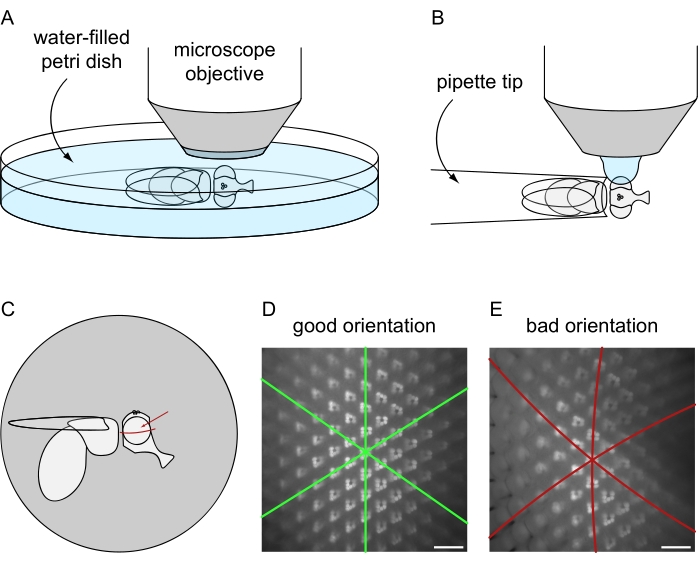
Figure 8: Positioning of the fly under the fluorescence microscope for water immersion imaging. Setup and final orientation for image acquisition using the (A) lethal or (B) non-lethal fly preparation protocols. (C) Illustration of fly orientation for obtaining best results of water immersion microscopy images. The ideal point to focus on the eye is not the exact center with respect to the anterior/posterior and dorsal/ventral axes but is slightly above the eye's equator, as indicated by the red arrow. (D) Example of water immersion image for a perfectly positioned eye. All three symmetry axes of the hexagonal ommatidial tiling appear as straight lines and the maximum amount of ommatidia can be in focus at the same time. (E) Example of water immersion image of an improperly positioned eye. The image contains curved axes and a shallow depth of field. Scale bar: 20 µm. Please click here to view a larger version of this figure.
- Use the appropriate LUT (look up table) within the imaging software to detect oversaturation (indicated as red pixels).
- In the case of non-pigmented flies, adjust the exposure time such that the brightest pixels are just below the saturation limit for every image.
- In the case of pigmented flies and the lethal variation, adjust the exposure time such that all the brightest pixels are just below the saturation limit in at least five individual 1-day old, dark-adapted flies. Apply the calculated average exposure time to all other experimental conditions (genotypes, illumination conditions, time points, etc.).
- In the case of pigmented flies (e.g., red-eyed) and the non-lethal variation, adjust the exposure time such that all the brightest pixels are just below the saturation limit for each 1-day old, dark-adapted fly individually. Apply this exposure time to all other experimental conditions (illumination conditions, time points, etc.) of this fly.
- Record an image and save it as a raw file to archive all corresponding metadata of the recording. Export the image in a .tif format for the following quantification.
NOTE: In the case of the non-lethal variation, illuminate the flies for 5 minutes with red light (e.g., 630 nm) immediately after image acquisition, if they are intended to be used for further experiments. Red light deactivates the phototransduction cascade that has been activated excessively by intense shortwaved light during image acquisition.
- Data analysis and quantification of relative eGFP fluorescence in the rhabdomeres of water immersion micrographs
- Download, install and execute the software ImageJ/Fiji.
- Adjust the ImageJ settings by clicking on Analyze > Set Measurements… and check only the box for Mean Gray Value. Import a .tif image by clicking on File > Open… or by dragging and dropping. Choose a representative region of the image that is in focus and enlarge it to 200%-300% by repeatedly pressing Ctrl and + together .
- Select the Oval tool and while pressing the Shift key generate a circular selection in the image that is significantly smaller than one fluorescent rhabdomere. Before releasing the mouse button, look for the exact size displayed below the toolbar in the ImageJ main window. Use the same size of circular selection for all analyses.
NOTE: The exact size of the circular selection in pixels or microns depends on the specific setup. Use a circle approximately 1/3 or 1/4 of the rhabdomeral diameter of 1-day old, dark-adapted control flies. - Move the circular selection either by mouse-clicking into it and dragging or by pressing the Arrow Keys on the keyboard.
- To measure the fluorescence intensities within the circular selection, move the circle to the first rhabdomere (r1) and click on Analyze > Measure or use the shortcut Ctrl + M. A Result window listing the measured gray value will pop up.
- Continue with measurements of r2-r6 as repeated measurements and a measurement of the background signal (b). In the case of non-pigmented flies, make additional measurements of the corresponding cell body areas (c1-c6) (Figure 9).
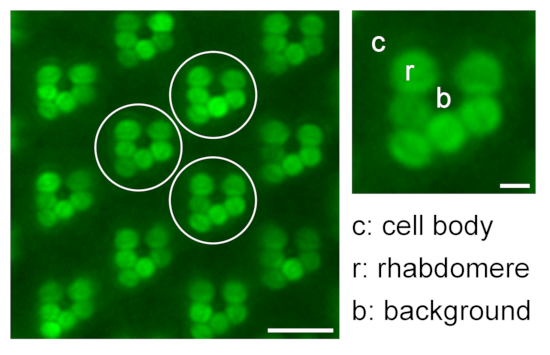
Figure 9: Quantification of relative rhabdomeral fluorescence for translocation studies. An illustration regarding quantification of relative eGFP fluorescence in the rhabdomeres by measuring the fluorescence intensity of rhabdomere (r), cell body (c), and background (b) of three different representative ommatidia (white circles) in one water immersion microscopy image; scale bar: 10 µm. A magnified ommatidium is shown on the right; scale bar: 2 µm. Please click here to view a larger version of this figure.
- Repeat steps 3.3.5 and 3.3.6 for two more ommatidia, resulting in three technical replicates. Mark the analyzed ommatidia by using the Pencil tool and save this image for documentation.
- Select and copy the measured gray values from the Result window and paste them into spreadsheet software for further calculations. Sort the values of fluorescence intensity according to their origin into the categories rhabdomere (r), cell body (c), and background (b). Calculate the mean intensity from each category (Ir, Ic, Ib).
- Calculate the relative amount of eGFP present in the rhabdomere (R), using the following formula (1) for non-pigmented and formula (2) for pigmented eyes:
 (1)
(1)
 (2)
(2) - Continue with the next image in step 3.3.3. It is recommended to use images from at least five individuals of each experimental group as biological replicates to get a reliable measurement.
- Data analysis and quantification of eye morphology by eGFP fluorescence in water immersion micrographs
- Download, install and execute the ImageJ/Fiji software. Import a .tif image by clicking on File > Open… or by dragging and dropping. Choose three adjacent ommatidia in a representative region of the image that is in focus.
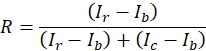
- Evaluate the 18 rhabdomeres of the selection individually according to their eGFP intensity, edge sharpness, and contrast with respect to the surrounding background signal to generate a degeneration index. Score clearly visible rhabdomeres with a value of 2, weakly visible rhabdomeres with a value of 1, and absent rhabdomeres with a value of 0 (Figure 10).
NOTE: This way of quantification results in a score of 36 for fully intact eyes and a score of 0 for fully degenerated eyes. It is recommended to set the score of 36 to 100% on the degeneration index.
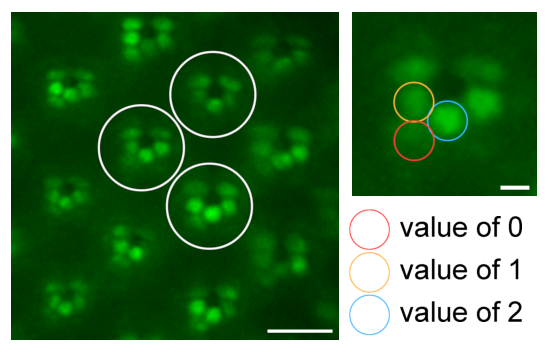
Figure 10: Quantification via rhabdomere evaluation for degeneration studies. An illustration regarding quantification of eye morphology by scoring the rhabdomeres of three different representative ommatidia (white circles) in one water immersion microscopy image with values of 2 (clearly visible; blue circle), 1 (weakly visible; orange circle), or 0 (absent; red circle). Scale bar: 10 µm. A magnified ommatidium is shown on the right; scale bar: 2 µm. Please click here to view a larger version of this figure.
- Open the next image and continue with step 3.4.2. It is recommended to use images from at least eight individuals of each experimental group as biological replicates to get a reliable measurement.
NOTE: Since this quantification method is less objective than the method for quantifying translocation by fluorescence intensity, the recommended number of replicates is higher.
Transgenic Drosophila flies expressing a TRPL::eGFP fusion protein under the control of the rhodopsin 1 promoter have been generated. In these flies, TRPL::eGFP is expressed in photoreceptor cells R1-6 of the compound eye and displays an illumination-dependent localization. When flies are kept in the dark, TRPL::eGFP is incorporated into the outer rhabdomeres. After illumination for several hours, TRPL translocates into the cell body where it is stored in an ER-enriched compartment.8,10 When TRPL::eGFP is located in the rhabdomeres, its fluorescence can be observed in the DPP. However, rhabdomeral fluorescence disappears in the light as a result of translocation of TRPL::eGFP (Figure 11A,B). This has been used to perform a genetic screen for mutants defective in the internalization of TRPL::eGFP (Figure 11C,D)14,15. To allow isolation of potentially homozygous lethal mutations, this screen was carried out using the yeast Flp/FRT system for the generation of somatic cell clones in the developing eye tissue (i.e., mosaic eyes). Besides the simplicity of the DPP assay, other big advantages of this fluorescence detection method are its high throughput as well as its non-invasive character allowing identification of mutations in living flies and to use these flies for the generation of stable mutant fly stocks.
Figure 11: Representative results from a genetic screen on TRPL translocation defects. Male flies were mutagenized with ethyl methanesulfonate (EMS) and crossed to females expressing TRPL::eGFP in photoreceptor cells R1-6. The resulting F1-generation with homozygously mutant Flp/FRT-induced mosaic eyes was screened for defects in TRPL translocation by imaging fluorescent deep pseudopupils (DPP) after a period of dark adaptation (left column) as well as light adaptation (right column). (A,B) Non-mutated flies were carried along as control for regular light-induced TRPL translocation. The non-fluorescent DPP is indicated by an arrow. (C,D) An exemplary result of isolated mutants defective in light-triggered TRPL translocation. Scale bar: 100 µm. Please click here to view a larger version of this figure.
TRPL translocation defective (ttd) mutants that were isolated from this genetic screen have later been identified and their defects characterized in more detail with the help of water immersion imaging. Water immersion microscopy has been applied to assess the localization of proteins in the rhabdomeres and cell bodies or to track defects in the rhabdomeral structure due to photoreceptor degeneration quantitatively as outlined in the Protocol. Figure 12A,B illustrates quantification of the amount of TRPL::eGFP present in the rhabdomeres of flies with non-mutant and lolattd12 mutant mosaic eyes in the darkness, in light, and after a second dark-adaptation. In control (non-mutant) flies, TRPL::eGFP translocates out of the rhabdomeres into the cell body after 16 h of illumination resulting in a decrease of rhabdomeral TRPL::eGFP to about 45% as compared to the dark-adapted state. The second dark incubation raises the rhabdomeral fluorescence again to 95% of the initial value. The lolattd12 mutant was isolated by DPP screening due to its TRPL translocation defect. Accordingly, the TRPL::eGFP fluorescence pattern in water immersion images of rhabdomeres does not appear to change as drastically after 16 h of illumination and subsequent dark-adaption for 24 h. However, the images also reveal that lolattd12 mutants are developmentally defective, which is evidenced by the occasional absence of photoreceptor cells as described previously for other lola mutants16. These morphological defects result in an inability to measure a valid background signal, preventing a correct quantification using formula (1). In contrast, vps35MH20 is a mutant that displays a TRPL translocation defect without affecting the ommatidial morphology in this way10. In this mutant, the quantification method described here can detect a statistically highly significant recycling defect (Figure 12C,D).
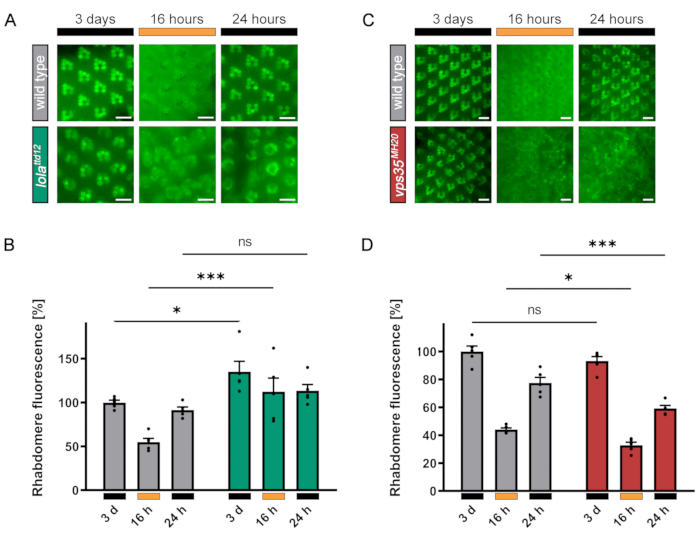
Figure 12: Representative results of a TRPL translocating defect in lola and vps35 mutant flies and limits of the quantification method. (A) TRPL::eGFP-expressing non-mutant and lolattd12 mutant mosaic-eyed flies were incubated in the dark for 3 days, illuminated with orange light for 16 h, and dark-adapted for 24 h a second time. Images of fluorescent rhabdomeres were taken by way of water immersion microscopy to record subcellular TRPL::eGFP localization as described in step 3.2.6. (B) Quantification of rhabdomeral fluorescence of non-mutant (gray) and lolattd12 mutant (green) animals as described in step 3.3.9 using formula (1). Error bars represent the SEM. (C) TRPL::eGFP-expressing non-mutant and vps35MH20 mutant mosaic-eyed flies were incubated in the dark for 3 days, illuminated with orange light for 16 h, and dark-adapted for 24 h a second time. Images of fluorescent rhabdomeres were taken by way of water immersion microscopy to record subcellular TRPL::eGFP localization as described in step 3.2.6. (D) Quantification of rhabdomeral fluorescence of non-mutant (gray) and vps35MH20 mutant (red) animals as described in step 3.3.9 using formula (1). Error bars represent SEM. Statistical significance was calculated as multiple comparisons with Bonferroni correction after ANOVA (ns, not significant; *, p ≤ 0.05; ***, p ≤ 0.001). Scale bar: 10 µm. Panels C and D have been modified from reference10. Please click here to view a larger version of this figure.
As already mentioned in the Protocol, eye pigmentation significantly influences the resulting water immersion image. White-eyed flies allow the detection of fluorescence signals from both the rhabdomere and the cell body, thus enabling a fairly precise determination of the TRPL::eGFP distribution ratio. In contrast, in red-eyed flies TRPL::eGFP signal is only detectable in the rhabdomeres but not in the cell bodies (Figure 13A). This is due to pigment molecules absorbing the emitted light from TRPL::eGFP. Nevertheless, by using formula (2) for pigmented eyes, quantification nicely reveals TRPL::eGFP translocation behavior in white- as well as red-eyed flies. Accordingly, the corresponding values of rhabdomere fluorescence decrease from 100% in the dark-adapted state to 25% and 5% after illumination and increase again to 80% and 90% as a result of a second dark incubation (Figure 13B).
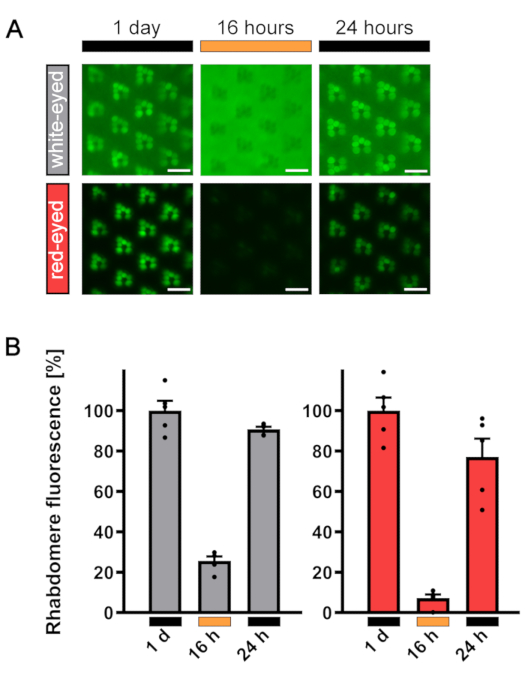
Figure 13: Representative results of TRPL::eGFP fluorescence in white- and red-eyed flies. (A) TRPL::eGFP-expressing white- and red-eyed flies were incubated in the dark for 1 day, illuminated with orange light for 16 h, and dark-adapted for 24 h a second time. Images of fluorescent rhabdomeres were taken by way of non-lethal water drop microscopy to record subcellular TRPL::eGFP localization as described in steps 3.2.6 (white-eyed flies) and 3.2.8 (red-eyed flies). (B) Quantification of rhabdomeral fluorescence in white-eyed (gray) and red-eyed (red) flies. White-eyed flies were quantified using formula (1) and red-eyed flies, using formula (2), as described in step 3.3.9. Error bars represent SEM. Scale bar: 10 µm. Please click here to view a larger version of this figure.
For assessing photoreceptor degeneration, a degeneration index based on the fluorescence of TRP::eGFP in the rhabdomeres can be determined (see Protocol). This quantification method is illustrated in Figure 10. In the representative results here, non-mutant and sdhAttd11 mutant mosaic-eyed flies were kept in a 12 h light / 12 h dark cycle for 2 weeks and the integrity of rhabdomeres was investigated every 2-4 days by observing TRP::eGFP using water immersion microscopy (Figure 14A). The resulting curve shows a decline of the degeneration index in the mutant but not in control flies (Figure 14B).
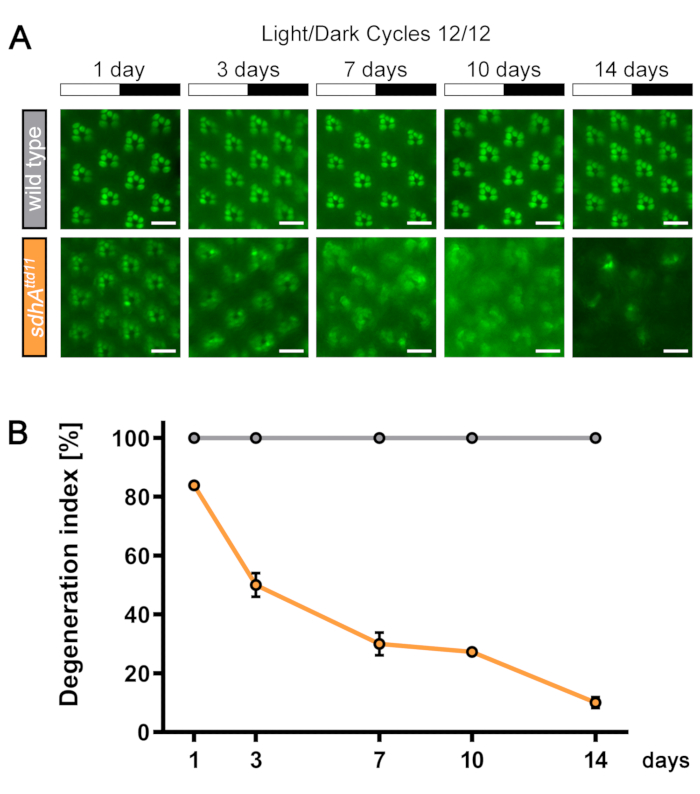
Figure 14: Representative results of light-induced retinal degeneration in sdhA mutant flies. (A) TRP::eGFP-expressing non-mutant and sdhAttd11 mutant mosaic-eyed flies were incubated for 14 days in a 12 h light / 12 h dark cycle at 25 °C. Images of fluorescent rhabdomeres were taken by way of water immersion microscopy at regular time intervals to record retinal health. (B) Quantification of rhabdomeral fluorescence of wild type (gray) and sdhAttd11 mutant (orange) flies as described in step 3.4. Error bars represent SEM. Scale bar: 10 µm. Please click here to view a larger version of this figure.
