This protocol describes the isolation of mouse preadipocytes from subcutaneous fat, their differentiation into mature adipocytes, and the induction of insulin resistance. Insulin action is evaluated by the phosphorylation/activation of members of the insulin signaling pathway through western blot. This method allows direct determination of insulin resistance/sensitivity in primary adipocytes.
Insulin resistance is a reduced effect of insulin on its target cells, usually derived from decreased insulin receptor signaling. Insulin resistance contributes to the development of type 2 diabetes (T2D) and other obesity-derived diseases of high prevalence worldwide. Therefore, understanding the mechanisms underlying insulin resistance is of great relevance. Several models have been used to study insulin resistance both in vivo and in vitro; primary adipocytes represent an attractive option to study the mechanisms of insulin resistance and identify molecules that counteract this condition and the molecular targets of insulin-sensitizing drugs. Here, we have established an insulin resistance model using primary adipocytes in culture treated with tumor necrosis factor-α (TNF-α).
Adipocyte precursor cells (APCs), isolated from collagenase-digested mouse subcutaneous adipose tissue by magnetic cell separation technology, are differentiated into primary adipocytes. Insulin resistance is then induced by treatment with TNF-α, a proinflammatory cytokine that reduces the tyrosine phosphorylation/activation of members of the insulin signaling cascade. Decreased phosphorylation of insulin receptor (IR), insulin receptor substrate (IRS-1), and protein kinase B (AKT) are quantified by western blot. This method provides an excellent tool to study the mechanisms mediating insulin resistance in adipose tissue.
Insulin is an anabolic hormone produced by pancreatic islet β-cells and the key regulator of glucose and lipid metabolism. Among its many functions, insulin regulates glucose uptake, glycogen synthesis, gluconeogenesis, protein synthesis, lipogenesis, and lipolysis1. The initial molecular signal after insulin interaction with its receptor (IR) is the activation of the intrinsic tyrosine protein kinase activity of IR2, resulting in its autophosphorylation3 and the subsequent activation of a family of proteins known as insulin receptor substrates (IRS), which binds to adaptor proteins leading to activation of a cascade of protein kinases4. Insulin activates two main signaling pathways: phosphatidylinositol 3-kinase (PI3K)-protein kinase B (AKT) and Ras-mitogen-activated protein kinase (MAPK). The former constitutes a major branch point or node4,5 for the activation of numerous downstream effectors involved in diverse physiological functions, including the regulation of fuel homeostasis, whereas the latter regulates cell growth and differentiation4,6. Insulin actions ultimately depend on the cell type and physiological context7.
One of the main insulin-responsive metabolic tissues is the adipose tissue. White adipose tissue is the most abundant type of fat in humans and rodents, distributed within subcutaneous fat (between the skin and muscles) and visceral fat (around the organs in the abdominal cavity). Given their large volume, adipocytes or fat cells are the most abundant cell type in adipose tissue. These fat cells can be brown/beige (thermogenic), pink (in the mammary gland), and white8,9. White adipocytes keep the main energy reserves in the body in the form of triglycerides, an insulin-dependent process. Insulin promotes glucose transport and lipogenesis, while it inhibits lipolysis or lipid breakdown7,10. It also facilitates the differentiation of preadipocytes into adipocytes — the mature fat-storing cells11.
Insulin resistance occurs when a normal insulin level produces an attenuated biological response, resulting in compensatory hyperinsulinemia12. Insulin resistance is a condition associated with overweight and obesity5, that when combined leads to type 2 diabetes (T2D) and other metabolic diseases13. Hyperinsulinemia compensates insulin resistance in peripheral tissues to maintain normal blood glucose levels14. However, eventual β-cell loss or exhaustion, together with exacerbated insulin resistance, leads to elevated blood glucose levels consistent with T2D5. Therefore, insulin resistance and hyperinsulinemia can contribute to the development of obesity-derived metabolic diseases15. Furthermore, obesity may cause chronic low-grade local inflammation promoting insulin resistance in adipose tissue15,16,17. In addition, obesity-derived alterations in adipose tissue, such as fibrosis, inflammation, and reduced angiogenesis and adipogenesis, lead to lower adiponectin serum levels (an insulin sensitizer) and increased secretion of factors such as plasminogen activator inhibitor 1 (PAI-1), free fatty acids, and exosomes into the bloodstream, exacerbating insulin resistance17.
Many aspects underlying insulin resistance remain unknown. In vitro and in vivo models have been developed to study the mechanisms mediating insulin resistance in major target tissues, including adipose tissue. The advantage of in vitro models is that researchers have more control of the environmental conditions and can evaluate insulin resistance in specific cell types. Particularly, adipocyte precursor cells (APCs) have the individual phenotype of the donor tissue, which might reflect physiology better than adipocyte cell lines. A main factor inducing insulin resistance in vitro is tumor necrosis factor-α (TNF-α). TNF-α is a proinflammatory cytokine secreted by adipocytes and macrophages in adipose tissue18. While it is required for proper adipose tissue remodeling and expansion19, long-term exposure to TNF-α induces insulin resistance in adipose tissue in vivo and in adipocytes in vitro20. Chronic TNF-α treatment of several cell types leads to increased serine phosphorylation of both IR and IRS-1, thereby promoting decreased tyrosine phosphorylation21. Increased phosphorylation of IRS-1 on serine residues inhibits the IR tyrosine kinase activity and may be one of the key mechanisms by which chronic TNF-α treatment impairs insulin action22,23. TNF-α activates pathways involving the serine/threonine kinase inhibitor of nuclear factor ĸB kinase β (IKKβ) and c-Jun N terminal kinase (JNK)24. JNK induces a complex proinflammatory transcriptional program but also directly phosphorylates IRS-16.
Understanding the pathogenesis of insulin resistance has become increasingly important to guide the development of future therapies against T2D. APCs have proven to be an excellent model for the study of fat cell biology, including the sensitivity and resistance to insulin, and for identifying the intrinsic properties of adipocytes independent of the systemic environment. APCs can be easily obtained from different adipose depots, and under the appropriate conditions, differentiated into mature adipocytes. With this method, direct effects on insulin resistance/sensitivity can be evaluated in adipocytes.
All rodent experiments were approved by the Bioethics Committee of the Institute of Neurobiology of the UNAM, protocol number 075.
1. Isolation of mouse adipocyte precursor cells
2. Adipocyte differentiation and induction of insulin resistance
NOTE: Maintain cells at 37 °C in 5% CO2 and perform steps involving change of medium and treatments with TNF-α and insulin inside a sterile hood.
3. Evaluation of insulin signaling pathway by western blot
Over the last few years, the increased prevalence of obesity and T2D has prompted an intense search for the mechanisms mediating insulin resistance in adipose tissue. With the protocol described here, APCs can be differentiated into mature adipocytes to evaluate insulin resistance and sensitivity. Once the APCs reach confluence, it takes 10 days to complete their differentiation into mature adipocytes and their TNF-α-mediated induction of insulin resistance (Figure 1).
APCs show a fibroblast-like morphology, characterized by their flat and elongated shape and their adhesion to the plate completed 48 h after seeding (Figure 2A). APCs take 2-5 days to reach 80% confluence (depending on the number of seeded cells), a time at which the differentiation process is started by exposure to the differentiating cocktail (Figure 2A). Mature adipocytes begin to appear in the following 6-8 days. Differentiated adipocytes are characterized by a round morphology and the intracellular accumulation of lipid droplets. Up to 80% of cells are differentiated at the end of the differentiation process (Figure 2B).
Insulin resistance is induced in primary adipocytes by TNF-α treatment (4 ng/mL) for 48 h; this concentration of TNF-α does not alter cell viability (Supplementary Figure S3). Subsequently, the insulin signaling pathway is activated by adding 100 nM insulin for 15 min, and the phosphorylation of main signaling molecules (IR, IRS-1, and AKT) is measured by western blot. Insulin stimulates the phosphorylation of these three molecules (Figure 3) compared to control, non-treated differentiated adipocytes. TNF-α reduces the insulin-induced phosphorylation of IR (30%), IRS-1 (20%), and AKT (45%) (Figure 3). Insulin-resistant cells show less activation of the insulin signaling pathway compared to insulin-sensitive cells. Moreover, TNF-α treatment decreases the mRNA expression of known insulin-sensitivity markers: Insr, Irs2, Glut4, and Adipoq (Supplementary Figure S4). These findings confirm that TNF-α reduces the action of insulin in primary adipocytes, and thereby induces insulin resistance.
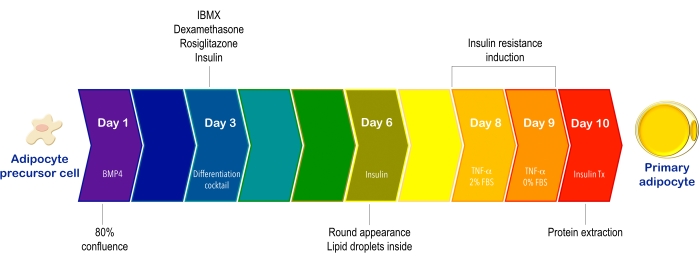
Figure 1: Schematic timeline representing the process of adipocyte precursor cell differentiation and the induction of insulin resistance. APCs are isolated from subcutaneous adipose tissue using collagenase treatment and magnetic cell separation technology. Then, they undergo a 7 day differentiation process to obtain primary adipocytes. Subsequently, insulin resistance is induced with TNF-α for 48 h, the first 24 h in medium containing 2% FBS and the next 24 h with serum-free medium to prevent the activation of the insulin signaling pathway. The signaling cascade is activated with insulin and protein is extracted for western blot analysis 10 days after starting the differentiation process to evaluate the phosphorylation/activation of IR, IRS-1, and AKT. Abbreviations: APCs = adipocyte precursor cells; BMP4 = Bone morphogenetic protein; IBMX = 3-isobutyl-1-methylxanthine; TNF-α = tumor necrosis factor-α; FBS = fetal bovine serum; IR = insulin receptor; IRS = insulin receptor substrate; AKT = protein kinase B; Tx = treatment. Please click here to view a larger version of this figure.
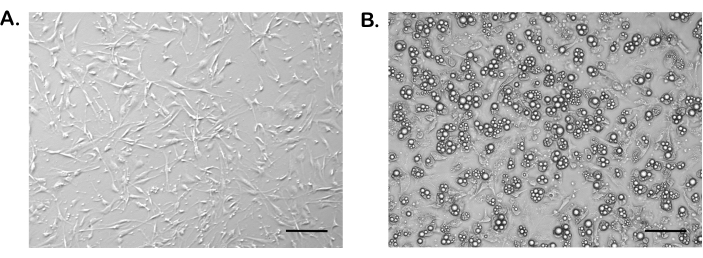
Figure 2: Morphology of adipocyte precursor cells and mature adipocytes. (A) Subcutaneous APCs at 80% confluence prior to inducing differentiation in 12-well culture plates. (B) Subcutaneous primary adipocytes after 7 days of inducing differentiation in 12-well culture plates. Images were taken at 10x magnification. Scale bars = 100 µm. Abbreviation: APCs = adipocyte precursor cells. Please click here to view a larger version of this figure.
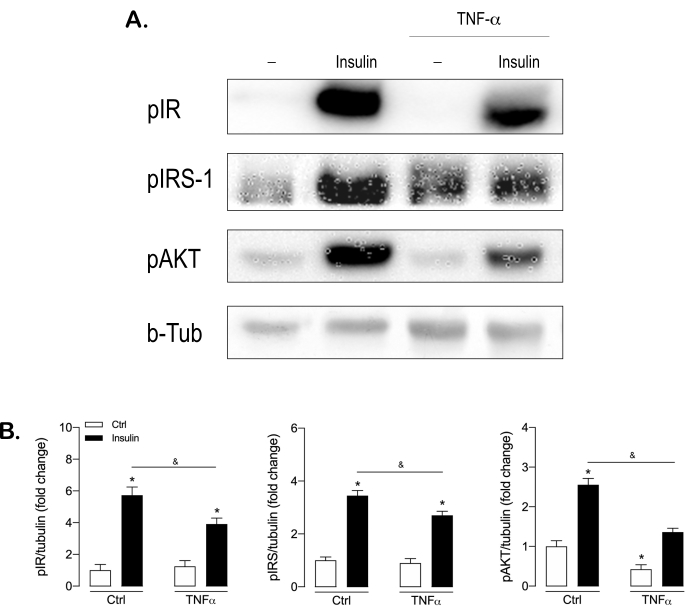
Figure 3: Insulin resistance induced by TNF-α in subcutaneous primary adipocytes demonstrated by decreased insulin-induced phosphorylation of IR, IRS-1, and AKT. Subcutaneous adipocytes were treated with TNF-α (4 ng/mL) for 48 h and serum-starved for the last 24 h. Following the stimulation with insulin (100 nM) for 15 min, 40 µg of total protein was loaded on 7.5% gels and subjected to SDS-PAGE, transferred to nitrocellulose membranes, and blocked in 4% non-fat milk in TBS-T 0.1%. The membrane was probed with anti-phosphorylated IR (pIR), anti-phosphorylated IRS-1 (pIRS-1), and anti-phosphorylated AKT (pAKT), as well as with an anti-rabbit HRP secondary antibody. The signal was visualized with chemiluminescence detection and anti-β tubulin was used as a loading control. (A) Representative blots and (B) quantification from three independent experiments. Data are mean ± SEM; *, p < .05 versus control. Abbreviations: TNF-α = tumor necrosis factor-α; IR = insulin receptor; IRS = insulin receptor substrate; pX = phosphorylated form of X; b-Tub = beta-tubulin; HRP = horseradish peroxidase; Ctrl = control. Please click here to view a larger version of this figure.
Anti-Fc solution | purified rat anti-mouse CD16 / CD32 diluted in PBS–2% FBS [1:150] | |||
TBS-T 0.1% | 0.01 M Tris-HCl (pH 8), 0.15 M NaCl, 0.1% Tween 20 | |||
Blocking solution | 4% nonfat dry milk diluted in TBS-T 0.1% | |||
Growth medium | 60% DMEM low glucose, 40% MCDB 201 medium, 1x penicillin-streptomycin, 1 nM dexamethasone, 0.1 mM L-ascorbic acid 2-phosphate, 1x insulin, transferrin, sodium, selenite (ITS) liquid media supplement, 1x linoleic acid-albumin from BSA, 10% FBS, 10 ng/mL epidermal growth factor (EGF), 10 ng/mL leukemia inhibitory factor (LIF), 10 ng/mL platelet-derived growth factor BB (PDGF-BB), 5 ng/mL fibroblast growth factor-basic (bFGF), and 50 µg/mL normocin | |||
Differentiation medium | 60% DMEM low glucose, 40% MCDB 201 medium, 1x penicillin-streptomycin, 1 nM dexamethasone, 0.1 mM L-ascorbic acid 2-phosphate, 1x ITS liquid media supplement, 1x linoleic acid-albumin from BSA, and 2% FBS | |||
Differentiation cocktail | 0.5 µM 3-isobutyl-1-methylxanthine [IBMX], 1 µM dexamethasone, 10 µM rosiglitazone, and 100 nM insulin | |||
Simple medium-2% FBS | 60% DMEM low glucose, 40% MCDB 201 medium, 1x penicillin-streptomycin, and 2% FBS | |||
Simple medium–0% FBS | 60% DMEM low glucose, 40% MCDB 201 medium, 1x penicillin-streptomycin | |||
RIPA buffer | 50 mM Tris-HCl, 1 mM EGTA, 1 mM EDTA, 1% octylphenoxy poly(ethyleneoxy)ethanol, 1 mM Na3VO4, 48.8 mM NaF, 8.2 mM Na4P2O7, and 0.26 M saccharose | |||
6x Laemmli buffer | 1.2 g SDS, 6 mg bromophenol blue, 4.7 mL glycerol, 1.2 mL Tris base 0.5 M pH 6.8, 845 µL 2- mercaptoethanol, and 2.1 mL H2O | |||
Running buffer | 25 mM Tris base, 192 mM glycine, 1% SDS | |||
Transfer buffer | 25 mM Tris-base, 192 mM glycine, 20% methanol |
Table 1: Solutions used in this protocol.
Supplementary Figure S1: Subcutaneous adipose tissue digested with collagenase. Once the adipose tissue is removed, it is cut into small pieces with scissors to start the digestion process (A), then it is incubated for 30 min with collagenase type 1 at 37 °C, 150 rpm (B). Please click here to download this File.
Supplementary Figure S2: Scheme of the adipocyte precursor cell isolation process. Dissect the inguinal subcutaneous adipose tissue and digest the samples with collagenase. Eliminate mature adipocytes by centrifugation and wash the pellet to remove excess fat. Lyse the red blood cells and block to reduce nonspecific binding. Label the endothelial cells and macrophages with antibodies coupled to magnetic particles. Perform the magnetic separation of cells using the negative separation strategy with a magnetic cell separator. Seed APCs (unlabeled cells) in plates covered with basement membrane matrix. Change the medium every 48 h until the cells reach 80% confluence. Abbreviations: APCs = adipocyte precursor cells; BSA = bovine serum albumin; FBS = fetal bovine serum. Created with Biorender.com. Please click here to download this File.
Supplementary Figure S3: Treatment with TNF-α to induce insulin resistance does not alter the viability of adipocytes. The viability of mature adipocytes was measured by the MTT assay after treatment with 4 ng/mL of TNF-α for 48 h. Data are mean ± SEM. Abbreviations: TNF-α = tumor necrosis factor-α; Ctrl = control. Please click here to download this File.
Supplementary Figure S4: TNF-α treatment in adipocytes decreases the expression of insulin sensitivity markers. The mRNA expression of Insr, Irs, Glut4, and Adipoq was measured by real-time PCR after treatment with 4 ng/mL of TNF-α for 48 h. Data are mean ± SEM; *, p < .05 versus control. Abbreviations: TNF-α = tumor necrosis factor-α; Ctrl = control. Please click here to download this File.
This paper provides a method for studying insulin resistance that uses primary adipocytes in culture treated with TNF-α. This model has the advantage that primary adipocytes can be cultured under defined conditions for long periods of time with a tight control of cellular environmental factors26. The assay duration is 15-20 days, although variations in the percentage of differentiated adipocytes can occur between experiments. Primary adipocytes have advantages over cell lines since they have not been continuously expanded in culture and more closely capture the diversity of the tissue from which they are derived27. Furthermore, primary adipocytes allow studying donors under different physio-pathological contexts, such as lean versus obese, male versus female, young versus old, and cells from different fat depots. Another advantage of this method is that cell lines from CRE and knockout mice can be generated after APCs isolation.
One possible problem during APCs isolation and differentiation is that these cells may lose the ability to differentiate, which would likely occur when 80% confluence is exceeded at the start of the differentiation process. The medium should also be changed very gently, especially after lipid accumulation, since differentiated adipocytes easily detach from the culture dish. Moreover, each lot of collagenase must be tested for digestion efficiency, cell yield, and cytotoxicity26. Techniques have been developed to identify and isolate APCs from the stromovascular fraction of white adipose tissue, using negative markers such as CD31 and CD45, as well as positive stem cell population markers such as CD34 and Sca128,29. In this protocol, we only perform a negative separation, eliminating endothelial cells and macrophages from the stromovascular fraction, thus avoiding the loss of preadipocytes in the positive separation.
Although primary cultures allow the study of donor variability and complexity27,30, setting the experimental model introduces limitations. For example, adipocytes isolated from old animals will have a lower differentiation capacity and a higher rate of lipotoxicity compared to those from young animals31,32. The protocol could also be adapted to use different cell separation techniques. If an automatic magnetic cell separator is not available, manual separation of the cells can be achieved with columns or FACS sorting. The method described here for APCs isolation using a magnetic cell separator is an adapted and simplified version of the FACS sorting protocol described by Macotela et al.28.
Several inflammatory cytokines have been used to induce insulin resistance in fat cells, including TNF-α, IL-1β, and IL-618,33,34,35,36. Cultured 3T3-L1 adipocytes exposed to TNF-α become insulin-resistant within several days, as assessed by the reduced ability of insulin to stimulate glucose uptake37. These results show that TNF-α decreases insulin-induced phosphorylation of IR, IRS-1, and AKT21,23, measured by the western blot detection of total protein extracted from primary adipocytes. However, proteases and phosphatases released during cell lysis could influence western blot detection. The active state of proteins should be preserved by the addition of protease and phosphatase inhibitors to the lysis buffer and after protein quantification, by mixing the sample with Laemmli buffer. In conclusion, this method provides a useful tool to study the mechanisms mediating insulin resistance in adipocytes differentiated from mouse APCs.
The authors have nothing to disclose.
We thank Daniel Mondragón, Antonio Prado, Fernando López-Barrera, Martín García-Servín, Alejandra Castilla, and María Antonieta Carbajo for their technical assistance, and Jessica Gonzalez Norris for critically editing the manuscript. This protocol was supported by Consejo Nacional de Ciencia y Tecnología de México (CONACYT), Fondo Sectorial de Investigación para la Educación Grant 284771 (to Y.M.).
1. Isolation mouse adipocyte precursor cells | |||
ACK lysing buffer | LONZA | 10-548E | |
Anti-Biotin Microbeads | Miltenyi | 130-090-485 | |
Anti-CD31 | eBioscience | 13-0311-85 | |
AutoMACS Pro Separator | Miltenyi | ||
Basement membrane matrix (matrigel) | Corning | 354234 | |
bFGF | Sigma | F0291 | Growth factor |
BSA | Equitech-Bio, Inc. | BAC63-1000 | |
CD45 Monoclonal Antibody (30-F11) – Biotin | eBioscience | 13-0451-85 | |
Collagenase, Type 1 | Worthington Biochem | LS004197 | |
Dexamethasone | Sigma | D1756 | |
DMEM | GIBCO | 12800017 | |
DMEM low glucose | GIBCO | 31600-034 | |
EGF | Peprotech | 315-09 | Growth factor |
FBS | GIBCO | 26140-079 | |
ITS mix | Sigma | I3146 | |
L-ascorbic acid 2-phosphate | Sigma | A8960 | |
LIF | Millipore | ESG1107 | Growth factor |
Linoleic acid-albumin | Sigma | L9530 | |
MCDB 201 medium | Sigma | M6770 | |
Normocin | InvivoGen | ant-nr-2 | |
PDGF-BB | Peprotech | 315-18 | Growth factor |
Peniciline-Streptomycine | BioWest | L0022-100 | |
Pre-Separation Filters (70 µm) | Miltenyi | 130-095-823 | |
Purified Rat Anti-Mouse CD16 / CD32 | BD Pharmingen | 553142 | |
Trypsin-EDTA | GIBCO | 25300062 | |
2. Adipocyte differentiation and insulin resistance induction | |||
3-Isobutyl-1-methylxanthine [IBMX] | Sigma | I5879 | Differentiation cocktail |
BMP4 | R&D Systems | 5020-BP-010 | Differentiation cocktail |
Dexamethasone | Sigma | D1756 | Differentiation cocktail |
Insulin | Sigma | I9278 | |
Rosiglitazone | Cayman | 71742 | Differentiation cocktail |
TNFα | R&D Systems | 210-TA-005 | |
3. Evaluation of insulin signaling pathway by western blot | |||
Anti-beta tubulin antibody | Abcam | ab6046 | |
Bromophenol blue | BioRad | 161-0404 | Laemmli buffer |
EDTA | Sigma | E5134 | RIPA buffer |
EGTA | Sigma | E4378 | RIPA buffer |
FluorChem E system | ProteinSimple | ||
Glycerol | Sigma | G6279 | Laemmli buffer |
Glycine | Sigma | G7126 | Running and Transfer buffer |
Igepal | Sigma | I3021 | RIPA buffer |
2- mercaptoethanol | Sigma | M3148 | Laemmli buffer |
Methanol | JT Baker | 907007 | Transfer buffer |
NaCl | JT Baker | 3624-05 | TBS-T |
NaF | Sigma | 77F-0379 | RIPA buffer |
NaOH | JT Baker | 3722-19 | |
Na4P2O7 | Sigma | 114F-0762 | RIPA buffer |
Na3VO4 | Sigma | S6508 | RIPA buffer |
Nitrocellulose membrane | BioRad | 1620112 | |
Nonfat dry milk | BioRad | 1706404 | Blocking solution |
Prestained protein standard | BioRad | 1610395 | |
Protease inhibitor cocktail | Sigma | P8340-5ML | |
Peroxidase AffiniPure Donkey Anti-Rabbit IgG (H+L) | Jackson ImmunoResearch | 711-035-132 | |
Phospho- Insulin Receptor β | Cell signaling | 3024 | |
Phospho-Akt (Ser473) Antibody | Cell signaling | 9271 | |
Phospho-IRS1 (Tyr608) antibody | Millipore | 9432 | |
Saccharose | JT Baker | 407205 | RIPA buffer |
SDS | BioRad | 1610302 | Running and laemmli buffer |
SuperSignal West Pico PLUS Chemiluminescent Substrate | Thermo Scientific | 34577 | |
Tris-base | Promega | H5135 | Running, transfer and laemmli buffer |
Tris-HCl | JT Baker | 4103-02 | RIPA buffer – TBS |
Tween 20 | Sigma | P1379 | TBS-T |