In this study, the processing technology of TBC processed with highland barley wine was optimized with a Box-Behnken design combined with the entropy method. DDA and MDA content were used as evaluation indicators, and the weight coefficient of each evaluation index was determined by the entropy method.
1. Experimental preparation
- Prepare highland barley wine15.
- Take 500.00 g of black highland barley rice and add five times the amount of water. Cook the rice until the remaining water is absorbed (~2 h). Pour it out, wait until the temperature falls to 37 °C, add 4 g of Jiuqu (see Table of Materials), mix well, seal the can, wrap the container with cotton wool, and let it stew for 7 days.
- Add 300 mL of water on the 7th day and seal again. On the 8th day, begin removing the wine and replace with 300 mL of water afterward. Seal and ferment for 1 day, take the wine, and add 300 mL of water again. Repeat this procedure three times and combine the liquors.
- Bring to a boil, then reduce the heat to a simmer, and continue cooking until the remaining water is absorbed.
- To prepare processed products, accurately weigh the TBC in a container, add highland barley wine, and soak for 1 day. Then, dry in a constant temperature electric drying oven.
NOTE: The drying temperature should be less than 40 °C to avoid changes in the alkaloid composition. - Prepare test sample solution.
- Accurately weigh TBC processed product powder (2 g) in a conical flask, add 40% ammonia solution, and perform ultrasound-assisted extraction with isopropanol-ethyl acetate (1:1) mixed solvents (50 mL) (power: 200 W; frequency: 40 kHz; temperature: 40 °C) for 30 min.
NOTE: To prepare 40% ammonia solution, transfer 40 mL of ammonia to a 100 mL volumetric flask and then dilute with pure water. - Adjust the extracted solution to the original weight by adding an isopropanol-ethyl acetate mixture (1:1 v/v).
- Accurately transfer the extracted solution (25 mL) to a round-bottom flask for the recovery of the solvent under reduced pressure until dry.
- Finally, transfer 0.05% hydrochloric acid-methanol solution to dissolve the residue from step 1.3.3 in a 5 mL volumetric flask and dilute with 0.05% methanol hydrochloride solution. Filter the solution through a 0.22 µm microporous membrane filter prior to injection into the high-performance liquid chromatography (HPLC) systems.
NOTE: Prepare 0.05% methanol hydrochloride acid by adding 0.05 mL of hydrochloric acid to a 100 mL volumetric flask, then dilute with methanol.
- Accurately weigh TBC processed product powder (2 g) in a conical flask, add 40% ammonia solution, and perform ultrasound-assisted extraction with isopropanol-ethyl acetate (1:1) mixed solvents (50 mL) (power: 200 W; frequency: 40 kHz; temperature: 40 °C) for 30 min.
- Prepare a standard solution by weighing 5.18 mg of benzoylaconine, 13.13 mg of aconitine, 10.05 mg of 3-deoxyaconitine, and 10.09 mg of 3-acetylaconitine accurately, and then place the solids in a 5 mL volumetric flask individually. Dilute with 0.05% methanol hydrochloride solution.
2. Chromatographic condition
- Set up the chromatographic conditions as shown in Table 1 for HPLC. Details of the instruments used are provided in the Table of Materials.
3. System adaptability test
- Range of linearity
NOTE: First, we used HPLC to determine the peak areas of benzoylaconitine, aconitine, 3-deoxyaconitine, and 3-acetylaconitine in the sample, and then randomly determined the peak area of one known concentration of standard solution. Next, we compared the difference between two peak areas (sample solution and standard solution) to estimate the concentration of benzoylaconitine, aconitine, 3-deoxyaconitine, and 3-acetylaconitine in different samples, and then adjusted the standard solution into a linear range to include the concentration of the sample in the curve. The standard curve concentrations are shown in Table 2.- Prepare benzoylaconitine reference solutions containing 1.036 mg/mL, 0.518 mg/mL, 0.2072 mg/mL, 0.1036 mg/mL, and 0.0518 mg/mL.
- Prepare aconitine reference solutions containing 1.313 mg/mL, 0.5252 mg/mL, 0.2626 mg/mL, 0.1313 mg/mL, and 0.05252 mg/mL.
- Prepare 3-deoxyaconitine reference solutions containing 1.005 mg/mL, 0.5025 mg/mL, 0.201 mg/mL, 0.1005 mg/mL, and 0.402 mg/mL.
- Prepare 3-acetylaconitine reference solutions containing 0.2018 mg/mL, 0.1009 mg/mL, 0.04036 mg/mL, 0.02018 mg/mL, and 0.01009 mg/mL.
- Investigate the linearity of each compound by plotting the peak area versus injection concentration.
- To perform the precision test, inject 10 µL of each reference solution into the HPLC system six times daily and employ the same HPLC conditions described in step 2.1 to run the samples Record the peak area of each component.
- Perform intraday stability testing by injecting 10 µL of the prepared sample solution via step 1.3 and determine the peak areas after 0 h, 2 h, 4 h, 8 h, 14 h, 12 h, and 24 h16.
- Perform a reproducibility test by taking six samples of the same batch of TBC to prepare the test sample solution, according to step 1.3. Inject 10 µL of each sample into the HPLC system and run the samples as described in step 2.1.
- Perform the recovery test to evaluate the accuracy of the method. Add 100% of the standard solution of each index component (benzoylaconitine, aconitine, 3-deoxyaconitine, and 3-acetylaconitine) in the test solution to calculate the recovery rate, respectively. For example, as the content of benzoylaconitine is 0.1524 mg/mL in the TBC sample, accurately weigh 0.1524 mg of benzoylaconitine standards and add to the TBC sample, then prepare the test sample solution according to step 1.3. Run these samples with the same HPLC conditions described in step 2.1. Calculate the recovery rate using Equation (1):
 (1)
(1)
Here, A is the amount of component (benzoylaconitine, aconitine, 3-deoxyaconitine, or 3-acetylaconitine) to be measured in the sample solution, B is the amount of standard added (benzoylaconitine, aconitine, 3-deoxyaconitine, or 3-acetylaconitine), and C is the measured value of the solution containing the standard solution and the sample solution (see Table 3). Refer to step 2.1 for the chromatographic conditions to perform the above steps. The recovery rate reflects the degree of loss of the target component (benzoylaconitine, aconitine, 3-deoxyaconitine, or 3-acetylaconitine) during the sample analysis; the higher the recovery rate, the lower the loss of the target component.
4. Single factor test of TBC processed with highland barley wine
NOTE: The ratio between highland barley wine and TBC, slice thickness of TBC, and soaking time will affect the dissolution of more toxic components (aconitine, 3-deoxyaconitine, and 3-acetylaconitine) in TBC during the TBC processed with highland barley wine17. The single factor test and Box-Behnken design were used to investigate the influence of the ratio of highland barley wine to TBC, slice thickness of TBC, and soaking time.
- Perform the highland barley wine addition test (A) by setting up five groups of tests, each with 30 g of TBC, where the amount of highland barley wine is two, three, four, five, and six times the amount of TBC in the recipe. The soaking time is 12 h, and the slices are 1.0 cm thick18.
NOTE: Each group of the same condition test should be processed in three parallel groups. - Perform the soaking time test (B) by setting up five groups of tests, each with 30 g of TBC. The soaking times are 12 h, 24 h, 36 h, and 48 h. The amount of highland barley wine is five times that of TBC, and the slices are 1.0 cm thick19.
NOTE: Each group of the same condition experiment should be processed in three parallel groups. - Perform the slicing thickness test (C) by setting up five groups of tests, each with 30 g of TBC. The slices are 0.5, 1.0, 1.5, 2.0, and 2.5 cm thick, the soaking time is 24 h, and the amount of highland barley wine is five times that of TBC20.
NOTE: Each group of the same condition experiment should be processed in three parallel groups. - Accurately weigh processed products for each test group to prepare test sample solution according to step 1.3. Determine the peak area of each sample by HPLC and use the standard curve to estimate the amounts of MDAs and DDAs. In the standard curve, y is the peak area and x is the content. The content of MDAs is benzoyl aconitine, and the content of DDAs is the sum of aconitine, 3-deoxyaconitine, and 3-acetylaconitine.
- Use the total content of DDAs and the content of MDAs as evaluation indicators, and determine the weight coefficient of each evaluation index and the comprehensive scoring via the entropy method (section 5).
CAUTION: TBC is toxic, and thus protective measures should be taken during processing.
5. Entropy method to calculate the comprehensive scoring
NOTE: We use the experimental data of the slicing thickness test in the single factor test as an example to illustrate the calculation process in detail. We use the peak area of the components in each sample in Supplementary Table S1 and the standard curve in Table 2 to calculate the content of MDAs and DDAs (see Supplementary Table S2). In the linear equation, y is the peak area and x is the content. In this study, the moderately toxic MDA (benzoylaconitine) was used as the positive indicator, and the total content of DDAs (aconitine, 3-deoxyaconitine, and 3-acetylaconitine) with high toxicity was used as the negative indicator. The content of MDAs is benzoyl aconitine, and the content of DDAs is the sum of aconitine, 3-deoxyaconitine, and 3-acetylaconitine. Each sample has two evaluation indicators: i = 1,2,…,n, and j = 1,2,…m21.
- Use Equation (2) to standardize the content of MDAs22.
 (2)
(2)
Thus,
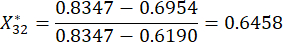
NOTE: Xij is the value of the j-th indicator of the i-th sample. Xij* is the standardized value of Xij. For example, i = 3 and j = 1, X31 represents the value of the first indicator of the third sample, and is the standardized value of the first indicator in the third sample.
  are shown in Supplementary Table S3.
 - Use Equation (3) to standardize the total content of the DDAs23.
 (3)
(3)
NOTE: Here, i = 3, j = 2, represents the second indicator of the third sample. is the standardized value of the second indicator in the third sample.
  are shown in Supplementary Table S3.
 - Use Equations (4) and (5) to define the entropy value (Hj) of each indicator23.
- Calculate the probability of the j-th trial under the i-th evaluation indicator Pij using equation (4).
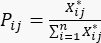 (4)
(4)
For number 3,
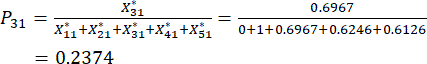
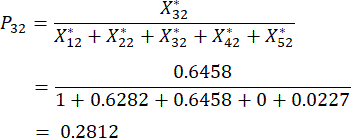
NOTE: The probability values for the first indicator and second indicator of the third sample are 0.2374 and 0.2812, respectively. are shown in Supplementary Table S3.
 - Calculate the information entropy Hj.
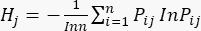 (5)
(5)
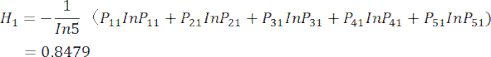
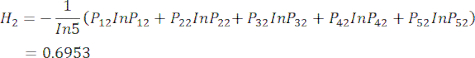
NOTE: H1 is the entropy of the first indicator (MDAs) and H2 is the entropy of the second indicator (DDAs) in the slicing thickness test.
- Calculate the probability of the j-th trial under the i-th evaluation indicator Pij using equation (4).
- Use Equation (6) to calculate the indicator weights (Wj)23.
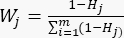 (6)
(6)
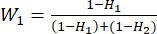 = 33.3%
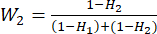 = 66.7%
NOTE: Wj is the weight coefficient of each indicator. In the slicing thickness test, the weight coefficient of the positive indicator (MDAs) and negative indicator (DDAs) are 33.3% and 66.7%, respectively. - Use Equation (7) to calculate the comprehensive scoring of the indicators23.
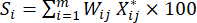 (7)
(7)
For number 3,

NOTE: Si is the comprehensive scoring of each sample. We need to obtain the highest score as the central point in the Box-Behnken design. S1, S2, S3, S4, and S5 are show in Supplementary Table S3.
6. Box-Behnken design
- Through the single factor test, use the condition with the highest comprehensive scoring (see Table 4, Table 5, Table 6, and Figure 2) as the center point of the response surface. Use the amount of highland barley wine (A), soaking time (B), and slice thickness of TBC (C) as the influencing factors and the comprehensive scoring as the response value24.
NOTE: Based on the single factor data in Table 4, Table 5, and Table 6, the highest comprehensive scoring is calculated by equations (2), (3), (4), (5), (6), and (7) in section 5, and the best point is obtained. The amount of highland barley wine was five times that of TBC, the soaking time was 36 h, and the slicing thickness was 1.0 cm.
7. Box-Behnken design software operation steps
- Open the software (see Table of Materials) and select New Design | Box-Behnken Design (see step 5.1; Supplementary File 1).
- Input the number of influencing factors and input the level information (three-level-three-factor; see Table 7). The Box-Behnken design is composed of 17 experiments in this study. Finally, click 계속 (see step 5.2; Supplementary File 1).
- Set the comprehensive scoring (Y) by equations (2), (3), (4), (5), (6), and (7) in section 5 as the response. Input the number of response values (image shows only one response value) and click Finish (see step 5.3; Supplementary File 1).
- Process the TBC with highland barley wine according to the design results and complete the experiment based on the 17 scenarios designed for the response surface.
- Prepare the sample solutions by following step 1.3 and calculate the total content of the MDAs and DDAs by the HPLC system.
- Calculate the comprehensive scoring for each group by equations (2), (3), (4), (5), (6), and (7) in step 5, and input the score results (see step 5.4; Supplementary File 1).
- Click analyze to analyze the date and model information (see step 5.4.1; Supplementary File 1).
- Perform statistical validation of polynomial equations and response surface analysis plotted in 3D model plots obtained by the software.
- Click on ANOVA in the top menu and observe the results table.
- Click Optimization to view the predicted optimal process conditions (see step 5.4.2; Supplementary File 1).
8. Validation test
- According to the results predicted from the Box-Behnken response surface design, in step 7.3, identify the optimal processing condition of TBC. Here, it is as follows: TBC is soaked for 24 h in five times the amount of highland barley wine, and the thickness of the TBC is 1.5 cm. Take the optimal level of influencing factors as processing conditions and set up three parallel sets of experiments to verify the stability of the processing technology.
In this study, the precision, stability, repeatability, and sample recovery of TBC indicated that the method is feasible. The four index components in TBC had a good linear relationship within a specific concentration range. Typical chromatograms are shown in Figure 1. The precision test results (Table 8) showed that the relative standard deviation (RSD) of the peak areas were 2.56%, 1.49%, and 2.03% for benzoylaconine, aconitine, and 3-deoxyaconitine, respectively, and 0.21% for 3-acetylaconitine, indicating that the precision of the instrument was good. The study of stability performed for 24 h (n = 6) indicated relative standard deviation values of 2.76%, 2.21%, 2.98%, and 2.31% for benzoylaconine, aconitine, 3-deoxyaconitine, and 3-acetylaconitine, respectively (Table 9), suggesting that the sample solution was stable for 24 h. The repeatability test results (Table 10) showed that the RSDs of the peak areas of benzoylaconine, aconitine, 3-deoxyaconitine, and 3-deoxyaconitine were 2.80%, 2.92%, 2.92%, and 2.07%, respectively, showing that the repeatability of this method was good. The recovery experiment results indicated that the average recovery rates of benzoylaconine, aconitine, 3-deoxyaconitine, and 3-deoxyaconitine were 99.7%, 100.84%, 103.27%, and 100.92%, respectively.
The single factor test of TBC processed with highland barley wine revealed that the amount of highland barley wine was five times that of TBC, the soaking time was 36 h, and the slicing thickness was 1.0 cm (Figure 2). The experimental design and results of the response surface model are shown in Table 11. The results of the experimental ANOVA are shown in Table 12. The factors are fitted by regression to obtain a quadratic multinomial regression equation (8). A: Highland barley wine addition; B: soaking time; C: slicing thickness. The results showed that the model was well fitted and was able to predict the relationship between the comprehensive scoring of highland barley wine addition, soaking time, and slice thickness. The order of the factors by the strength of the effects was highland barley wine addition > slice thickness of medicinal herbs > soaking time.
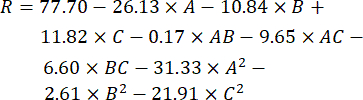 (8)
(8)
According to Equation (8), Design-Expert 8.0.6 analysis software is used to plot a 3D curve via step 7.2.1 (Figure 3). A steeper slope of the response surface indicates a stronger horizontal interaction of factors, and a gentler slope is the opposite. The p-value (p < 0.0001) of the model in Table 12 shows that the model is significant, with an R2 of 0.9754 and a non-significant misfit term (p = 0.7253), indicating that the model is a good fit and better reflects the relationship among the highland barley wine addition, soaking time, slice thickness of medicinal herbs, and overall score.
According to the objective weight of each index determined by the analytic entropy method, comprehensive scoring was performed, and the optimal processing condition of TBC was determined as follows: TBC is soaked for 24 h in five times the amount of highland barley wine, and the thickness of the TBC is 1.5 cm. The validation test results showed that the total DDAs were 0.6963, 0.6793, and 0.7023 mg/g, respectively, and the MDA content in three sets of parallel tests was 0.2096, 0.2237, and 0.2109 mg/g. The average comprehensive scoring was 83. The RSD between the verification test and the predicted value was less than 1.8%, indicating that the optimized processing technology of TBC processed with highland barley wine is simple, feasible, and stable, providing a reference for industrial production.
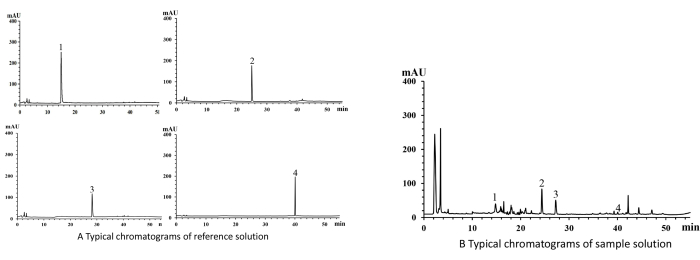
Figure 1: Representative chromatograms of the four characteristic components after setting the chromatographic conditions mentioned in step 2.1 (n = 1). (A) Typical chromatograms of the reference solution. Peak 1 is benzoylaconine, peak 2 is aconitine, peak 3 is 3-deoxyaconitine, and peak 4 is 3-acetylaconitine. (B) Typical chromatograms of the sample solution. Peak 1 is benzoylaconine, peak 2 is aconitine, peak 3 is 3-deoxyaconitine, and peak 4 is 3-acetylaconitine. Please click here to view a larger version of this figure.
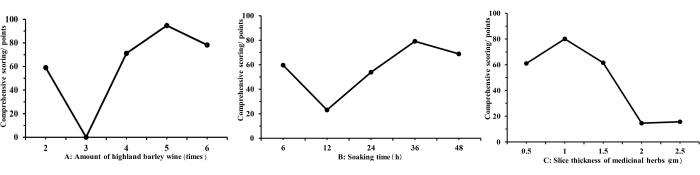
Figure 2: The comprehensive scoring of the single factor test of TBC processed with highland barley wine (n = 3). (A) Amount of highland barley wine (times); (B) Soaking time (h); (C) Slice thickness (cm). Please click here to view a larger version of this figure.
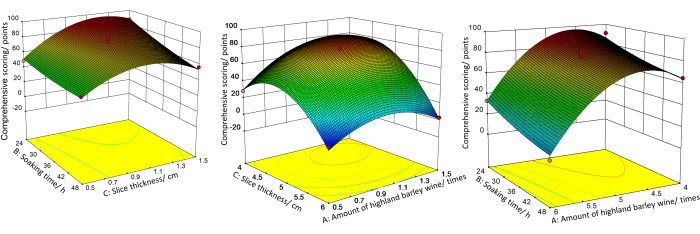
Figure 3: 3D response surface map of the effect of interaction of various factors on comprehensive scoring. Please click here to view a larger version of this figure.
| Condition | Parameter |
| Chromatographic column | Ultimate ODS-3 C18 (4.6 mm x 250 mm, 5 μm) |
| Mobile phase | Acetonitrile (A) – 0.04 mol/L ammonium acetate solution (B) pH= 8.5 ± 0.5 |
| Gradient elution | 0–10 min, 0%-70% A; 10–15 min, 70–50% A; 15–30 min, 50–40% A; 30–38min, 40–15% A; 38–45 min, 15–15% A; 45–55 min, 15–70% A |
| Flow rate | 1 mL/min |
| Column temperature | 30 °C |
| Detecting wavelength | 235 nm |
| Sample volume | 10 μL |
Table 1: The chromatographic conditions set in this experiment. Details about the chromatographic column, the mobile phase, the gradient elution, the flow rate, the column temperature, the detection wavelength, and the sample volume.
| Index components | Linear equation | Range of linearity (mg/mL) | R2 |
| Benzoylaconine | y=11,658,706.1677x +19,717.0872 | 1.036-0.0518 | 0.9995 |
| Aconitine | y=11,199,784.3030x -67,641.2429 | 1.313-0.05252 | 0.9999 |
| 3-Deoxyaconitine | y=11,214,550.3140x +59,795.9119 | 1.005-0.0402 | 0.9999 |
| 3-Acetylaconitine | y=9,887,511.9074x +26,713.6359 | 0.2018-0.01009 | 0.9994 |
Table 2: The linear relationship of the index components in TBC. The four index components in TBC had a good linear relationship in a specific concentration range.
| Index components | Known content (mg) | Adding quantity (mg) | Measuring quantity (mg) | Recoveries (%) | Average recoveries (%) | RSD (%) |
| Benzoylaconine | 0.1558 | 0.1295 | 0.2901 | 96.4 | 99.7 | 3.14 |
| 0.1574 | 0.1295 | 0.2849 | 98.46 | |||
| 0.156 | 0.1295 | 0.2871 | 101.24 | |||
| 0.1574 | 0.1295 | 0.2923 | 104.95 | |||
| 0.1449 | 0.1295 | 0.2736 | 99.38 | |||
| 0.1566 | 0.1295 | 0.2839 | 98.3 | |||
| Aconitine | 0.3099 | 0.3283 | 0.645 | 102.07 | 100.84 | 2.02 |
| 0.3153 | 0.3283 | 0.6371 | 98.02 | |||
| 0.2928 | 0.3283 | 0.6314 | 103.14 | |||
| 0.2969 | 0.3283 | 0.6325 | 102.23 | |||
| 0.3035 | 0.3283 | 0.6343 | 100.76 | |||
| 0.3094 | 0.3283 | 0.6339 | 98.84 | |||
| 3-Deoxyaconitine | 0.1789 | 0.201 | 0.3788 | 99.45 | 103.27 | 2.65 |
| 0.1793 | 0.201 | 0.3845 | 102.09 | |||
| 0.1741 | 0.201 | 0.3774 | 101.14 | |||
| 0.1635 | 0.201 | 0.3753 | 105.37 | |||
| 0.1708 | 0.201 | 0.383 | 105.57 | |||
| 0.1653 | 0.201 | 0.3783 | 105.97 | |||
| 3-Acetylaconitine | 0.0169 | 0.02 | 0.0374 | 102.5 | 100.92 | 1.15 |
| 0.0168 | 0.02 | 0.037 | 101 | |||
| 0.0166 | 0.02 | 0.0366 | 100 | |||
| 0.0161 | 0.02 | 0.0365 | 102 | |||
| 0.017 | 0.02 | 0.0369 | 99.5 | |||
| 0.0171 | 0.02 | 0.0372 | 100.5 |
Table 3: The results of the sample recovery rate measurement. The RSD of the recovery rate of benzoylaconine, aconitine, 3-deoxyaconitine, and 3-acetylaconitine were 3.14%, 2.02%, 2.65%, and 1.15%, respectively.
| Number | Highland barley wine addition test (times) | Content of MDAs (mg/g) | Content of DDAs (mg/g) | Comprehensive scoring/points |
| 1 | 2 | 0.1875 | 0.8254 | 58.98421777 |
| 2 | 3 | 0.1099 | 0.9847 | 0.056898711 |
| 3 | 4 | 0.2296 | 0.8487 | 71.12048666 |
| 4 | 5 | 0.2161 | 0.6894 | 94.6966946 |
| 5 | 6 | 0.2006 | 0.7472 | 78.22537224 |
Table 4: The results of the single factor test of the ratio between highland barley wine and TBC.
| Number | Soaking time test (h) | Content of MDAs (mg/g) | Content of DDAs (mg/g) | Comprehensive scoring/points |
| 1 | 6 | 0.236292609 | 1.047811476 | 59.67501032 |
| 2 | 12 | 0.193880685 | 1.164420534 | 23.10718817 |
| 3 | 24 | 0.229606225 | 0.848736346 | 53.86313899 |
| 4 | 36 | 0.151447388 | 0.701045217 | 79.15664943 |
| 5 | 48 | 0.193311963 | 0.767427412 | 68.88872066 |
Table 5: The results of the single factor test of the soaking time.
| Number | slicing thickness test (cm) | Content of MDAs (mg/g) | Content of DDAs (mg/g) | Comprehensive scoring/points |
| 1 | 0.5 | 0.1043 | 0.6190 | 66.96 |
| 2 | 1 | 0.1709 | 0.6992 | 75.05 |
| 3 | 1.5 | 0.1507 | 0.6954 | 66.23 |
| 4 | 2 | 0.1459 | 0.8347 | 20.66 |
| 5 | 2.5 | 0.1451 | 0.8298 | 21.79 |
Table 6: The results of the single factor test of the slice thickness of TBC.
| Level | Factor | ||
| A (amount of highland barley wine, times) | B (soaking time, h) | C (slice thickness, cm) | |
| 1.0000 | 4.0000 | 24.0000 | 0.5000 |
| 2.0000 | 5.0000 | 36.0000 | 1.0000 |
| 3.0000 | 6.0000 | 48.0000 | 1.5000 |
Table 7: Box-Behnken design response surface level factor table.
| Peak area in index components | 1 | 2 | 3 | 4 | 5 | 6 | RSD (%) |
| Benzoylaconine | 1281252 | 1290912 | 1198912 | 1256056 | 1256704 | 1266738 | 2.56% |
| Aconitine | 2861208 | 2881686 | 2785022 | 2790990 | 2859024 | 2799395 | 1.50% |
| 3-Deoxyaconitine | 2356317 | 2328383 | 2429059 | 2350987 | 2406114 | 2450374 | 2.04% |
| 3-Acetylaconitine | 2008110 | 2021560 | 2014519 | 2015881 | 2015209 | 2012529 | 0.22% |
Table 8: The results of the precision measurement. The RSD of the peak areas of benzoylaconine, aconitine, 3-deoxyaconitine, and 3-acetylaconitine were 2.56%, 1.49%, 2.03%, and 0.22%, respectively (n = 6).
| Peak area in index components | 0 | 2 | 4 | 8 | 12 | 24 | RSD (%) |
| Benzoylaconine | 191657 | 189590 | 193934 | 205135 | 196159 | 195954 | 2.76 |
| Aconitine | 312259 | 310240 | 294331 | 309104 | 312199 | 305360 | 2.22 |
| 3-Deoxyaconitine | 230174 | 246787 | 239760 | 249302 | 248806 | 243396 | 2.98 |
| 3-Acetylaconitine | 17086 | 16953 | 16826 | 16914 | 16979 | 17896 | 2.31 |
Table 9: The results of the stability test. The RSD of the peak areas of benzoylaconine, aconitine, 3-deoxyaconitine and 3-acetylaconitine were 2.76%, 2.21%, 2.98%, and 2.31%, respectively (n = 6).
| Peak area of index components | 1 | 2 | 3 | 4 | 5 | 6 | RSD (%) |
| Benzoylaconine | 191067 | 192795 | 191058 | 192907 | 179103 | 192008 | 2.79 |
| Aconitine | 308142 | 313754 | 290487 | 294740 | 301515 | 307654 | 2.92 |
| 3-Deoxyaconitine | 249021 | 249456 | 243963 | 232781 | 240524 | 234661 | 2.92 |
| 3-Acetylaconitine | 17465 | 17451 | 17247 | 16691 | 17608 | 17686 | 2.07 |
Table 10: The results of the reproducibility test. The RSD of the peak areas of benzoylaconine, aconitine, 3-deoxyaconitine, and 3-acetylaconitine were 2.79%, 2.92%, 2.92%, and 2.07%, respectively (n = 6).
| Number | A (Highland barley wine addition, times) | B (Soaking time, h) | C (Slicing thickness, cm) | Content of MDAs (mg/g) | Content of DDAs (mg/g) | Comprehensive scoring/points |
| 1 | 4 | 36 | 0.5 | 0.1032 | 0.6882 | 28.2 |
| 2 | 5 | 48 | 1.5 | 0.1688 | 0.6588 | 56.49 |
| 3 | 6 | 24 | 1 | 0.1236 | 0.6535 | 33.02 |
| 4 | 5 | 24 | 1.5 | 0.2201 | 0.692 | 87.23 |
| 5 | 5 | 36 | 1 | 0.2094 | 0.6199 | 70.71 |
| 6 | 5 | 24 | 0.5 | 0.1809 | 0.5689 | 48.56 |
| 7 | 4 | 24 | 1 | 0.2016 | 0.7744 | 90.74 |
| 8 | 5 | 36 | 1 | 0.2169 | 0.6889 | 85.15 |
| 9 | 5 | 36 | 1 | 0.2103 | 0.6802 | 80.5 |
| 10 | 6 | 36 | 0.5 | 0.1036 | 0.5072 | 0.36 |
| 11 | 6 | 36 | 1.5 | 0.1089 | 0.5062 | 2.86 |
| 12 | 4 | 48 | 1 | 0.1789 | 0.6789 | 64.6 |
| 13 | 6 | 48 | 1 | 0.1036 | 0.5536 | 7.55 |
| 14 | 5 | 36 | 1 | 0.2062 | 0.6084 | 67.33 |
| 15 | 4 | 36 | 1.5 | 0.1832 | 0.6954 | 69.31 |
| 16 | 5 | 48 | 0.5 | 0.1759 | 0.5569 | 44.21 |
| 17 | 5 | 36 | 1 | 0.2161 | 0.6894 | 84.82 |
Table 11: Design and results of the response surface design test.
| Source | Sum of Squares | df | Mean Square | F -Value | P-Value |
| Model | 14403.27 | 9 | 1600.36 | 30.8 | <0.0001 |
| A | 5463.26 | 1 | 5463.26 | 105.15 | <0.0001 |
| B | 939.61 | 1 | 939.61 | 18.08 | 0.0038 |
| C | 1117.7 | 1 | 1117.7 | 21.51 | 0.0024 |
| AB | 0.11 | 1 | 0.11 | 0.00216 | 0.9642 |
| AC | 372.68 | 1 | 372.68 | 7.17 | 0.0316 |
| BC | 174.11 | 1 | 174.11 | 3.35 | 0.1099 |
| A2 | 4133.52 | 1 | 4133.52 | 79.55 | <0.0001 |
| B2 | 28.63 | 1 | 28.63 | 0.55 | 0.482 |
| C2 | 1890.1 | 1 | 1890.1 | 36.38 | 0.0005 |
| Residual | 363.71 | 7 | 51.96 | ||
| Lack of Fit | 93.28 | 3 | 31.09 | 0.46 | 0.7253 |
| Pure Error | 270.43 | 4 | 67.61 | ||
| Cor Total | 14766.99 | 16 |
Table 12: ANOVA for the regression model.
Supplementary File 1: A detailed guide of the Box-Behnken design software. Please click here to download this File.
Supplementary Table S1: Sample peak area of the slicing thickness test by HPLC. Please click here to download this File.
Supplementary Table S2: Content of MDAs (benzoylaconine) and DDAs (aconitine, 3-deoxyaconitine, and 3-acetylaconitine) in the slicing thickness test. Please click here to download this File.
Supplementary Table S3: Comprehensive scoring of the slicing thickness test. Please click here to download this File.
