Here we demonstrate the technique of using impedance-based biosensors: ECIS and cellZscope, for measuring brain endothelial barrier strength. We detail the preparation and technique of adding various stimuli to an in vitro model of the brain endothelium. We measure, record, and give a representative analysis of the findings.
The blood-brain barrier (BBB) protects the brain parenchyma against harmful pathogens in the blood. The BBB consists of the neurovascular unit, comprising pericytes, astrocytic foot processes, and tightly adhered endothelial cells. Here, the brain endothelial cells form the first line of barrier against blood-borne pathogens. In conditions like cancer and neuroinflammation, circulating factors in the blood can disrupt this barrier. Disease progression significantly worsens post barrier disruption, which permits access to or impairment of regions of the brain. This significantly worsens the prognoses, particularly due to limited treatment options available at the level of the brain. Hence, emerging studies aim to investigate potential therapeutics that can prevent these detrimental factors in the blood from interacting with the brain endothelial cells.
The commercially available Electric Cell-Substrate Impedance Sensing (ECIS) and cellZscope instruments measure the impedance across cellular monolayers, such as the BBB endothelium, to determine their barrier strength. Here we detail the use of both biosensors in assessing brain endothelial barrier integrity upon the addition of various stimuli. Crucially, we highlight the importance of their high-throughput capability for concurrent investigation of multiple variables and biological treatments.
This article discusses current trends in the assessment of microvascular cells. We specifically detail the use of two commercially available platforms for measuring the barrier properties of cerebral microvascular endothelial cells. Endothelial cells are blood-facing cells, which line the vessel wall. However, cerebral microvessels are unique as they help form the protective blood-brain barrier (BBB)1,2,3. The BBB functions to regulate the transport of molecules from the blood to the brain. Peripheral diseases that affect the central nervous system (CNS) are commonly linked to a functional failure of the BBB4,5. The anatomical structures that form the BBB are not present at the blood-tissue interface elsewhere in the body6. These anatomical structures comprise pericytes, which are located close to brain endothelial cells, and regulate their proliferation and permeability; astrocytic foot processes, which are involved in nutrient shuffling and anatomical support7,8; microglia, which are the resident macrophages in the brain, often implicated in neuroinflammation and ischaemia9,10,11,12, and the brain endothelium, which forms a monolayer of tightly adhered cells without fenestrations13,14. The brain endothelium is typically known as the 'brain endothelial barrier' and forms a structural and functional barrier in five distinct ways. First, the paracellular barrier component is formed by adhesion at lateral cell-cell junctions. Second, the transcellular barrier component is sustained by regulating endocytosis. Third, a specialized basement membrane anchors and supports the endothelium via a rich extracellular matrix comprising largely of collagen15,16. The last two mechanisms are through enzymes and transporters that help regulate the metabolism of drugs and uptake of large molecules, respectively17.
The paracellular interactions form the major component of the brain endothelial barrier, facilitated by tight junctions (TJs), comprising membrane proteins claudins, occludin, and junctional adhesion molecules (JAMs)18. Strong homotypic binding of the membrane proteins forms the first structural barrier, though JAMs also link to accessory proteins zonula occludens, thus linking the TJs to the actin cytoskeleton19,20. The actin links place the TJs in the apical region of the endothelium21, which functionally polarizes the endothelial cells to form the structural barrier on this apical or "blood-facing" side. In the basolateral region of the endothelium, highly specialized adherens junctions (AJs) play a regulatory role in maintaining cell morphology. AJs comprise calcium-dependent cadherins, which link the cytoskeleton of neighboring endothelial cells through the catenin family complex20,22. Vascular endothelial cadherin (VE-Cadherin) is one such cadherin, which regulates the expression of TJ proteins and overall endothelial barrier function to maintain endothelial monolayer integrity23,24,25,26,27. Inflammatory modulators, such as tumor necrosis factor-alfa (TNFα), signal VE-cadherin internalization away from cell junctions, leading to destabilization of the endothelial barrier28,29,30. Platelet endothelial cell adhesion molecule (PECAM)31 is another AJ cadherin that stabilizes and remodels endothelial junctions32,33. The density of these junctional proteins restricts the flow of electrons through the paracellular space between endothelial cells. This attribute is utilized to measure endothelial barrier strength or trans-endothelial electrical resistance (TER) across confluent cell monolayers like the brain endothelium.
Therapeutic studies focus on the brain endothelium due to its vital role at the blood-brain interface. Several diseases negatively affect the brain endothelium, including neuroinflammatory conditions like multiple sclerosis, stroke, neurodegenerative diseases, and cancer34,35,36,37. Once the brain endothelial barrier is disrupted, disease progression significantly worsens as the brain is effectively exposed to the harmful stimuli in the blood38. We have previously shown that inflammatory mediators and metastatic melanoma cells disrupt the brain endothelial barrier by using two technologies that measure endothelial barrier strength39,40,41.
Electric cell-substrate impedance sensing (ECIS) is an impedance-based biosensor that permits real-time and label-free assessment of endothelial cell barrier integrity. Herein, assay wells are lined with gold-plated electrodes, which introduces alternating current (AC) to the assay system. Brain endothelial cells are seeded into these wells, which means that AC can be applied through the cells. (Figure 1A-well; side view). This establishes the electrical circuit, which is used to calculate the impedance (Figure 1A-circuit diagram). The impedance increases when the brain endothelial cells adhere to the plate and begin forming their paracellular junctions. The impedance plateaus when the endothelial cells become confluent, forming a monolayer, and restricting current flow. Application of AC at different frequencies influences the route of flow of current through the endothelial cells. Current flows through the endothelial cell body when applied at a higher frequency (>104 Hz). This provides information on the capacitance of the cell monolayer, used to assess cell attachment and spreading. At low frequencies (102-104 Hz) the membrane impedance is high, restricting current flow through the cells. In this case, the majority of the current navigates between the cells. At approximately 4,000 Hz, the resistance to current flow is attributed mostly to the endothelial cell-cell junctions, via the intercellular space.Therefore, any change in resistance at this frequency provides information regarding endothelial barrier integrity.
Whilst raw impedance measurements can provide insight into barrier properties, the ECIS software can then mathematically model the total resistance measured across multiple AC frequencies and more precisely, separate it into two key parameters of barrier integrity. These parameters are the paracellular resistance between the lateral membranes of neighboring cells (resistance beta-Rb; paracellular barrier; Figure 1A-green arrows), and the basolateral resistance between the basal cell layer and the electrode (resistance alpha-Alpha; basolateral barrier; Figure 1A-blue arrows). A third modeled parameter is also measured as the cell membrane capacitance (Cm; Figure 1A-red arrows). The Cm displays the capacitive flow of current through the cells, indicative of cell membrane composition. Herein, changes in the Rb or paracellular barrier indicate alterations in the TJs and AJs, crucial in maintaining endothelial barrier integrity. To reliably interpret the Rb, four key assumptions are made, as developed by Giaever and Keese42 and critically discussed by Stolwijk et al.43. Although these assumptions are important for ensuring the validity of ECIS modeling, they are readily met by a confluent endothelial monolayer.
Like ECIS, the cellZscope permits the measurement of changes in endothelial barrier resistance; however, the cells are cultured on a porous membrane insert. In this system, the electrical circuit is between two electrodes on either side of a membrane insert. The endothelial monolayer is cultured on top of this membrane insert, allowing for measurement of trans-endothelial electrical resistance (TER) (Figure 1B-well; side view). As with ECIS, in this system, the total impedance can be attributed to several barrier components, dependent on the frequency of current applied44. At low frequencies, electrode capacitance (CEl) dominates the total impedance of the system. Alternatively, at high frequencies, the resistance of the media (Rmedium) dominates the total impedance. Hence, the most useful measurements fall within the midfrequency range (102-104 Hz), which provides information regarding two key components of the endothelial barrier (Figure 1B-circuit diagram). First, at 103-104 Hz, the cell layer capacitance (CCl) dominates the overall impedance as the membrane resistance (Rmembrane) is high enough to be neglected, and current flows predominantly across the capacitor. Hence, the CCl indicates changes to resistance through the cell membrane. Alternatively, TER predominantly imparts the overall impedance at 102-103 Hz, where current flow is channeled through junctional spaces between neighboring cells, held together by junctional proteins. Hence, this provides information on the paracellular component of the endothelial barrier, as seen previously with Rb on ECIS.
Figure 1C details how specific regions of the brain endothelium are disrupted by treatment with melanoma cells. This disruption is detected by the biosensors by a change in the flow of current through the paracellular space (measured as Rb or TER); the basolateral space (measured as Alpha); and the cell membrane (measured as Cm or CCl). We used both biosensors detailed in this introduction to measure brain endothelial barrier change following treatment with various stimuli such as cytokines or invasive melanoma cells. The measured resistance decreases if a given stimulus disrupts the endothelial barrier, creating a path of least resistance to allow current flow. Hence, a decrease in "barrier resistance" suggests loss of barrier integrity or brain endothelial barrier disruption. In these assays, we have studied this disruption by interpreting resistance and modeled parameters in real time. The application of ECIS and cellZscope in addressing such research questions are detailed elsewhere39,41,45,46.
In vitro research allows the discovery of crucial disease mechanisms by revealing molecules and functional pathways, which progress the disease. However, this requires reliable replication of the disease in vitro, which substantially differs from a functioning body. In an ideal scenario, in vitro research should be reproducible, non-invasive, label-free, quantitative, and mimic structural influences found in vivo. In this article, we detail the methodology for using these two contending technologies to measure treatment-induced changes in brain endothelial barrier integrity. We discuss the advantages of combining their results to provide a more comprehensive picture of barrier disruption and share limitations that still need to be overcome.
1. Using ECIS to monitor changes in brain endothelial barrier integrity in response to various treatments
2. Using cellZscope to monitor changes in brain endothelial barrier integrity in response to various treatments
Interpreting ECIS impedance data
Understanding optimal experimental conditions
Herein the data can be directly viewed using the software (Figure 2A) or exported for analysis and graph plotting (Figure 2B). Figure 2A shows an example of data displayed on the actual software interface. The left graph shows an example of a disrupted connection due to improper loading of the 96-well biosensor plate into the adapter, called the array station. Typically, a scratched electrode or misaligned placement of the plate with the array station will produce an improper signal. The right image shows recordings from a correctly loaded plate, where the wells are properly connected. In Figure 2A-right, the increase in resistance from 0 h to 30 h shows the growth phase of the endothelial cells, which form a monolayer with a stable barrier that has plateaued by 48 h. The green vertical lines represent the time of addition of various biological treatments, all of which affect the barrier and alter the resistance in different ways.
Figure 2B shows an example of how the pipetting technique may affect the results. The left figure shows that during the growth phase, the brain endothelial cells plateau at different levels by 48 h (blue and black arrows). This gives different starting points for the treatment and control, making results interpretation difficult, particularly for small changes in resistance. Typically, this occurs due to 1) inconsistent pipetting/resuspending of the brain endothelial cells in the trough during cell seeding or 2) evaporation of media from the wells at the edge of the plate, causing differences in overall resistance measured. To avoid this, researchers should practice optimal pipette skills as detailed in the protocol and ensure that ample brain endothelial cells are available for seeding. Small differences in resistance in the starting point can also be addressed by normalizing the measurements to the time of treatment addition (where y = 1). This adjusts the data to allow a more reliable interpretation of changes in resistance (Figure 2B-right, grey boxed region). While this is acceptable for small differences in resistance, care must be taken to ensure this does not misrepresent the underlying data. Hence, it is recommended to always show raw data to clearly illustrate the variability in brain endothelial growth rate and starting resistance levels across the wells.
Figure 2C also shows the growth phase of the brain endothelium, before treatment with cytokines or melanoma cells. Figure 2C-left shows a fluctuating growth phase, which typically occurs due to incorrect cell counting, which can result in seeding too many cells into the well. The high seeding density of the brain endothelial cells initially gives a strong barrier resistance. However, this gradually declines, instead of maintaining a stable resistance plateau (red arrow). This response is likely due to the accelerated use of nutrients in the media, causing an early decline in overall endothelial cell health. To avoid this, it is advised that researchers optimize seeding density and loading media volume for each endothelial cell line, to achieve an optimal growth phase, similar to that in Figure 2C-right.
Understanding ECIS results to determine the different properties of the brain endothelial barrier
Figure 2C shows the unmodeled resistance (ohms) data, measured at 4,000 Hz, which can be used to assess changes in overall brain endothelial barrier integrity in response to treatments. Figure 2C shows how the addition of cytokines TNFα and IL-1β affects the brain endothelial barrier compared to metastatic melanoma cells. Immediately, it is evident that the cytokines have a transient effect on the barrier, causing an initial decrease (at 52 h) and then an increase in the barrier resistance. Conversely, the addition of melanoma cells drastically reduces the barrier resistance, when added at an E:T ratio of 1:1, and the decrease is maintained for the duration of the assay. Furthermore, the sensitivity of the system allows melanoma cells to be added at lower E:T ratios. Figure 2C shows that a small decrease in barrier resistance is detected, even at a low E:T ratio of 1:100 (1 melanoma cell added to 100 brain endothelial cells).
These data can also be collected at multiple frequencies, and hence, can be mathematically modeled by the software to separate the overall resistance into the paracellular barrier (Rb-ohm × cm2) and the basolateral barrier (Alpha-cm × ohm0.5). Figure 3A shows that the Rb and Alpha fluctuate with a similar trend and magnitude upon the addition of the cytokines. This represents that the overall changes in barrier integrity occur in both the paracellular and basal regions of the endothelium in a similar timeframe. However, after the addition of melanoma cells, the majority of the barrier disruption is attributed to changes in the paracellular barrier (Rb), which decreases with a larger magnitude and more rapidly than the basolateral component (or Alpha-Figure 3B).
Figure 4A displays the same data from Figure 3B, but over a shorter timeframe, for one of the three melanoma cell lines (NZM74). This clearly illustrates the more gradual and lesser decline in the Alpha (<20% in over 10 h), compared to the Rb, which instead declines by 50% in the first 2 h. The results are indicative of a paracellular route of invasion by the melanoma cells, suggesting they disrupt the junctional space first, before spreading to the basolateral regions. To support this finding, Figure 4B shows confocal imaging of a melanoma cell (red) on the brain endothelial monolayer. The sectional z-stack shows the melanoma cell protruding down, in between endothelial cells, in the paracellular regions, and displacing the endothelial cells. This image also illustrates the melanoma cell extending beneath the endothelial cells into the basolateral region, as schematically depicted in Figure 4B. This demonstrates that ECIS provides a high-throughput technique for measuring the different properties of brain endothelial barrier integrity as Rb and proves its sensitivity in measuring the Alpha component for the assessment of basolateral adhesion.
Concurrent analysis of different treatments and stimuli
As shown in Figure 2 and Figure 3, the 96-well array setup means that multiple treatments can be assessed concurrently in real time. This high level of throughput allows simultaneous comparisons to be made between different treatments applied to the same culture of brain endothelial cells. This approach ensures that all cells are as similar as practically possible, reducing technical variations, improving reproducibility, and enhancing the ability to compare between treatments. In Figure 2, we compared the barrier-disrupting effects of one melanoma cell line against two cytokines. In Figure 3, we also compared the effects of several melanoma lines (NZM7, NZM48, and NZM74) against each other. Using the precise protocol detailed in this article, up to 30 different biological treatments, each conducted in technical repeats can be tested simultaneously. This capability provides latitude to efficiently measure various drug concentrations, drug combinations, and/or cell titrations automatically in real-time. Additionally, the real-time measurements allow both short- and longer-term responses for several stimuli to be assessed in the same experiment. This is particularly important in the results presented herein, where we capture the rapid loss of barrier caused by treatment with melanoma cells, whilst illustrating that these changes are titration-dependent. This provides more information than other assays of barrier integrity. Additionally, we capture the transient changes in the barrier resistance caused by the cytokine treatment, which could be missed if the measurement were made at only a few time points manually, as done with traditional probing electrode techniques41,44.
Interpreting cellZscope TER data
Variability in measured TER
Figure 5 shows that there are often well-to-well variations within the same experiments. This causes replicate wells to give the same TER (ohm × cm2) response but from different TER starting points (Figure 5A), increasing the standard deviation (SD) range (Figure 5B). A reasonable explanation is that the large structure of the Cell Module apparatus requires the seeding and application of the treatments to be done separately for each well. This increases loading time and handling error, but also means that each well is under a slightly different loading and plating condition, being physically further apart. Additionally, the top and bottom electrodes are also physically further from the cells, increasing the probability that artifacts, debris, and changes in temperature influence the measured resistance. This effect again requires adjustment by normalizing the TER to the time of treatment addition. Figure 5C shows that normalization allows better comparison of the treatment to control as the starting TER values are matched, whilst the trends and magnitudes of the responses are preserved. This is evidenced by the normalized curve maintaining a similar trend to each replicate in isolation, with the variation between replicates being reduced, as evidenced by a reduction in SD. Faster seeding time with more accurate pipetting reduces this effect, however, the variability between replicate wells in the 24-well cellZscope apparatus is typically higher than that seen with the 96-well ECIS apparatus.
Differences in cellZscope data interpretation compared to ECIS data
On the cellZscope, electrodes are placed on either side of the porous membrane insert. The brain endothelial cells are grown atop this membrane, where they form a monolayer which increases the impedance across the trans-well system. This can then be modeled to measure cell-cell interactions, resulting in a measurement of trans-endothelial electrical resistance (TER). Figure 6-left shows that the addition of the cytokine IL-1β causes an initial decrease in TER, which later increases above the barrier resistance maintained by the vehicle control. This transient effect on endothelial barrier integrity is similar to that observed with the Rb data collected using ECIS, where the increase in resistance at the later time points (post 60 h) is also maintained over the resistance of the vehicle control. The addition of TNFα shows some evidence of the same transient change in resistance; however, the initial decrease is small and the following increase is also diminished compared to that seen with the same concentration of IL-1β (Figure 6-left). Hence the transient changes seen previously with ECIS, are less prominent when measured with the cellZscope. The melanoma cell lines decrease the TER within 5 h, in a similar trend to that seen with the ECIS Rb measurements (Figure 6-right). Note that in Figure 4, melanoma-mediated changes in Alpha measurements were substantially different from the Rb measurements. Hence, the similarity between treatment-mediated changes Rb of ECIS and TER of cellZscope validate these data, showing that the TER records similar junctional barriers as seen with the Rb.
Furthermore, a substantial decrease in TER was observed with the melanoma cell treatment compared to the cytokines. This suggests that pronounced effects that massively impact the brain endothelial barrier are better detected with the cellZscope compared to small, transient changes. These differences between the two technologies occur because, in the cellZscope, the endothelial cells are further from the electrode as depicted in Figure 1. This results in decreased sensitivity compared to ECIS but includes access to both the apical and basal side of the polarized endothelium, which is the main benefit of the TER measurement system. Although there is a loss of sensitivity, with the cellZscope, we can better replicate an endothelial cell environment in 3D. This too is conducted in real time to measure continuous biological activity. Overall, the results provide a cross-modal interpretation of the same properties of the brain endothelium, providing better confirmations for the interpretation of in vitro results.
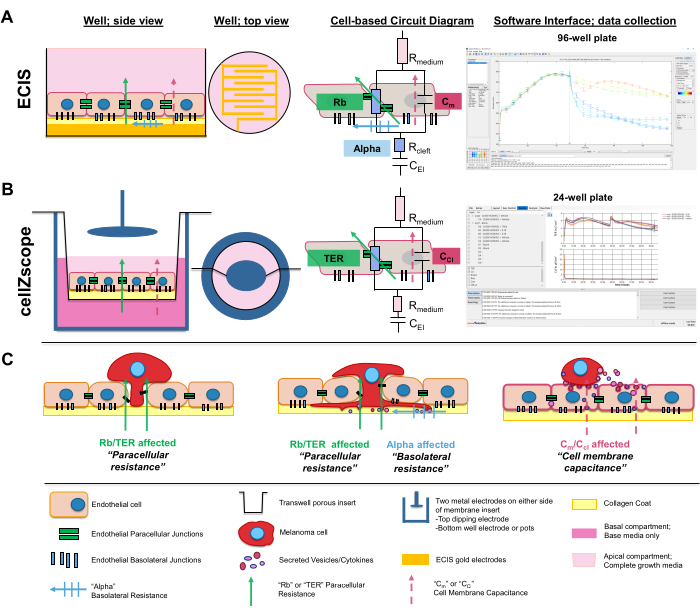
Figure 1: Schematic showing setup and theory of biosensors. (A,B) The schematic of the experimental setup. Top and side views of the wells are shown, with the location of the biosensor components relative to the brain endothelial monolayer. In all cases, color-coded arrows represent the flow of current. The electrical circuit diagrams show the regions in the brain endothelium that influence the flow of current by acting as resistors and capacitors. Current flows through the interjunctional space at low AC frequency, altering the Rb/TER (green arrows). At the same low frequency, current flow between the basal layer of the endothelium and the electrodes alters the Alpha on ECIS (blue arrows). This parameter is not available on the cellZscope, which lacks cell-electrode contact. At high AC frequency, current flows through the cell body, altering the Cm/CCl of the system (red arrows). A software interface for both systems is also shown. (C) A diagrammatic explanation of how a stimulus may affect the measured parameters. When treated with melanoma cells, the brain endothelial Rb/TER or paracellular junctional space is affected first. This occurs as the melanoma cells attach and their protrusions extend between endothelial paracellular junctions mediated by cell-adhesion molecules. The Rb/TER, as well as the Alpha or basal junctional space, are affected when melanoma cell extensions disrupt both endothelial paracellular and then, basolateral junctions to traverse the endothelium. The Cm or CCl displays the Cell membrane capacitance, which is affected when secreted vesicles are endocytosed, changing the membrane composition of the cells in the endothelial monolayer. Changes in Cm or CCl suggest a transcellular route of brain endothelial disruption, rather than paracellular as caused by changes in Rb or TER and Alpha. This figure was modified from Anchan et al.39,45. Note that modeled parameters depict the resistance through the paracellular space, as measured by Rb or TER; resistance through the basolateral space, as measured by Alpha; and capacitance of the cell membrane, as measured by Cm or CCl. Abbreviations: Rb = resistance beta; TER = trans-endothelial electrical resistance; ECIS = Electric Cell-Substrate Impedance Sensing; AC = alternating current; Alpha = resistance alpha. Please click here to view a larger version of this figure.
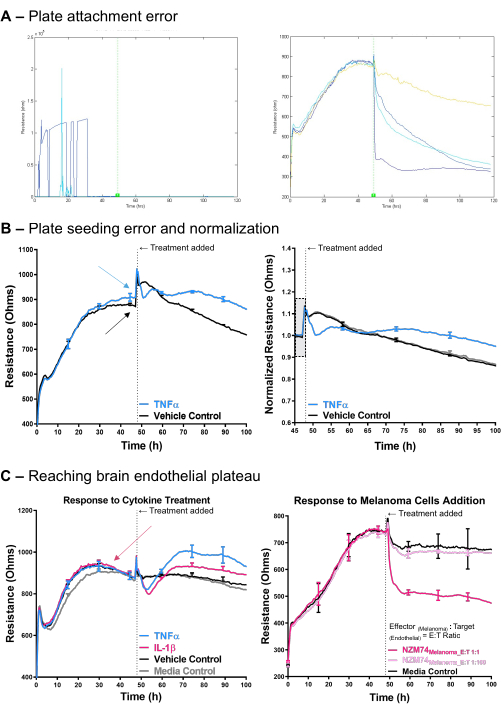
Figure 2: Interpretation of ECIS data at suboptimal conditions. (A) Data as viewed on the biosensor software interface. Two examples are given where the left panel shows misaligned or improper electrode attachment. The right panel shows proper electrode attachment of the 96-well biosensor plate to the array station (adapter), allowing reliable data collection. (B) Unmodeled resistance (at 4,000 Hz) following cytokine addition to the brain endothelial cells. This can be normalized when the treatments were added (where y = 1; grey box) for a more accurate interpretation of results. (C) The unmodeled resistance (at 4,000 Hz) of brain endothelial cells over time after the addition of two cytokines (TNFα and IL-1β) and melanoma cells. Melanoma cells were added at different Effector:Target ratios, where the effector is the melanoma cell and the target is the endothelial cell. An E:T ratio of 1:1 shows 1 melanoma cell added to 1 endothelial cell. Vehicle control was 0.1% BSA in PBS; αMEM with 5% FBS was used as media control. Data show the mean ± SD (n = 3 wells) from one experiment. This figure shows selected data, adapted from Anchan et al. 39 and Hucklesby et al. 41. Abbreviations: ECIS = Electric Cell-Substrate Impedance Sensing; TNFα = tumor necrosis factor-alfa; IL-1β = interleukin-1 beta; E:T = effector:target; BSA = bovine serum albumin; PBS = phosphate-buffered saline; FBS = fetal bovine serum; SD =standard deviation. Please click here to view a larger version of this figure.
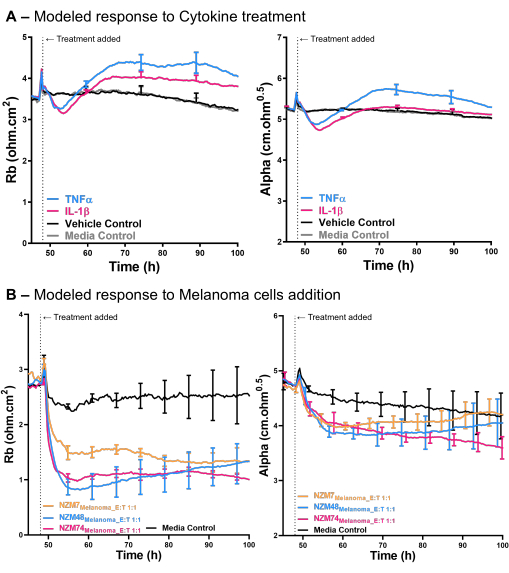
Figure 3: Modeled Rb and Alpha results from ECIS. Data demonstrate how cytokines and melanoma cells influence the brain endothelial barrier properties. (A,B) The left graphs show modeled paracellular resistance of brain endothelial cells over time after the addition of cytokines or melanoma cell lines. The right graphs show modeled basolateral resistance (Alpha) of brain endothelial cells over time after the addition of cytokines and melanoma cell lines. Treatments were added at 48 h (dotted line). Melanoma cells were added at an E:T ratio of 1:1. Data show the mean ± SD (n = 3 wells) from one experiment. This figure shows selected data, adapted from Anchan et al. 39 and Hucklesby et al. 41. Abbreviations: ECIS = Electric Cell-Substrate Impedance Sensing; TNFα = tumor necrosis factor-alfa; IL-1β = interleukin-1 beta; E:T = effector:target; Rb = resistance beta (paracellular resistance); Alpha = resistance alpha. Please click here to view a larger version of this figure.
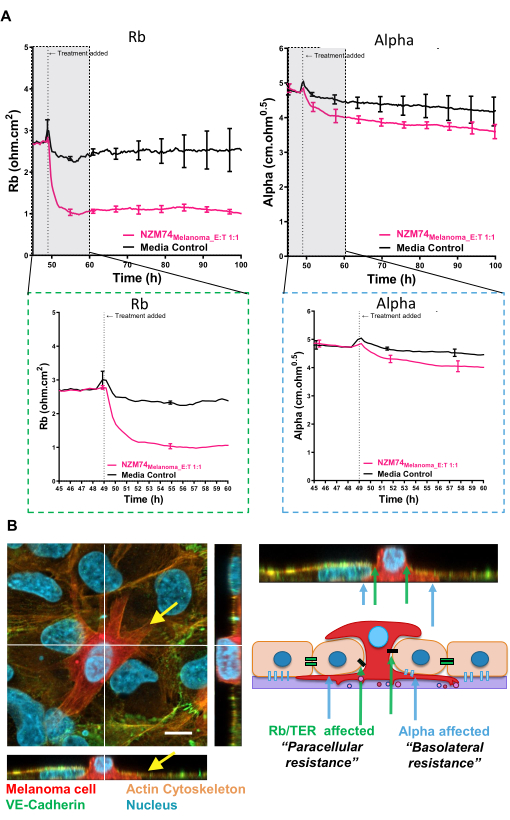
Figure 4: Interpretation of modeled ECIS Rb and Alpha results. (A) Modeled paracellular resistance and basolateral resistance of brain endothelial cells over time after the addition of one melanoma cell line. The grey, boxed region is expanded for a closer view of the results. Treatments were added at 48 h (dotted line). Melanoma cells were added at an E:T ratio of 1:1. Data show the mean ± SD (n = 3 wells) from one experiment. (B) Confocal microscopy image of NZM7 melanoma cell line interacting with the brain endothelial cells. Melanoma cells were live stained with Cell Tracker-Deep Red and applied to the apical face of a confluent brain endothelial monolayer. The square image shows the xy-slice at the level of the basal white lines on the vertical and horizontal z-stacks. The z-stacks form along the vertical and horizontal lines, respectively, on the square image. Yellow arrows point to the same regions of the x-y slice on the z-stack. Scale bar = 10 µm. The horizontal stack is re-pasted on the right panel to compare with the previous Figure 1C. Figure 4A shows selected data, adapted from Anchan et al.39. Abbreviations: ECIS = Electric Cell-Substrate Impedance Sensing; E:T = effector:target; Rb = resistance beta; Alpha = resistance alpha; SD = standard deviation; TER = trans-endothelial electrical resistance. Please click here to view a larger version of this figure.
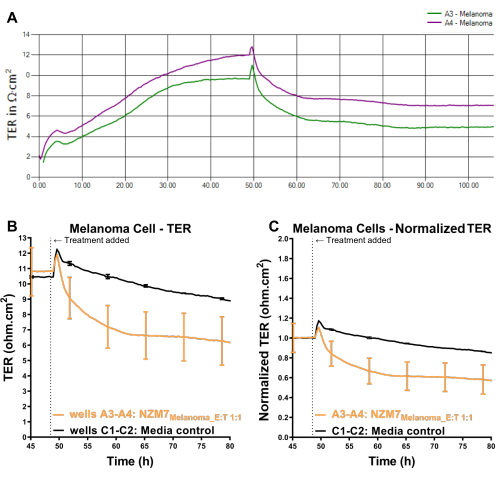
Figure 5: Variability in cellZscope replicate wells. Melanoma cells were added to brain endothelial cells on membrane inserts at an E:T ratio of 1:1. The treatment was added at 48 h (dotted line). (A) The reading as seen on the software for replicate wells A3 (dark green) and A4 (dark purple), to which melanoma cells were added, highlighting the variability between wells. (B) Graphed results of the same, showing the mean ± SD from wells A3 and A4 (orange) compared to media control (black; wells C1 and C2). (C) Results from B normalized to addition time where y = 1. Abbreviations: TER = trans-endothelial electrical resistance; E:T = effector:target. Please click here to view a larger version of this figure.
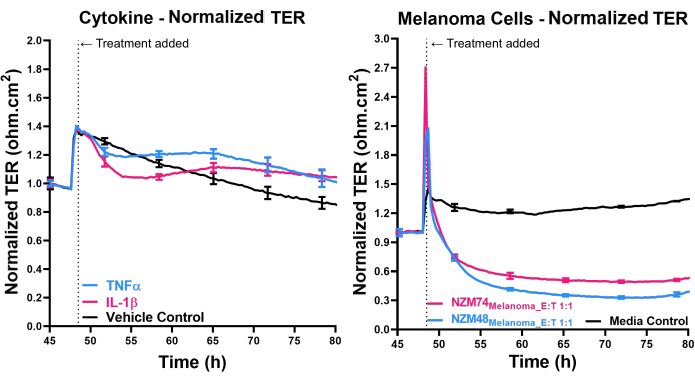
Figure 6: cellZscope TER data showing changes in brain endothelial barrier resistance caused by the addition of cytokines and melanoma cells. Melanoma cell lines were added to brain endothelial cells on the membrane inserts at an E:T ratio of 1:1. The treatment was at 48 h (dotted line), and results were normalized to this addition time (where y = 1). Data show the mean ± SD from n = 3 wells for cytokines and n = 2 wells for melanoma cells. The data for cytokines show selected data, adapted from Hucklesby et al. 41. Abbreviations: TER = trans-endothelial electrical resistance; E:T = effector:target. Please click here to view a larger version of this figure.
Supplemental Figure S1: Schematic showing an example of the addition of treatment samples to an ECIS experiment. Top panel shows a 1 mL strip tube plate which holds the strip tubes in a typical plate map orientation. Strip tubes can be placed in any empty compartment according to the multi-channel pipette used but must follow a plate map as depicted in the Bottom panel. 1 strip tube is used per treatment, containing the total treatment volume for all replicates, for example, at least 400 µL of sample in 1 strip for four replicates of a treatment at 100 µL per well. Abbreviation: ECIS = Electric Cell-Substrate Impedance Sensing. Please click here to download this File.
Therapeutic studies on diseases that affect the BBB must consider the importance of brain endothelial barrier integrity and regulation. For example, brain endothelial barrier disruption is critically investigated in the metastasis of cancer to the brain from other anatomical sites. This is because the brain endothelium forms the first barrier against circulating tumor cells. As mentioned earlier in the introduction, in vitro studies on endothelial barrier integrity need to be reproducible, non-invasive, label-free, quantitative, and mimic the environment in vivo as closely as possible. In this article, we discuss the use of two key biosensors for the assessment of brain endothelial barrier integrity. We highlight the main steps and modifications in the protocol to help produce optimal and reproducible results.
Increasing the reproducibility of data generated using ECIS
Critical steps in the protocol
The first critical step in the protocol is to ensure proper plate handling. Figure 2A shows evidence of improper electrode connections, leading to loss of data from some wells in the 96-well plate. To overcome this, we use careful pipetting to avoid physically touching the bottom electrodes. Regarding plate handling, it is recommended to stabilize the plate with one hand placed on top of the plate, while 'clipping' the plate to the array station. This avoids tension building on the clipped side, which prevents the electrodes from slipping and scraping on the array station. Furthermore, for the equipment to work as expected, stabilization of the electrode is required. The plate may be stabilized electrically using its corresponding software; however, this step takes longer to complete. Therefore, we use chemical stabilization with 10 mM cysteine. Plates can be stabilized with either or both methods, but doing both is recommended when the measurements assess the endothelial growth phase over long durations (over 50 h). It is also recommended by the manufacturer to use sterile deionized water for washes and acetic acid for dilution of collagen instead of buffers. This avoids PBS interfering with protein adsorption, which is the step that adheres the collagen to the gold electrode covered surface. We also recommend conducting all washes twice to decrease pipetting/handling errors. Lastly, to utilize the full power of this system, it is highly recommended to include a cell-free well (media only with no endothelial cells) to allow mathematical modeling of the recorded data. Before resuming the experiment, we check the plate identifier (e.g., 96w20idf) and ensure data are collected using the "multifrequency" settings. This ensures that the software can mathematically model the recorded data to identify which endothelial barrier properties are contributing to the barrier integrity42. If discrimination between Rb, Alpha, and Cm is not needed, it is recommended to record the resistance at 4,000 Hz, which will indicate overall barrier integrity39,41,46. This will increase the frequency of measurements, giving higher temporal resolution, although it is at the cost of the modeled data.
Modifications and optimization of the protocol
In addition to listing the critical steps of the protocol, we have also suggested modifications to optimize data collection. First, during cell harvest, we recommend using gentle dissociation reagents that are neutralized prior to cell counting and seeding, to protect cell surface proteins. This is important as brain endothelial function is based heavily on the interaction of such cell-surface proteins, such as the adhesion molecules detailed in the introduction3,20,24. Furthermore, processes such as cancer cell extravasation also rely on cell-surface adhesion molecules47,48,49,50,51. Second, a 96-well plate system allows for concurrent measurement of several variables in a single experiment. This includes different treatment options such as the melanoma cells and cytokines used in these experiments but can also extend to using different endothelial cells. For reliable comparison between the variables, we use sterile troughs and strip tubes to increase the speed of seeding the plate with endothelial cells and subsequently applying treatments. Here, we suggest preparing treatments in excess total volume in strip tubes or equivalent compartments. Crucially, we aim to seed cells or treatments to an entire plate within a minute to 1) reduce the time live cells spend outside the incubator, 2) prevent cells from settling over time during seeding or treatment, which alters the number of cells seeded or treated, and 3) prevent media cooling. The faster the plates are seeded/treated, the more consistent and reliable the results are, as depicted in Figure 2C-right. Similarly, we advise preparing the software and adaptors prior to cell seeding, to again limit live-cell time outside the incubator. Furthermore, to improve the overall integrity of the assay, we suggest modifications during the loading of the 96-well biosensor plate. In Figure 2B, we highlight a plate loading effect, showing a discrepancy between the 'plateaued' resistance reached by brain endothelial cells in different wells. Furthermore, Figure 4A shows that over time, the SD range within some replicate wells expands, suggesting that variability between replicate wells increases over time. Such changes in resistance can be caused by the evaporation of media from wells on the edges of the plate. Often, the controls are most affected as they are typically placed at the ends of the plate. To address this, particularly in long experiments, we suggest alternating the plate map and using different regions of the plate for treatment and controls across repeats, thereby overcoming any plate loading effect. Another approach is to place media only into the wells along the edges of the plate to protect the samples. However, this is at the cost of losing treatment wells at the edges. Correct application of the steps, as detailed above, reduces plating and electrode errors, making the results more reliable and reproducible as in39,40,41,45,46.
Improving the use of these impedance platforms to better assess brain endothelial barrier properties
Modifications for using the cellZscope to improve brain endothelial cell health
To improve brain endothelial cell health on the porous membrane inserts, we suggest adding the treatments in 70 µL of endothelial cell culture media, such as the complete serum-containing M199 media used in this study. Adding the treatments in endothelial media minimizes disruption to the endothelial cells growing on the semi-permeable membrane inserts. Furthermore, a crucial aspect of this insert-based setup is to use serum-free media in the basal compartment (or bottom electrode) and complete endothelial media with 10% serum on top of the brain endothelial monolayer. This replicates the endothelial environment in vivo more closely by mimicking its natural polarisation21,52, wherein the endothelial blood-facing or apical face is exposed to serum, whilst the basal side is not.
Limitations of both biosensors and future considerations
The main limitation of the 96-well plate ECIS model is that it only allows access to the apical side of the endothelium. This means that only the apical environment can be manipulated or monitored in these assays. We suggest using the cellZscope in addition to ECIS, which provides an interpretation of a 3D cell plating model, by allowing access to both apical and basal compartments of the brain endothelium. These data show that changes in brain endothelial barrier integrity can be successfully monitored using the cellZscope, in particular, the TER parameter that represents the Rb/paracellular barrier assessed using ECIS. Figure 6 demonstrates that the cytokines TNFα/IL-1β caused a smaller change in the cellZscope-derived TER data when compared to the change in Rb generated using ECIS. The change in TER for the melanoma treatment more closely replicated the Rb data from ECIS. We infer that the cellZscope lacks the sensitivity of ECIS, particularly for small changes in barrier resistance, due to the remote physical location of the electrodes relative to the cells. The direct contact of the ECIS electrodes with the brain endothelial cells allows better detection of small changes, justifying its use as a screening technique. This is further supported by the high-throughput nature of the 96-well format. Hence, these findings provide a rationale for utilizing ECIS as a screening tool and the subsequent use of cellZscope to investigate any basolateral compartment factors. The cellZscope also provides an opportunity to develop a multicellular model that better mimics a complete BBB. In the first instance, this would include growing pericytes closely attached to the brain endothelium, on the basal side of the membrane. Plating pericytes on the opposite side of a membrane is already an established approach in the literature53, and this type of model would allow real-time, label-free analysis of the TER of the brain endothelium, supported by pericytes. Notably, this would require optimization and imaging to confirm an appropriate BBB model has been established, especially as we currently use 0.4 µM pore size membrane inserts, which limit the passage of larger cells. A key limitation for both ECIS and cellZscope systems is that they only conduct experiments under static conditions. This removes a crucial factor for endothelial function, which is blood flow, as this pulls on the endothelial cells creating shear stress. Future research could therefore replicate the ECIS experiments using a shear system model, an example of which is currently being developed by our lab as detailed in abstract 24 in54.
Significant advantages of these impedance platforms and analysis of the data generated
Currently, the technical approaches detailed in this study have successfully yielded data, demonstrating the response of the brain endothelial monolayer to multiple stimuli simultaneously39,40,41,45,46. Importantly, ECIS and cellZscope generate real-time data necessary for the continuous assessment of the dynamic endothelial barrier. This feature is not possible using the traditional EVOM, which lacks this temporal resolution. Furthermore, the autonomous, label-free nature of both ECIS and cellZscope completely removes the measurement variability created by manual recording using EVOM or FITC-dextran assays44,55. ECIS has exceptional functionality due to its rapid data acquisition across a large frequency range and its mathematical modeling capacity. ECIS also provides superior sensitivity for the detection of small changes in barrier resistance. The different E:T ratios used to assess the sensitivity of the systems allowed us to screen for the lowest effector (E) cell number, that caused a measurable effect on the target (T) cells-the brain endothelial cells. From the biological perspective of melanoma metastasis, ECIS allowed us to ascertain a working range of E:T ratios. Furthermore, as per the previous discussion section, combining the ECIS data with a 3D biosensor like the cellZscope provides additional power to assess the brain endothelium in a 3D setting. For example, the true power of cellZscope comes from the access to the basal compartment, vital for dynamic studies of the polarized endothelium. In the case of melanoma cell extravasation, this would allow the manipulation of the brain endothelium by adding support BBB factors to the basal side and melanoma cells or inflammatory cytokines to the apical side. Both systems generate abundant information about the brain endothelial barrier, of which only the Rb, Alpha, and TER are shown in this study. While these speak to the paracellular barrier (Rb + TER) and basolateral (Alpha) components, the Cm and CCl parameters can also be obtained, providing information regarding transcellular barrier disruption. In both biosensors, data are extracted as a .xls file and analyzed on data processing software such as GraphPad Prism or RStudio to present the combination studies. Graphpad Prism graphs are shown in this article; however, RStudio provides a streamlined, standardized, and statistically sound program to quickly analyze the data generated by these biosensors. For statistical analysis of assays conducted on microvascular cells, we use the VASCR (vasculature-R) program written in our lab under the supervision of the University of Auckland, Statistics Consulting Centre41.
The authors have nothing to disclose.
Akshata Anchan was funded by the Neurological Foundation of New Zealand for the Gillespie Scholarship (grant reference: 1628-GS) and First Fellowship (grant reference: 2021 FFE). The research cost was also partially funded by the Neurological Foundation Fellowship-2021 FFE and the University of Auckland Faculty Research Development Fund. James Hucklesby was funded by a scholarship from the Auckland Medical Research Foundation. Thanks to the Baguley team and Auckland Cancer Society Research Centre for the patient-derived New Zealand Melanoma NZM cell lines.
aMEM | Gibco | 12561072 | Melanoma cell base media |
cellZscope array | nanoAnalytics | cellZscope2; software v4.3.1 | TER measuring biosensor array |
Collagen I—rat tail | Gibco | A1048301 | ECM substrate for coating |
dibutyryl-cAMP | Sigma-Aldrich | D0627 | Brain endothelial media supplement |
ECIS array | Applied Biophysics | ECIS ZΘ; software v1.2.163.0 | Rb/Alpha measuring biosensor array |
ECIS plate | Applied Biophysics | 96W20idf | 96-well biosensor plate |
FBS | Sigma-Aldrich | 12203C-500ML | |
GlutaMAX | Gibco | 305050-061 | Brain endothelial media supplement |
hCMVEC | Applied Biological Materials | T0259 | Brain endothelial cell line |
hEGF | PeproTech | PTAF10015100 | Brain endothelial media supplement |
Heparin | Sigma-Aldrich | H-3393 | Brain endothelial media supplement |
hFGF | PeproTech | PTAF10018B50 | Brain endothelial media supplement |
Hydrocortison | Sigma-Aldrich | H0888 | Brain endothelial media supplement |
IL-1β | PeproTech | 200-01B | Cytokine |
Insulin-Transferrin-Sodium Selenite | Sigma-Aldrich | 11074547001 | Melanoma cell media supplement |
M199 | Gibco | 11150-067 | Brain endothelial cell base media |
MilliQ water | Deionized water | ||
PBS 1x | Gibco | 10010-023 | |
TNFα | PeproTech | 300-01A | Cytokine |
Transwell insert | Corning | CLS3464 | Porous membrane insert |
TrypLE Express Enzyme | Gibco | 12604021 | Dissociation reagent |