JoVE 과학 교육
Chemical Engineering
JoVE 비디오를 활용하시려면 도서관을 통한 기관 구독이 필요합니다.  전체 비디오를 보시려면 로그인하거나 무료 트라이얼을 시작하세요.
JoVE 과학 교육 Chemical Engineering
Liquid Phase Reactor: Sucrose Inversion
  • 00:07개요
  • 01:04Principles of Reaction Kinetics in Packed Bed Reactors
  • 03:26Packed Bed Reactor Start-up
  • 04:21Catalyst Regeneration and Sucrose Feed
  • 05:27Sample Collection and Polarimeter Analysis
  • 07:07Results
  • 09:29Applications
  • 10:37Summary

Reactor de fase líquida: Inversión de sacarosa

English

소셜에 공유하기

개요

Fuente: Kerry M. Dooley y Michael g. Benton, Departamento de ingeniería química, Universidad Estatal de Louisiana, Baton Rouge, LA

Reactores de flujo continuo y por lotes son utilizados en reacciones catalíticas. Camas embaladas, que utilizan catalizadores sólidos y un flujo continuo, son la configuración más común. En la ausencia de una corriente de reciclaje extenso, tales reactores de lecho empacado se modelan generalmente como “plug flow”. El otro reactor continuo más común es un tanque agitado, que se supone que se mezcla perfectamente. 1 una de las razones para la prevalencia de reactores de lecho empacado es que, a diferencia de la mayoría de los diseños de tanque agitado, un área de pared grande al cociente del volumen del reactor promueve la transferencia de calor más rápida. Para casi todos los reactores, calor debe añadido o retirado para controlar la temperatura para la reacción deseada.

La cinética de reacciones catalíticas son a menudo más complejos que la simple orden de 1st , 2nd orden, cinética etc. encontrado en los libros de texto. Las tarifas de la reacción también pueden verse afectadas por tarifas de transferencia de masa – reacción no puede ocurrir más rápidamente que la tasa en que reactivos se suministran a la superficie o la tasa a la que se eliminan los productos – y la transferencia de calor. Por estas razones, la experimentación es casi siempre necesaria para determinar la cinética de reacción antes de diseño de equipos a gran escala. En este experimento, exploramos cómo llevar a cabo tales experimentos y cómo interpretar mediante la búsqueda de una expresión de la velocidad de reacción y una constante de velocidad aparente.

Este experimento explora el uso de un reactor de lecho empacado para determinar la cinética de la inversión de la sacarosa. Esta reacción es típica de aquellos caracterizados por un catalizador sólido con productos y reactantes de la fase líquida.

sacarosa → glucosa (dextrosa) + fructose(1)

Un reactor de lecho empacado será operado en diferentes caudales para controlar el espacio tiempo, que se relaciona con tiempo de residencia y es análogo al tiempo transcurrido en un reactor discontinuo. El catalizador, un ácido sólido, primero va ser preparado mediante el intercambio de protones para otros cationes presentes. Entonces, el reactor se calentará a la temperatura deseada (operación isotérmica) con el flujo de reactivos. Cuando se ha equilibrado la temperatura, muestreo de producto comenzará. Las muestras se analizarán por un polarímetro, que mide la rotación óptica. Rotación óptica de la mezcla puede estar relacionada con la conversión de sacarosa, que se puede utilizar entonces en el análisis de la cinética de la estándar para determinar el orden de la reacción, con respecto a la sacarosa reactivo y la constante de velocidad aparente. También analizarán los efectos de la mecánica de fluidos – no axial mezcla (flujo tapón) vs algunos mezcla axial (tanques agitados en serie) – en la cinética.

Principles

Procedure

Propiedades del catalizador son: tamaño = 20-40 malla; peso = 223 g; contenido de agua = 30 wt. %; densidad aparente (aparente) = 1,01 g/mL; concentración de ácido sitio = 4,6 mmol sitios de ácido/g peso seco; área de superficie = 50 m2/g; macroporosidad (macropore volumen total volumen cat.) = 0,34; macropore tamaño promedio = 80 nm. En la figura 2muestra un diagrama P & ID de la unidad. Para este experimento, se utilizan sólo cama #1, el depósito de materia …

Results

The polarimeter determines the fractional conversions of sucrose after reaction in a packed bed reactor. A previous polarimeter calibration for a three different sucrose feeds is shown in Figure 3.

Figure 3
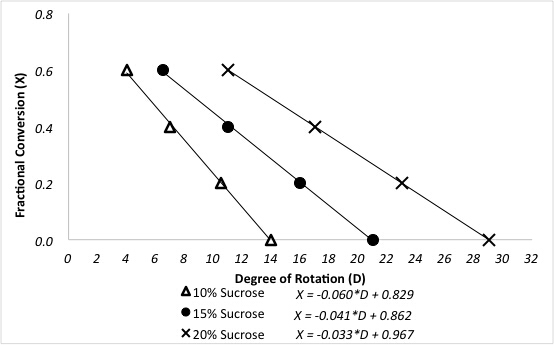
Figure 3. Relationship between degree of rotation and fractional conversion of sucrose for different feed concentrations.

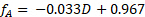
Sample data are presented in Figure 4 for the reaction at 60 °C at varying sucrose feed concentrations. Fractional conversions were calculated directly from the polarimeter calibration curve using the following equation, where D is the degrees of rotation from the polarimeter:

    Equation 5 (4)

Figure 4
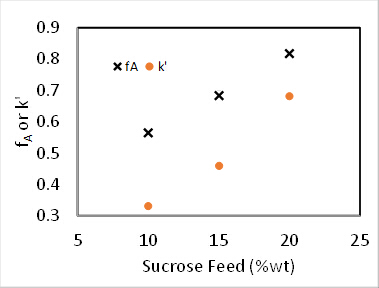
Figure 4. Sucrose inversion reaction at 60°C, 100 mL/min feed rate.

For both 0th and 1st order reactions, the conversion in a PFR is independent of feed concentration.2 Additionally, k' should be invariant for 1st order kinetics. Assuming the reactor to be a PFR, the 2nd order rate constant, k2 (mL/mmol sites • min), was determined by accounting for the 1st order dependence the catalyst, and the pseudo-1st order rate constant k' (mL/gcat • min) was determined by ignoring the 1st order dependence of the catalyst. The results of the pseudo-k' calculations are plotted in Figure 4. And the value of k2 was found by dividing k' by the concentration of catalyst (mmol acid sites/gcat) given previously.

Equation 6  (5)

To determine whether the reaction kinetics were closer to 0, 0.5, 1, 1.5 or 2nd order in sucrose, nonlinear regression of the mass balance was used, and the sum of squared errors was minimized for all three runs. In order to use nonlinear regression, an objective function was formulated based on the integrated PFR mass balance and the respective reaction order. For example, the following is the objective function for a 1.5 kinetic order in sucrose concentration:

Equation 7 (6)

Other objective functions can be formulated from the standard PFR mass balance solutions, which can be found in all kinetics textbooks.2 The experimental data in Figure 4 were fit to the integrated PFR mass balances for 1, 1.5 and 2 orders with respect to sucrose. The sum of squared errors for the three reaction orders were determined to be 0.39, 0.16 and 1.3, respectively. Therefore, the best fit was found to be n = 1.5 order. This leads to a k' value of 35 (mL/gcat • min).

It was initially thought that the kinetics were 1st order with respect to sucrose.2-3 Using this assumption, one can determine the number of equal volume CSTRs, N, in series that are required to model this reactor. Again, the sum of squared errors in the mass balance for all three runs were minimized to determine both N and k'. The data were fit to the tanks-in-series model for 1st order reactions:
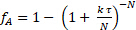
Equation 8 (7)

It was found that N = 2.1 "tanks" and k' = 0.62 mL/gcat • min. This is not a great fit because the reaction order is not exactly 1. The data suggest a sucrose order > 1. The relative standard deviations of fA were at most 2%, which is easily accounted for by the variation in temperature (as high as 9 °C). There was no evidence of catalyst deactivation. The fractional conversions for both a PFR and for two CSTR tanks in series was computed using the k's from nonlinear regression and plotted in Figure 1. For zeroth order, there was no difference between a PFR and CSTRs in series because the rate is independent of sucrose concentration. If the curves for 6 or greater CSTRs had been plotted, they would have coincided closely with the PFR curves. The predicted fractional conversions for two CSTR tanks in series is slower than a PFR for all reaction orders. The experimental data for 15 wt% sucrose is actually closer to a first-order reaction in PFR.

The error in k' can be estimated by comparing the differences in computed k' values at the average temperature deviation (4.5 °C) to the temperature of the reaction, 60 °C, using the Arrhenius equation and averaging the two literature activation energies. The estimated k' for 1.5 order kinetics at 64.5 °C is 52 (mL/mol)0.5 mL • gcat-1 • min-1, which is almost 50% higher than the regressed value of 35 (mL/mol)0.5 mL • gcat-1 • min-1. Slight variations in temperature can affect the k' greatly. 

Applications and Summary

The reaction does not behave exactly as expected because the apparent order n is > 1. Of all the phenomena that can cause such deviations in real reactors, deviations from ideal PFR behavior caused by axial mixing are suggested by the fact that fitting to the tanks-in-series model gives only a small number of tanks – for a perfect PFR, N should be at least 6. Such deviations are often found in relatively short beds, especially if the flow is multiphase (some water is vaporized in the reactor). However, another cause of the deviation is less apparent but probably even more important. The reaction is highly exothermic, and as mentioned, the temperature oscillated by as much as 9°C (mostly above the set point). The more sucrose in the feed, the more heat that will be generated. As might be expected, the oscillations were most significant with the 20 wt% feed. This suggests another reason for an apparent order n > 1: the more heat generated at a higher concentration of feed increases the reactor temperature more, which in turn increases the reaction rate resulting in a derived apparent order > the actual order. If the temperature is inadequately controlled, the reactor temperature might increase to the adiabatic limit. Deviations from ideal PFR behavior in both flow and temperature can affect the apparent kinetics derived from actual reactors, putting a premium on careful reactor scale-up to duplicate pilot-plant conditions of fluid flow and heat transfer.

Packed bed reactors have many uses in the chemical industry. Sulfuric acid, a chemical used to make hundreds of different products, is commonly manufactured in part using packed bed chemical reactors in series. Over 200 million tons are produced annually.In this reaction, sulfur dioxide and air are passed through fixed bed reactors in series (with intermediate heat exchangers for heat removal) containing a supported vanadium oxide catalyst at high temperatures.4 The SO2 is oxidized to SO3, which, when absorbed in water, makes sulfuric acid.

A more recent use for packed bed reactors is in production of biodiesel by transesterifying triglycerides, or esterifying fatty acids, with methanol. While biodiesel is produced in different ways, packed bed reactors can be advantageous for continuous production. Biodiesel is considered a renewable energy source because it is produced from algae or waste foodstuffs, and because it is biodegradable and non-toxic. Regardless of the catalyst used, it must be thoroughly purged from the product after the reaction, because even small amounts can render the fuel unusable.5

APPENDIX A – USING THE POLARIMETER
Polarimetry measures the extent to which a substance interacts with plane polarized light (light which consists of waves that vibrate only in one plane). It can rotate the polarized light to the left, to the right, or not at all. If it rotates polarized light to the left or to the right, it is “optically active”. If a compound does not have a chiral center, it will not rotate polarized light. The number of degrees and the direction of rotation are measured to give the observed rotation. The observed rotation is corrected for the length of the cell used and the solution concentration, using the following equation:
Equation 9  (A1)
where: a = specific rotation (degrees) (literature value), l = path length (dm), and c = concentration (g/mL).
Comparing the corrected observed rotation to literature values can aid in the identification of an unknown compound. However, if the compounds are known, it is more common to prepare calibration standards of the unknowns and correlate the observed rotation to concentration.

References

  1. J. Sauer, N. Dahmen and E. Henrich. "Chemical Reactor Types." Ullman's Encycylopedia of Industrial Chemistry (2015). Web. 15 Oct. 2016.
  2. H.S. Fogler, "Elements of Chemical Reaction Engineering," 4th Ed., Prentice-Hall, Upper Saddle River, NJ, 2006, Ch. 2-4; O. Levenspiel, "Chemical Reaction Engineering," 3rd Ed., John Wiley, New York, 1999, Ch. 4-6; C.G. Hill, Jr. and T.W. Root, "Introduction to Chemical Engineering Kinetics and Reactor Design," 2nd Ed., John Wiley, New York, 2014, Ch. 8.
  3. N. Lifshutz and J. S. Dranoff, Ind. Eng. Chem. Proc. Des. Dev., 7, 266-269 (1968).
  4. E.R. Gilliland, H. J. Bixler, and J. E. O'Connell, Ind. Eng. Chem. Fundam., 10, 185-191 (1971).
  5. "Sulfuric Acid." The Essential Chemical Industry. Univ. of York, 2016. http://www.essentialchemicalindustry.org/chemicals/sulfuric-acid.html. Accessed 10/20/16.
  6. E. Lotero, Y. Liu, D.E. Lopez, K. Suwannakarn, D.A. Bruce and J.G. Goodwin, Jr., Ind. Eng. Chem. Res.,44, 5353-5363 (2005); A. Buasri, N. Chaiyut, V. Loryuenyong, C. Rodklum, T. Chaikwan, and N. Kumphan, Appl. Sci.2, 641-653 (2012); doi:10.3390/app2030641.

내레이션 대본

Chemical reactions are carried out in various types of reactors using catalysts in order to increase reaction rate and improve conversion. Reaction rate is temperature dependent thus it is strongly influenced by heat transfer. Additionally, reaction rate is effected by mass transfer since a reaction cannot take place faster than the rate at which reactants are supplied to the catalyst surface. Therefore, packed bed reactors are often preferred over batch reactors as rapid heat transfer is more feasible. In this video, the kinetics of a simple reaction in a packed bed reactor is analyzed. The reactor is operated at different conditions in order to determine the real reaction order and a parent rate constant, as the kinetics of real systems often deviate from what is expected.

Packed bed reactors can be modeled as a series of many equally sized CSTRs who’s total volume and catalyst weight matches that of the packed bed reactor. This model is called the tanks-in-series model and is given by this equation. Here, i is the reactor number, CA0 is the feed concentration of the limiting reactant, and delta FAI is the change in fractional conversion of the limiting reactant. Finally, RAI is the rate of reaction, N is the number of tanks needed, and Tao is residence time. The forward rate for a catalytic reaction is almost always first order with respect to catalyst concentration and some positive order less than two with respect to reactant concentration. However, catalyst inhibition may alter reaction order, causing the reaction order to appear less than it actually is. Even reactants can inhibit the catalyst causing the reaction order to appear close to zero. For these reasons, catalytic reactions are described by the power law model where K prime is the apparent rate constant, CA is the concentration of the limiting reactant, and beta is the apparent reaction order. The model presupposes that catalyst concentration is constant. However, in practice, catalysts deactivate. Thus catalyst concentration should be modeled as a function of time. In the following demonstration, the kinetics of a typical reaction with a solid catalyst and liquid phase reactants and products is demonstrated. The reaction involves the breakdown of sucrose into glucose and fructose called sucrose inversion. The reaction is typically first order with respect to sucrose and with respect to catalyst sites. The rate constant is effected by heat and mass transfer, flow distribution, temperature, and catalyst activation. Thus the rate constant is determined experimentally for the specific system. Now that we have discussed the tanks-in-series model and how to deduce the reaction kinetics, let’s take a look at the procedure itself.

Before you start, familiarize yourself with the apparatus. Select Perm from the unit item on the menu to access the permeameter schematic. In this experiment, the unit is operated using a distributed control system. Only bed number one, the organics tank, pump, and T505 temperature controller are used. By selecting Trend 50, all the data, the key process variables with respect to time can be obtained and collected into a spreadsheet. Now, open the inlet and exit valves to catalytic reactor bed number one. Make sure that the inlet and exit values to the other beds are closed as well as the control valve F531 and the on/off valve D531 on the city water supply.

Add dilute acid to the two liter tank. Turn on the feed pump to a constant speed and set the rotameter to obtain a desired flow of 40 to 70 milliliters per minute. Increase the speed of the feed pump if the rotameter cannot reach this range of flow. Feed the acid and then approximately 200 milliliters of deionized water to regenerate the catalyst by exchanging the cations such as sodium or calcium which are interacting with sulfonic acid anions. Next, prepare the sucrose feed solution and add one liter to the organics tank. Turn on the pump. Use the speed controller of the pump and the rotameter to adjust the speed flow as desired. Set the T505 temperature controller to auto and select a set point of 50 degrees Celsius. When the system has reached 50 degrees, move the set point to the final temperature of 60 degrees where the reaction is typically carried out.

First, use a test tube to collect at least 25 milliliters of the initial feed to have a sucrose sample before the reaction has started. Then wait until two bed residence times have passed and collect two sets of 25 milliliter samples at the drain which are 10 minutes apart. These samples will be analyzed using a polarimeter. To begin reactor shutdown, set T505 to zero output. Once the temperature begins to drop, shut off the reactor and then close the block valves on bed one. Now use a polarimeter to analyze the samples. A polarimeter is used because carbohydrates are enantiomers and rotate polarized light to a certain degree. Sucrose rotates the light to the right while the solution of glucose and fructose will rotate it to the left giving negative values. Turn on the sodium lamp and wait until a yellow light is seen. A uniform dark field is visible at the zero position of the dial. Transfer 25 milliliters of the reaction sample to the tube and place it into the polarimeter with the bulb near the eye piece facing up and then close the cover. Dark and light fringes can be observed through the lens if the reaction sample rotates polarized light. Rotate the dial until the fringes disappear and reveal a uniform dark field. Adjust the focus with the black dial and using the Vernier scale, read the rotation angle through the magnifying glass to determine the fraction conversion of sucrose.

Now let’s take a look at the rate constant determination using the fractional conversion of sucrose in a packed bed reactor. The specific rotation D of each sugar can be found in the literature and is correlated to the measured rotation and the concentration. Concentration is then used to determine fractional conversion. This data is shown here, plotted against the degree of rotation. The higher the concentration of sucrose, the higher the positive degree of rotation. As the reaction progresses and sucrose is converted to glucose and fructose, the positive degree of rotation diminishes. Now let’s take a look at the reaction kinetics of sucrose inversion at 60 degrees Celsius. Calculate the pseudo first order constant K prime for each feed concentration, which ignores the first order dependents of the catalyst. Then account for the first order dependence of the catalyst by dividing the pseudo first order rate constant by the concentration of the catalyst to give the second order rate constant K two. To determine the real reaction order for the data acquired, start with the generalized mole balance of the packed bed reactor with respect to catalyst weight W. Then determine the equations for each reaction order. Fit these equations to the data using a non-linear regression and determine the sum of squared errors to evaluate the fit. Now fit the data to the tanks-in-series model for the first order reaction and determine the number of tanks needed. A small number of tanks is calculated suggesting that the reaction deviates from ideal packed bed reactor behavior. This is most likely attributed to axial mixing and temperature fluctuations within the reactor. Finally, we can compare the reaction behavior of various kinetic orders, including first and second order packed bed reactor models with first and second order tanks-in-series models consisting of two tanks. It is clear that the fractional conversion for the first order packed bed reactor model more closely represents the observed behavior as matched to the known data point for 15 weight percent sucrose.

Solid catalysts are used in a wide range of applications and reactor setups as they are one of the most important fields in modern technology. A fluidized bed reactor utilizes solid catalyst suspended in fluid. The fluid, usually gas or liquid, is passed through solid catalyst particles at high enough velocities to suspend them and make them behave like a fluid. These types of reactors can be used for many different applications, one of which is the pyrolysis of lignocellulosic biomass. In this process, the thermal decomposition of biomass occurs resulting in oxygenated bio oils. Catalyst performance varies depending on operating conditions, which can be measured using a temperature programmed reaction. A temperature programmed reaction involves the steady increase of reaction temperature with the continuous monitoring of reactor effluent. Performance is then correlated to temperature enabling the determination of optimum operating temperature.

You’ve just watched Jove’s introduction to packed bed reactors for catalytic reactions. You should now understand how to analyze the kinetics of the reaction and how to model behavior using the tanks-in-series model. Thanks for watching.

Tags

Cite This
JoVE Science Education Database. JoVE Science Education. Liquid Phase Reactor: Sucrose Inversion. JoVE, Cambridge, MA, (2023).