Computational fluid dynamic simulations are used to analyze blood flow in patient vasculature to guide diagnostics and treatment. Computational fluid dynamics, or CFD, uses numerical analysis methods to model fluid flow and simulate realistic conditions for many different flow scenarios, such as the fluid flow around a high-speed airplane, through complex piping networks, and within our cardiovascular system.
In medical application, various imaging techniques are used to obtain blood vessel geometries. Then CFD simulations are performed, which are used to predict disease progression and model treatment scenarios for vasculature dysfunctions, including coronary heart disease, arteriovenous malformations, and aneurysms.
This video will illustrate the principles of CFD, demonstrate how the geometries of blood vessels are used to model high resolution hemodynamics, and discuss some applications of CFD.
First, let’s understand cardiovascular dynamics and the principles of CFD.
Cardiovascular hemodynamics describes the dynamics of blood flow in the heart, including through the left and right ventricles and atria, and blood flow in the vessels from the heart to the rest of the body. Complex vascular networks can be visualized using magnetic resonance angiography and velocimetry or X-ray fluoroscopy. These methods outline the geometry of the patient’s blood vessels and define flow boundary conditions.
Once this is acquired, the blood velocity data are segmented into voxels, which are units of graphical information defining a 3D space, and the phase shift is obtained at each voxel. These depend on the gyromagnetic ratio, the main magnetic field, the applied gradient field, and the position of the spin. This in turn depends on the initial position of the spin, the spin velocity, and the spin acceleration. Tau is the time that defines the fourth dimension.
These parameters are defined by the MRI and input into CFD simulations. The 3D flow velocity is determined by numerically solving the Navier-Stokes or NS equations. The NS equations are the governing equations of fluid motion solved to determine velocity and pressure distributions. They take into account the density, velocity, pressure, and dynamic viscosity of the flow.
We will now see how these principles of fluid dynamics are applied to real blood vessel geometries to produce high resolution CFD simulations.
Before starting, create a patient-specific vasculature model from MRA data. This can be done using open source software for image segmentation.
For this demonstration, a tetrahedral volume mesh was generated. Now open the vmtk launcher Python GUI. In the PypePad, enter in the necessary file name. This bare bones command will pull the input STL file from the desktop. Select Run, Run all to load the data into the program. A new window will open that displays instructions and a rendering of the input model.
Rotate the model and place the cursor on each inlet location. Press the space bar to place a seed on one inlet. Repeat this for all inlets. Then press Q to continue. Now repeat the same placement of seeds for all outlets. Press Q again and let the program run. The centerline file will be generated and saved to the desktop.
We are now ready to use the open source visualization tool ParaView to separate the voxels containing flow data from stationary tissue. Locate the following files: the patient-specific volume mesh, Centerline files, and the EnSight.case files and click OK to load the data onto the interface. Navigate to the Properties table and select Apply to load and read all the information. Then highlight the volumetric mesh in the pipeline browser.
In the Properties table, change the opacity value to between 0.2 and 0.5. The centerlines and geometric rendering should now be visible. Next, go to the top menu and select Filters, Alphabetical, Resample With Dataset, and set the source as the volume mesh and the input as the EnSight.case file. Click OK to continue, and apply the filter in the Properties table. Then, highlight the new Resample With Dataset and reduce the opacity.
From the top menu, change the centerlines from Surface to Points. To determine the boundary conditions, go to the right side of the interface and select the Split Horizontal Create View tool. Choose the SpreadSheet View option. From the Showing dropdown box, select the Centerline file and cycle through the files, selecting various points to identify a location within each inlet and outlet. Now use the SpreadSheet View to calculate the normal vector between two points.
After finding the vector, activate the ResampleWithDataset and select Filters, Alphabetical, Slice. Make sure the Slice filter appears, then go to the Properties table and set the plane origin as the same X, Y, Z point location for one of the two points used to calculate the normal vector. Use this to fill out the normal values, then select Apply. Activate the newly created Slice filter and select Filters, Alphabetical, Surface Flow. Click Apply, then activate the new Surface Flow item, followed by Filters, Alphabetical, Group Time Steps, Apply.
In SpreadSheet View, open the GroupTimeSteps data and use Export Spreadsheet or copy-paste to export this data to Microsoft Excel. Within ParaView, determine the Time Steps and the Time Step size by cycling through Time. For the simulation, we want the cardiac cycle to start at time equals zero. Therefore, generate the adequate time scale. Then activate the Slice filter and select Filters, Alphabetical, Integrate Variables.
From the pop-up, change Attribute to display Cell Data. This provide you with the cross-sectional area of the inlet slice. To make the flow data compatible with ANSYS Fluent, determine the time scale with units of seconds and the inlet velocity with units of meters per second.
The first line must contain a data name, a number of columns, number of rows, and a binary trigger for repeatability. The next line contains the names for each of the data columns. The flow velocities, not rates, are set underneath the respective column header. In order to simulate multiple cardiac cycles smoothly, the initial and final velocity values should be equivalent.
Chose File, Read, Case, and open the volume mesh .cas file that was used previously. Check the box for Display Mesh After Reading to show the mesh once imported. Select Scale and apply the necessary unit conversion to ensure correct physical size of the model. Select Materials Create/Edit, and input material properties for blood.
Now, select the Console command window and input file/. Use read-transient-table to import the transient flow waveforms located in the same location as the volume mesh .cas file. Use the waveforms obtained from the 4D flow MRI measurements to set the inlet boundary conditions. Then use a weighted ratio of inlet to outlet to set the outlet boundary conditions.
Set the numerical schemes used for pressure velocity coupling and discretization of the Navier-Stokes equations. Then, within Solution Initialization, set all the Initial Values to zero. Under Calculation Activities, designate a solution folder to save the results and specify the frequency with Autosave, Every Time Steps. Under Run Calculation, set up the Time Step Size from the Excel boundary conditions data. It is often preferable to select a smaller Time Step and allow Fluent to interpolate. Repeat for at least three cardiac cycles.
Finally, set the Max Iterations between 300 and 500. The software will automatically stop the iterations at each Time Step once the convergence occurs. After the simulation has been fully set up, go back to Initialization, Initialize. Return to Run Calculation and select Calculate to run the solver. The solution data can now be visualized in either ANSYS CFD-Post or ParaView software.
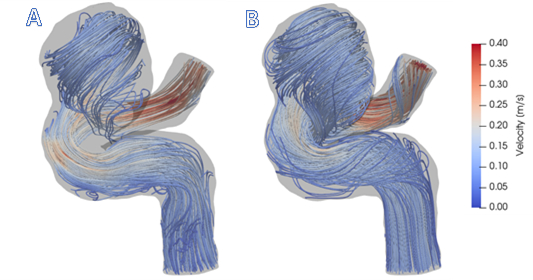
We will now examine some representative data. Here is an example of a cerebral aneurysm. From 4D flow MRI data, complex recirculating flow patterns within the aneurysmal region were detected. However, the resolution is limited in the regions of stagnant flow observed in the top and bottom section of the lesion. After running CFD simulations, higher resolution of the velocity field was obtained, particularly near the vessel walls.
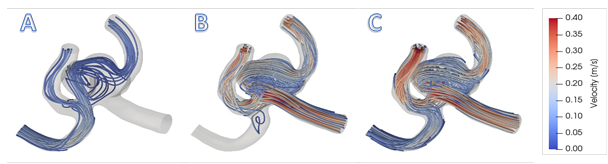
CFD can also be used to compare different flow conditions in the same vessel. For instance, simulations of a surgical clipping of the right and left anterior cerebral artery help visualize the effects of the procedure on flow dynamics.
Computational fluid dynamic simulations of blood flow are useful tools used in various biomedical applications.
For example, hemodynamic conditions within the vasculature affect development and progression of arterial diseases, including atherosclerosis and aneurysms. Since direct measurements are difficult to acquire in vivo, CFD is a standard research tool that is used to model blood flow dynamics. It can provide physicians guidance for diagnostics, as well as different treatment scenarios.
On top of vascular modeling, CFD simulations serve to simulate airflow based on nasal airway models. It is particularly useful to design protocols to deliver, in an adequate and controlled manner, pharmaceutical aerosols to targeted olfactory regions that interact directly with the brain.
You’ve just watched JoVE’s introduction to computational fluid dynamics to simulate blood flow. You should now understand how high resolution blood flow dynamics can be modeled based on three-dimensional vessel geometries. Thanks for watching!