Conducting Concurrent Electroencephalography and Functional Near-Infrared Spectroscopy Recordings with a Flanker Task
Instructor Prep
concepts
Student Protocol
Prior to the experimental tests, all participants signed informed consent documents. The protocol for the present study was approved by the Ethics Committee of the University of Macau.
1. Hardware and software setting for concurrent EEG and fNIRS recordings
- Construct a head cap for concurrent EEG-fNIRS recordings.
- Select the appropriate cap size according to the head circumference of participants. In this study, use a medium-size cap since it is suitable for most adolescent and adult participants.
- Design the layout of fNIRS optodes along with the EEG cap in the prefrontal cortex (Figure 1).
- Place EEG electrodes in the middle section of the fNIRS optodes to ensure the measurement of the same brain region by the two techniques19,30. However, due to the low spatial resolution of both EEG and fNIRS neuroimaging methods, place the electrodes in the corresponding brain area covered by fNIRS optodes rather than the exact locations of fNIRS channels.
- Make 22 holes inside the EEG cap to hold the fNIRS optodes in line with the specific layout in the prefrontal cortex. Identify and mark the locations of fNIRS optodes according to the designed layout of the head cap and then punch holes inside the cap to place and fix the optodes.
- Place 21 or 71 EEG electrodes along the surface of the EEG cap (see Table of Materials) according to the 10-20 International System and mount the grids for the optodes.
- Set the distance between each source-detector pair as 3 cm and then fix the optodes, in which the blue optodes denote the light detectors while the red ones represent the laser sources.
- Set the EEG and fNIRS ports in the software.
- Use the time triggers generated through the parallel port and serial port to ensure the synchronization of two different signals.
- Set the parallel port (e.g., H378 in this study) for the EEG system (see Table of Materials).
- Set the serial port (e.g., 6 9600 in this study) for the fNIRS system (see Table of Materials).
NOTE: The port type and number should be modified regarding various EEG and fNIRS setups. Please contact the manufacturers for more information.
2. Experimental preparation
- Warm up the fNIRS system with lasers switched on for 30 min.
- Set all necessary operation parameters for the fNIRS measurement system.
- Show the fused experimental setup including the EEG and fNIRS measurement systems to participants.
- Measure and mark the Cz point according to the 10-20 International System. Identify the electrode position of Cz at half of the distance between the inion and nasion and half of the distance between the left and right inter-aural indentations.
- Place the front part of the cap along the participant’s forehead first and then pull down the back section of the cap towards the neck.
- Validate the positions.
- Measure the distance between the Cz and inion and nasion again with a soft ruler, and double-check whether it is located at the midpoint. Likewise, measure the distance between the Cz and left and right inter-aural, and double-check whether the Cz is located at the midpoint.
- Prepare for the EEG recordings.
NOTE: It is highly recommended that the EEG electrodes be set up first and then the fNIRS optodes. If EEG conductive gel covers the holes for the placement of fNIRS optodes, it should be cleaned to prevent the contamination of optodes.- Fill conductive gel by inserting a blunt needle through the holes of the EEG electrode grid.
- Place all electrodes into the EEG electrode grid according to the labels.
- Open the EEG software and inspect the signal quality of EEG electrodes.
- Readjust the electrode by refilling conductive gel if the signal quality is not good enough to meet the requirements (40 mV).
- Readjust the electrode by refilling conductive gel if the impedance could not meet the requirements.
- Prepare for the fNIRS recordings.
Caution: Do not expose participants’ eyes to the laser beam of fNIRS sources directly.- Place the optical fibers along the holder arms attached to the fNIRS measurement system as well as the holder. Ensure that the fibers are neat and tidy.
- Insert the optical sources and detectors into the holes according to the layout.
- Test the signal quality. If a channel does not have a high-level signal-to-noise ratio (i.e., if the channel is marked in yellow), gently inspect the participant’s hair surrounding the optical probes to ensure that nothing exists between the optical probe and scalp.
- If step 2.8.3 cannot improve the signal quality, turn up the signal intensity. If there is too much signal (i.e., if the channel is marked in red), turn down the signal intensity.
3. Run the experiment
- Start the experiment when the signals are stable with excellent signal-to-noise ratio and participants are familiar with the experiment instructions. Use the classic Flanker paradigm for the experimental test29,31.
- After the experiment, save and export the data from both EEG and fNIRS.
- Remove EEG electrodes and fNIRS optical probes carefully.
4. Measurement of three-dimensional (3D) MNI coordinates of fNIRS optodes with 3D digitizer
- Let participants sit in a chair and wear the glasses with the sensor.
- Open the digitizer software on the computer. Ensure that the 3D digitizer system is in connection with the computer through an appropriate COM port.
- Load the layout of the optodes setting file.
- Move the 3D digitizer stylus across the key positions (Nz, Iz, left ear, right ear, Cz) along with the screen and press the button on the stylus.
- Localize the optical sources and detectors
- Export the 3D coordinates files.
5. Data analysis
- fNIRS data analysis
- Process the 3D MNI coordinates data by using the registration option in NIRS-SPM with MATLAB 2019. Select: stand-alone spatial registration | With 3D Digitize. Choose the previously saved others and origin text files and then select Registration.
- Pre-process fNIRS signals with Homer2 software32.
- Convert the raw data to optical density changes for different wavelengths and further convert to the concentration changes of HbO at different time points using a modified Beer-Lambert Law. Generally, the typically differential path length factor (DPF) value affected by the age, gender, and wavelength, and the distance between the source and decetor33,34 is 6, which is similar to the average DPF from previous studies34,35.
- Use the spline motion artifacts detection algorithm from the Homer2 fNIRS processing package for motion correction. Please select the appropriate methods of motion correction based on literature36.
- Process the raw hemoglobin continuous data by a low-pass filter of 0.2 Hz and subsequently a high-pass filter of 0.015 Hz.
- Normalize hemodynamic signal amplitude by dividing the averaged values.
- Generate the fNIRS data for each channel based on the 3D digitizer information. Select the channels that have a registration probability of 100% or more in the superior frontal cortex (SFC)according to the regression calculation of the NIRS-SPM for further analysis.
- Export the peak values of oxygen hemoglobin (HbO) concentration changes.
NOTE: In this study, only HbO signals were analyzed due to their high signal-to-noise ratio. The peak values of run-averaged HbO data were extracted for each channel from each participant for further analysis.
- EEG data processing
NOTE: Offline EEG data analysis was performed with the EEGLAB. Only N200 at Fz was the interesting component for the present study. All electrodes were subjected to an automatic artifact correction to remove eye movements by using an internal model of artifact topographies. Continuous EEG data were then segmented into different trials according to target and nontarget stimuli, in which the epoch for each trial lasted 2500 ms, involving a pre-stimulus period of 500 ms (baseline epoch) and a post-stimulus period of 2000 ms (task epoch).- Load the raw EEG data folder into the EEGLAB by using the plugins. Choose the BIOSIG plugin for the BDF file in this study.
NOTE: Please choose a suitable plugin according to the EEG data file format. - Set the channel location information for EEGLAB37. Load the corresponding location file of the cap.
- Re-reference electrodes in the ERPLAB, which is one plugin of EEGLAB. Choose the channels placed in the mastoids as reference electrodes.
- Extract EEG data epochs based on the event and bin files in the ERPLAB37.
- Filter the EEG data segments in the ERPLAB by using the FIR filter by filtering the low frequencies with a cutoff of 30Hz and by filtering the high frequencies with a cutoff of 0.1 Hz.
- Remove ocular EEG artifacts with the Independent Component Analysis in EEGLAB.
- Reject EEG data segments with amplitude values exceeding ± 100 µV at any channel in ERPLAB.
- Average the EEG data segments in ERPLAB.
NOTE: These are the generally used data analysis method and the software for processing EEG and the fNIRS data. There are numerous processing software and methods available.
- Load the raw EEG data folder into the EEGLAB by using the plugins. Choose the BIOSIG plugin for the BDF file in this study.
- Correlation calculation
- Generate the relationship between fNIRS and EEG recordings by using Pearson correlation analysis.
Conducting Concurrent Electroencephalography and Functional Near-Infrared Spectroscopy Recordings with a Flanker Task
Learning Objectives
Figure 2 shows the HbO signals for all channels while Figure 3 displays the ERPs at Fz and FCz for the two conditions of the Flanker task. Figure 4 illustrated the Pearson correlation analysis results showed that the fNIRS signals in SFC exhibited a significant correlation with the ERP N200 component at Fz for the incongruent condition (P<0.05). However, this is not the case for the congruent conditions (P>0.05).
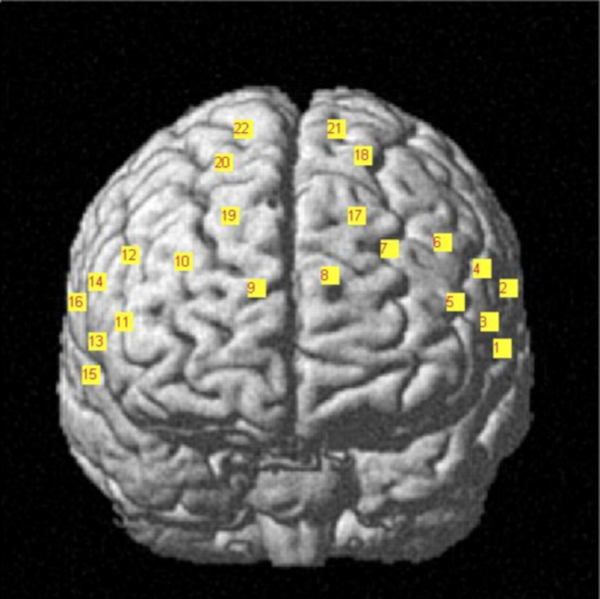
Figure 1. fNIRS headset placement and channel configuration. The digitized optodes layout are converted into the MNI coordinate system and then overlapped along the brain cortex Please click here to view a larger version of this figure.
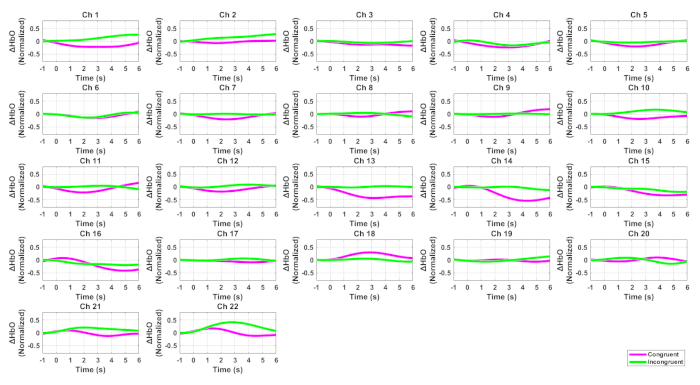
Figure 2. HbO signals for all channels associated with the Flanker task. The pink curves denote the incongruent condition while the green ones indicate the congruent condition. Please click here to view a larger version of this figure.
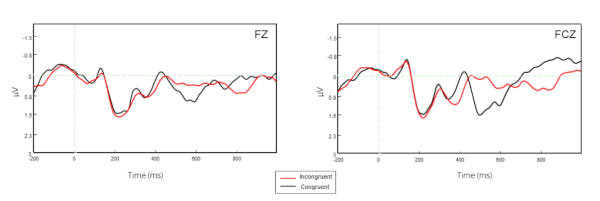
Figure 3. ERP signals for Fz and FCz electrodes. The black curves define the incongruent condition while the red ones denote the congruent condition. Please click here to view a larger version of this figure.
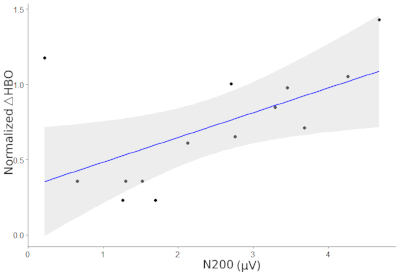
Figure 4: Correlation between the ERP N200 and HbO signals along the superior frontal cortex (SFC) for the incongruent condition. The regression coefficient between the two measurements is 0.59, p = 0.027. Please click here to view a larger version of this figure.
List of Materials
| EEG cap | EASYCAP GmbH | – | – |
| EEG system | BioSemi | – | – |
| fNIRS system | TechEn | – | CW6 System |
Lab Prep
Concurrent EEG and fNIRS recordings offer an excellent opportunity to gain a full understanding of the neural mechanism of cognitive processing by inspecting the relationship between the neural and hemodynamic signals. EEG is an electrophysiological technology that can measure the rapid neuronal activity of the cortex, whereas fNIRS relies on the hemodynamic responses to infer brain activation. The combination of EEG and fNIRS neuroimaging techniques can identify more features and reveal more information associated with the functioning of the brain. In this protocol, fused EEG-fNIRS measurements were performed for concurrent recordings of evoked-electrical potentials and hemodynamic responses during a Flanker task. In addition, the critical steps for setting up the hardware and software system as well as the procedures for data acquisition and analysis were provided and discussed in detail. It is expected that the present protocol can pave a new avenue for improving the understanding of the neural mechanisms underlying various cognitive processes by using the EEG and fNIRS signals.
Concurrent EEG and fNIRS recordings offer an excellent opportunity to gain a full understanding of the neural mechanism of cognitive processing by inspecting the relationship between the neural and hemodynamic signals. EEG is an electrophysiological technology that can measure the rapid neuronal activity of the cortex, whereas fNIRS relies on the hemodynamic responses to infer brain activation. The combination of EEG and fNIRS neuroimaging techniques can identify more features and reveal more information associated with the functioning of the brain. In this protocol, fused EEG-fNIRS measurements were performed for concurrent recordings of evoked-electrical potentials and hemodynamic responses during a Flanker task. In addition, the critical steps for setting up the hardware and software system as well as the procedures for data acquisition and analysis were provided and discussed in detail. It is expected that the present protocol can pave a new avenue for improving the understanding of the neural mechanisms underlying various cognitive processes by using the EEG and fNIRS signals.
Procedure
Concurrent EEG and fNIRS recordings offer an excellent opportunity to gain a full understanding of the neural mechanism of cognitive processing by inspecting the relationship between the neural and hemodynamic signals. EEG is an electrophysiological technology that can measure the rapid neuronal activity of the cortex, whereas fNIRS relies on the hemodynamic responses to infer brain activation. The combination of EEG and fNIRS neuroimaging techniques can identify more features and reveal more information associated with the functioning of the brain. In this protocol, fused EEG-fNIRS measurements were performed for concurrent recordings of evoked-electrical potentials and hemodynamic responses during a Flanker task. In addition, the critical steps for setting up the hardware and software system as well as the procedures for data acquisition and analysis were provided and discussed in detail. It is expected that the present protocol can pave a new avenue for improving the understanding of the neural mechanisms underlying various cognitive processes by using the EEG and fNIRS signals.