Science Education
>

Lower Limb Biomechanical Analysis of Healthy Participants

Instructor Prep
concepts
Student Protocol
JoVE 신문
의학
JoVE 비디오를 활용하시려면 도서관을 통한 기관 구독이 필요합니다.  전체 비디오를 보시려면 로그인하거나 무료 트라이얼을 시작하세요.
JoVE 신문 의학
Lower Limb Biomechanical Analysis of Healthy Participants

The method reported was followed in a study that received ethical approval from the Bournemouth University Research Ethics Committee (Reference 15005).

1. Participants

  1. Recruit healthy adults (aged from 23 to 63 years, mean ± S.D.; 42.0 ± 13.4, body mass 70.4 ± 15.3 kg, height 175.5 ± 9.8 cm; 15 males, 15 females) to participate in the study. Thirty participants were recruited for this study.
  2. Ensure that there is no self-reported history of dizziness, balance problems or walking difficulties in the participants.
  3. Ensure that participants did not suffer from any known neuromuscular injury or condition affecting balance or walking.

2. Setup and procedures for gait analysis

  1. Use a gait analysis system (Figure 1) comprised of a dual-belt force plate-instrumented treadmill, a 10-camera motion capture system and a virtual environment that provides optic flow.
  2. Ensure that the participant is wearing very tight non-reflective clothing such as cycling shorts or leggings.
  3. Using double sided adhesive tapes attach 25 passive reflective markers and place according to the lower body configuration of the Human Body Model (HBM)7 as detailed in Table 1 and Figure 2. The information in this document is taken from the HBM Reference Manual8.
  4. Use a joint ruler to take measurements of the required knee and ankle widths for the HBM6.
  5. Secure participant to a safety harness that is fastened to an overhead frame.
  6. Start a new session in the database and make sure it is active (highlighted).
  7. Using the subject tab, create a new participant from the Labeling Skeleton button.
  8. Browse to the 'LowerLimb HBM_N2.vst' file and then enter the name of the participant. The new participant appears in the Subjects pane.
  9. Go to the Tools pane and open the Subject Preparation tab.
  10. Zero level the forceplates via the Hardware tab. Make sure that no weight is exerted on the force plates.
  11. Prepare the participant for the ROM trial by having them ready in the middle of the treadmill.
  12. To ensure the participant can accustom themselves to the self-paced treadmill, ask them to walk at a comfortable speed for 5 min at the beginning of the session9,10.
  13. Following the acclimatization and without any delay time, ask the participant to walk for a minimum of 5 min10,11.
  14. Ensure participants are blinded to the timing of the recordings.
  15. Ensure to start the treadmill and start data recordings by clicking the Start recording button12. This can be done with integrated software (Table of Materials).
  16. Stop the recording after acquiring the desired amount of data. It is recommended to collect three sets of 25 cycles.
  17. Open the processing software (Table of Materials) and remove the high-frequency noise on data, by selecting a low-pass filter to the marker data such as a second order Butterworth filter with a cut-off frequency of 6 Hz.
  18. Go to File, and then select Export to save as a .csv.
  19. Determine individual strides from vertical force data and use the foot markers to ascertain gait events13.
  20. Analyze the gait parameters such as kinematic, kinetic and spatial-temporal data in Matlab R2017a (Supplementary File).

3. Setup and procedures for muscle strength test

  1. Use the muscle strength testing equipment (multimodal dynamometer) (Figure 3), to measure participants' muscle strength based on Maximum Voluntary Isometric Contraction (MVIC)14.
  2. Attach the tool/pad number 701 to the dynamometer exercise head.
  3. Test participant's right and left knee isometric muscle strength.
  4. Test participants in a seated position on a chair with a backrest.
  5. Using the up/down switch, align the dynamometer axis with the knee joint's anatomical axis of rotation. Place the pad of the tool centrally at the lower part of the shin of the tibia.
  6. Keep the knee at 90° flexion, the hip in neutral rotation and abduction, and the foot in plantar flexion.
  7. Place the participant's hands on their abdomen and stabilize the trunk, hips, and mid-thigh on the chair with Velcro straps.
  8. Run a practice trial for participants to get accustomed to the testing maneuver.
  9. Instruct the participant to extend their knee (exert pressure upwards on the pad) followed by flex (exert pressure downwards on the pad) to exert a maximum contraction on the command Go for 3 s.
  10. Provide verbal prompts and encouragement ("Push" for upwards and "Pull" for downwards) during the strength testing.
  11. Ensure that participants are aware they can stop the test immediately if they experience any unusual pain or discomfort.
  12. Allow participants to rest for 2 min.
  13. Repeat steps 3.1 – 3.12, three times for the left leg and right leg and record the data in newtons (N).
  14. Save all the data and export as a report for the analysis.

Lower Limb Biomechanical Analysis of Healthy Participants

Learning Objectives

The mean and standard deviation of the spatial-temporal, kinematics, and kinetic gait parameters are given in Table 2. MVIC data for all 30 participants are summarized in Table 3. A typical set of data for the left and right side of one participant showing graphical representation of gait parameters is provided in Figure 4 and Figure 5, respectively.

The data presented are representative of the results obtained across all participants, and are consistent with textbook reference results obtained for gait and isometric strength testing15.

Figure 1
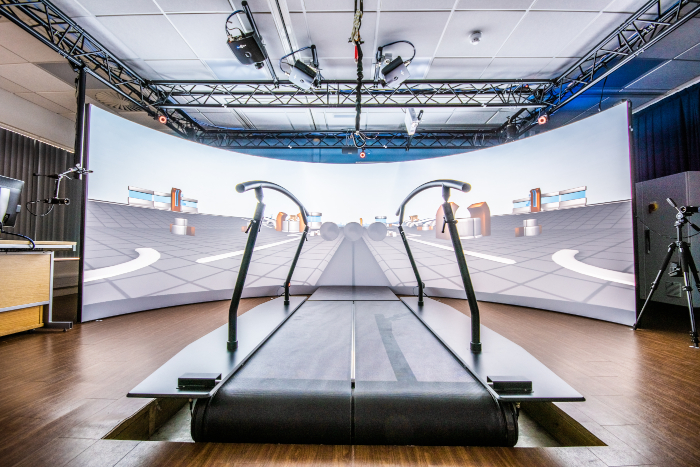
Figure 1: Gait analysis system. The GRAIL system is used to measure gait parameters. This system consists of a split-belt instrumented treadmill, 160° semi-cylindrical projection screen, force sensors, video cameras and optical infrared system. Please click here to view a larger version of this figure.

Figure 2
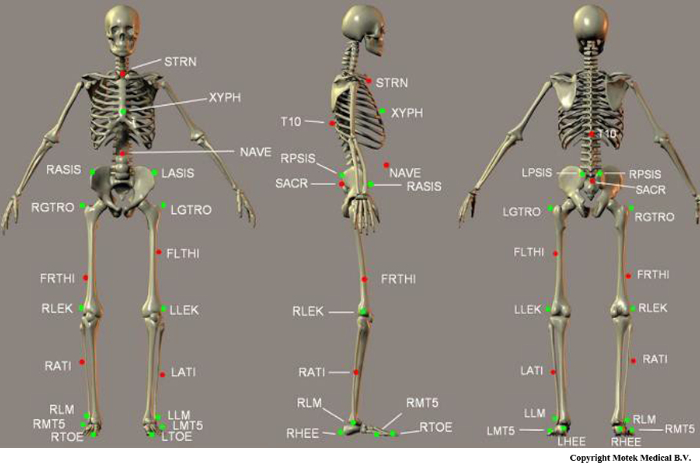
Figure 2: Diagram of markers used in Human Body Model (HBM). This figure shows the exact placements of all markers in the HBM lower body model. Special attention should be paid to the placement of the markers printed in green (bold in Table 1); these are used during initialization to define the biomechanical skeleton. This figure is adapted from the HBM Reference Manual8. Please click here to view a larger version of this figure.

Figure 3
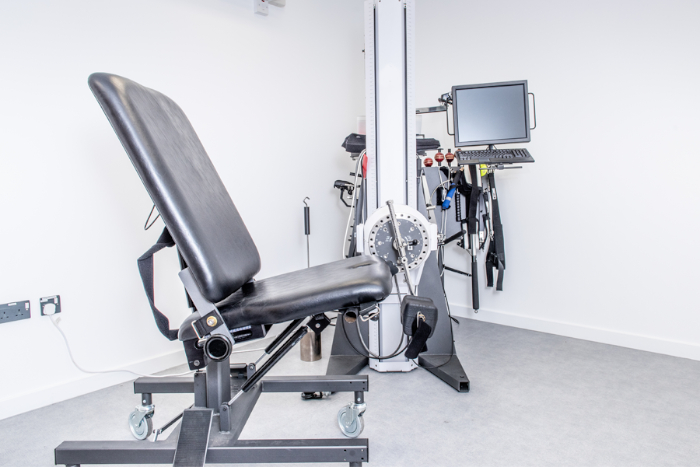
Figure 3: The muscle strength testing equipment (multimodal dynamometer) used to measure participants lower limb muscle strength. This system is used to measure the participants' muscle strength based on Maximum Voluntary Isometric Contraction (MVIC). Please click here to view a larger version of this figure.

Figure 4
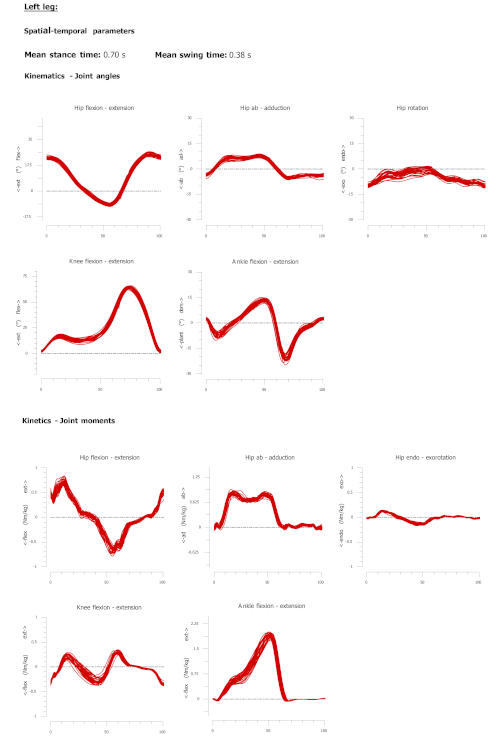
Figure 4: A sample report produced from offline analysis of the gait assessment using the proposed technique. Spatial temporal data and kinematic and kinetic gait cycle for the left side of one participant. Each line represents one gait cycle. The Y-axis represents the joint angles in degrees for the kinematic plots and joint moment in newton meter per kilogram for the kinetic plots. Red lines represent left side gait parameters. Please click here to view a larger version of this figure.

Figure 5
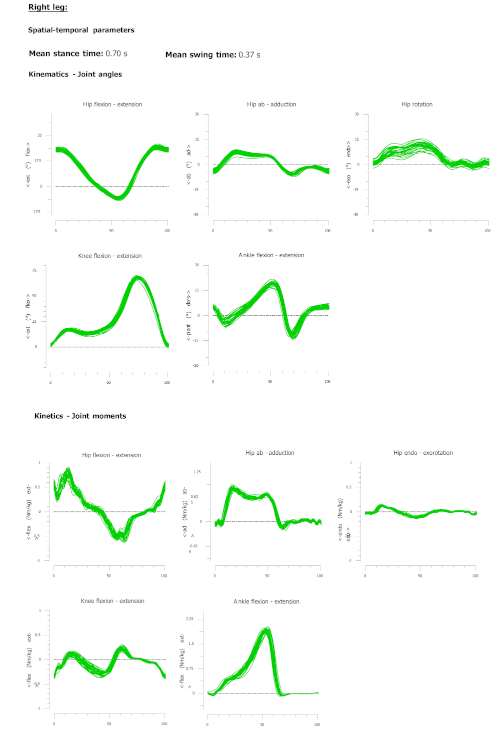
Figure 5: A sample report produced from offline analysis of the gait assessment using the proposed technique. Spatial temporal data and kinematic and kinetic gait cycle for the right side of one participant. Each line represents one gait cycle. The Y-axis represents the joint angles in degrees for the kinematic plots, and joint moment in newton meter per kilogram for the kinetic plots. The Green lines represent right side gait parameters. Please click here to view a larger version of this figure.

Label Anatomical location Description
T10 T10 On the 10th thoracic vertebrae
SACR Sacrum bone On the sacral bone
NAVE Navel On the navel
XYPH Xiphoid process Xiphiod procces of the sternum
STRN Sternum On the jugular notch of the sternum
LASIS Pelvic bone left front Left anterior superior iliac spine
RASIS Pelvic bone right front Right anterior superior iliac spine
LPSIS Pelvic bone left back Left posterior superior iliac spine
RPSIS Pelvic bone right back Right posterior superior iliac spine
LGTRO Left greater trochanter of the femur On the center of the left greater trochanter
FLTHI Left thigh On 1/3 on the line between the LGTRO and LLEK
LLEK Left lateral epicondyle of the knee On the lateral side of the joint axis
LATI Left anterior of the tibia On 2/3 on the line between the LLEK and LLM
LLM Left lateral malleolus of the ankle The center of left lateral malleolus
LHEE Left heel Center of the heel at the same height as the toe
LTOE Left toe Tip of big toe
LMT5 Left 5th meta tarsal Caput of the 5th meta tarsal bone, on joint line midfoot/toes
RGTRO Right greater trochanter of the femur On the center of the right greater trochanter
FRTHI Right thigh On 2/3 on the line between the RGTRO and RLEK
RLEK Right lateral epicondyle of the knee On the lateral side of the joint axis
RATI Right anterior of tibia On 1/3 on the line between the RLEK and RLM
RLM Right lateral malleolus of the ankle The center of right lateral malleolus
RHEE Right heel Center of the heel at the same height as toe
RTOE Right toe Tip of big toe
RMT5 Right 5th meta tarsal Caput of the 5th meta tarsal bone, on joint line midfoot/toes

Table 1: Markers used in the Human Body Model (HBM). This table shows the exact placements of all markers in the HBM lower body model. Special attention should be paid to the placement of the markers written in bold; these are used during initialization to define the biomechanical skeleton. This table is adapted from the HBM Reference Manual8.

Variable name Side Mean Standard Deviation
Spatial temporal
Walking speed (m/s) 1.37 0.22
Step length (m) Left 0.72 0.07
Right 0.73 0.07
Stride time (s) Left 1.07 0.10
Right 1.07 0.10
Stance time (s) Left 0.70 0.08
Right 0.70 0.08
Swing time (s) Left 0.37 0.03
Right 0.37 0.03
Kinematic
Hip Flex (deg) Left 30.05 9.08
Right 29.92 8.79
Hip Ext (deg) Left -13.26 7.75
Right -13.36 7.68
Hip Abd (deg) Left -7.27 3.00
Right -7.72 3.17
Hip Add (deg) Left 8.66 4.22
Right 7.81 3.72
Hip Int Rot (deg) Left 5.38 6.95
Right 6.82 6.42
Hip Ext Rot (deg) Left -9.04 7.03
Right -5.77 5.97
Knee Flex (deg) Left 67.46 5.16
Right 68.47 4.75
Knee Ext (deg) Left -0.43 2.26
Right -0.29 2.01
Ankle Flex (deg) Left -17.20 6.94
Right -14.91 6.47
Ankle Ext (deg) Left 18.13 5.92
Right 19.36 6.54
Kinetic
Peak Hip Ext (Nm/kg) Left 0.82 0.21
Right 0.80 0.24
Peak Hip Abd (Nm/kg) Left 0.91 0.15
Right 0.92 0.11
Peak Hip Int Rot (Nm/kg) Left 0.26 0.13
Right 0.26 0.14
Peak Knee Ext (Nm/kg) Left 0.38 0.06
Right 0.39 0.06
Peak Ankle Flex (Nm/kg) Left 1.85 0.21
Right 1.86 0.22

Table 2: The mean and standard deviation of the spatial-temporal, kinematics, kinetic gait parameters for the 30 participants. Gait parameters are reported for the left and the right side separately.

Variable name Side Mean Standard Deviation
Knee Ext Left 527.17 136.42
Right 550.60 132.55
Knee Flex Left 191.60 38.53
Right 203.87 47.67

Table 3: The mean and standard deviation of the Maximum Voluntary Isometric Contraction (MVIC) for knee joint using the muscle strength testing equipment for the 30 participants.

Supplementary File 1: Matlab coding file. Please click here to view this file (Right click to download).

List of Materials

701 Small lever Baltimore Therapeutic Equipment Company (BTE) Not Available – Online link provided in description The unique attachment designed for the Primus RS to measure Knee Extension/Flexion – https://store.btetech.com/collections/primus/products/701-small-lever
D-Flow Software – Vresion 3.26 Motekforce Link Not Available – Online link provided in description Software used to control GRAIL system – https://summitmedsci.co.uk/products/motek-dflow-hbm-software/
Gait Offline Analysis (GOAT) – Version 2.3 Motekforce Link Not Available – Online link provided in description Software used for the analysis of the gait parameters – https://www.motekmedical.com/product/grail/
Gait Real-time Analysis Interactive Lab (GRAIL) Motekforce Link Not Available – Online link provided in description GRAIL system measures and quantifies gait biomechanics by using a virtual reality based self-paced (SP) treadmill – https://www.motekmedical.com/product/grail/
Leg Pad for 701 Baltimore Therapeutic Equipment Company (BTE) Not Available – Online link provided in description The unique attachment designed for the Primus RS to measure Knee Extension/Flexion – https://store.btetech.com/collections/primus/products/701-802-leg-pad
Positioning Chair Baltimore Therapeutic Equipment Company (BTE) Not Available – Online link provided in description Participant Positioning Chair is designed for assessment and treatment of the lower exteremeties. The chair is designed for multiple positions. https://www.btetech.com/product/primus/
Primus RS Baltimore Therapeutic Equipment Company (BTE) Not Available – Online link provided in description Primus RS equipment captures and reports real time objective data in Isotonic, Isometric, and Isokinetic resistance modes – https://www.btetech.com/wp-content/uploads/BTE-Rehabilitation-Equipment-PrimusRS-Brochure-1.pdf

Lab Prep

Biomechanical analysis techniques are useful in the study of human movement. The aim of this study was to introduce a technique for the lower limb biomechanical assessment in healthy participants using commercially available systems. Separate protocols were introduced for the gait analysis and muscle strength testing systems. To ensure maximum accuracy for gait assessment, attention should be given to the marker placements and self-paced treadmill acclimatization time. Similarly, participant positioning, a practice trial, and verbal encouragement are three critical stages in muscle strength testing. The current evidence suggests that the methodology outlined in this article may be effective for the assessment of lower limb biomechanics.

Biomechanical analysis techniques are useful in the study of human movement. The aim of this study was to introduce a technique for the lower limb biomechanical assessment in healthy participants using commercially available systems. Separate protocols were introduced for the gait analysis and muscle strength testing systems. To ensure maximum accuracy for gait assessment, attention should be given to the marker placements and self-paced treadmill acclimatization time. Similarly, participant positioning, a practice trial, and verbal encouragement are three critical stages in muscle strength testing. The current evidence suggests that the methodology outlined in this article may be effective for the assessment of lower limb biomechanics.

Procedure

Biomechanical analysis techniques are useful in the study of human movement. The aim of this study was to introduce a technique for the lower limb biomechanical assessment in healthy participants using commercially available systems. Separate protocols were introduced for the gait analysis and muscle strength testing systems. To ensure maximum accuracy for gait assessment, attention should be given to the marker placements and self-paced treadmill acclimatization time. Similarly, participant positioning, a practice trial, and verbal encouragement are three critical stages in muscle strength testing. The current evidence suggests that the methodology outlined in this article may be effective for the assessment of lower limb biomechanics.

Tags