The following protocol follows the guidelines set forth by and has been approved by the University Institutional Review Board to ensure safe and ethical human subject research. All subjects provided informed consent for participation in the research studies and dissemination of data. The full protocol takes approximately 20 minutes to perform by a trained sonographer. However, individual measurements may be taken per assessment need.
1. Marking of the skin
- Ask the participant to be seated at the end of a plinth with their legs hanging off the table.
- Palpate and mark the medial tibial plateau and most distal aspect of the medial malleolus bilaterally. Measure the distance between the ipsilateral markings to determine tibial length.
- Calculate 25% of the tibial length. Measure and mark this distance, distal from the medial tibial plateau, to indicate the location for gastrocnemius measurements (Figure 1).
- Calculate 30% of the tibial length. Measure and mark this distance, proximal from the most distal aspect of the medial malleolus, to indicate the location for soleus measurements (Figure 1).
- Record the 25% and 30% tibial length for longitudinally measuring the same location during future evaluations.
- Ask the participant to move into a prone position on the plinth with the knees fully extended and their feet hanging relaxed off the edge of the plinth with ankles in a resting position (Figure 2).
- Transfer the gastrocnemius and soleus markings to the posterior aspect of the lower leg. Palpate and mark the midpoint of the gastrocnemius (the distal most point between the two muscle bellies). Ask the participant to gently plantarflex against manual resistance to palpate this location.
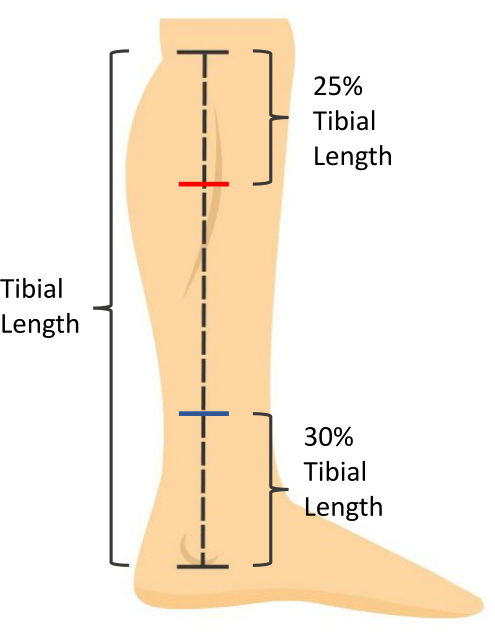
Figure 1: Skin measurement markings. Tibial length is measured as the distance from the medial tibial plateau to the most distal aspect of the medial malleolus. Soleus muscle thickness is measured at 30% of the tibial length proximal to the most distal aspect of the medial malleolus (blue mark). Gastrocnemius muscle CSA is measured at 25% of the tibial length distal to the medial tibial plateau (red mark). Please click here to view a larger version of this figure.
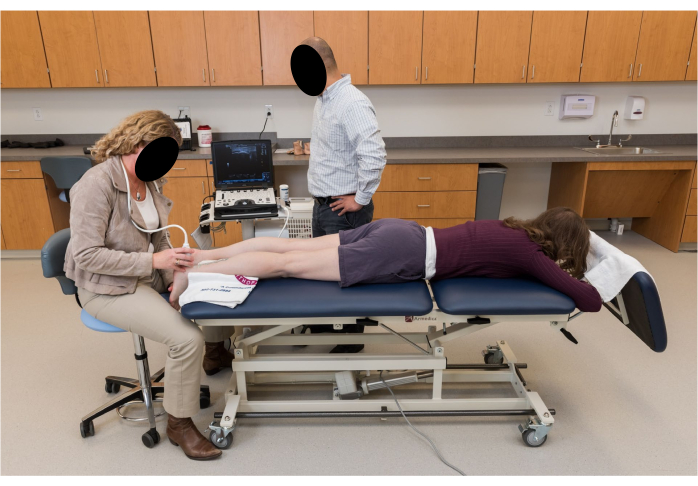
Figure 2: Participant positioning for ultrasound imaging. The participant is prone with knees fully extended and feet hanging relaxed in a resting ankle position off the edge of the plinth. Please click here to view a larger version of this figure.
2. Ultrasound imaging
NOTE: All images will be taken on both legs. All images should be taken along the midline of the Achilles tendon. Use palpation of the medial and lateral borders of the Achilles tendon to determine midline location.
- Use B-mode ultrasound with a 5 cm linear array transducer with parameters set for visualization of the triceps surae. Set frequency to 10 MHz and depth of measurement to 3.5 cm for visualization. Adjust the foci between 0.75 cm and 1.75 cm with gain adjusted to 49 for optimal visualization of tissue.
NOTE: Depth, foci, and gain may be adjusted as appropriate for visualization. - Place ultrasound gel on the posterior calcaneus. Holding the probe on the long axis, visualize the proximal calcaneal notch and align the notch with the midpoint of the ultrasound probe. Mark this location on the skin (Figure 3).
- Marking the skin for measurement of Achilles tendon thickness and CSA will vary depending on the participant. Use the following guidelines to determine this position.
- For healthy individuals, measure 2 cm proximal from the proximal calcaneal notch and mark this location on the skin.
- For individuals with Achilles tendinopathy, visualize the thickest portion of the Achilles tendon with the ultrasound probe on the long axis and mark this location on the skin. Record the distance of this marking from the proximal calcaneal notch forlongitudinally measuring the same location during future evaluations.
- For individuals with Achilles tendinopathy without visible fusiform thickening, mark the skin at the location of most tendon pain upon palpation. Record the distance of this marking from the proximal calcaneal notch for longitudinally measuring the same location during future evaluations.
- For individuals post Achilles tendon rupture, visualize the location of rupture with the ultrasound probe in the long axis and mark this location on the skin. Record the distance of this marking from the proximal calcaneal notch for longitudinally measuring the same location during future evaluations.
- For the uninvolved limb, make the skin marking at the same distance from the proximal calcaneal notch as the involved limb.
- Gastrocnemius tendon length (Full tendon length): Using an extended field-of-view and holding the probe on the long axis, begin the image at the calcaneus by visualizing the Achilles tendon insertion. Glide the probe proximally along the midline of the Achilles tendon towards the mark at the gastrocnemius midpoint until the myotendinous junction is visualized. This will end the image. Take three images of the Achilles' full tendon length (Figure 4).
- Soleus tendon length (Free tendon length): Using an extended field-of-view and holding the probe on the long axis, begin the image at the calcaneus by visualizing the Achilles tendon insertion. Glide the probe proximally along the midline of the Achilles tendon towards the mark at the soleus until the soleus myotendinous junction is visualized. Take three images of the Achilles' free tendon length.
- Achilles tendon thickness: Using the B-mode view, place the probe on the long axis on the skin marking made for Achilles tendon thickness and CSA (step 2.3). Take three images of Achilles tendon thickness.
- Achilles tendon cross-sectional area: Using the B-mode view, place a gel standoff pad on the skin marking made for Achilles tendon thickness and CSA (step 2.3). Holding the probe on the short axis, take three images of the Achilles tendon cross-section.
NOTE: Tendon is of an anisotropic quality; depending on the angle of the sound waves, it will reflect back, making it look bright, or reflect away, making it look dark (Figure 5). Therefore, toggling the probe back and forth will help with visualizing the border of the tendon. - Soleus thickness: Using the B-mode view, place the probe on the long axis on the skin marking made for the soleus (30% of the tibial length from the distal aspect of the medial malleolus). Visualize the anterior border of the soleus muscle. Take three images for soleus thickness19.
- To distinguish between the soleus and flexor hallucis longus, have the participant actively flex and extend the great toe. This will cause movement of the fibers of the flexor hallucis longus without moving the soleus fibers.
- Gastrocnemius cross-sectional area: Using an extended field-of-view, hold the ultrasound probe on the short axis and in line with the mark for the gastrocnemius (25% of the tibial length from the medial tibial plateau). Visualize the medial border of the medial gastrocnemius and begin the image by gliding the probe from medial to lateral until the lateral border of the lateral gastrocnemius is visualized. Take three images for gastrocnemius CSA13.
- To capture the most medial aspect of the medial gastrocnemius it may be needed to ask the participant to abduct their legs and internally rotate the hip slightly. If this is required, ensure the participant is not plantarflexing their foot, as this will impact measurements.
- Using the B-mode view, determine the presence or absence of calcifications within the Achilles tendon (Figure 6D) and/or at the Achilles tendon insertion (enthesis; Figure 6C). These calcifications are unattached from the calcaneus and appear as hyperechoic areas with a shadow below, present in multiple planes of view. Take an image to confirm the findings. Note whether the calcifications occur within the Achilles tendon or at the enthesis.
- Using the B-mode view, determine the presence or absence of bursitis. This is visualized by a hypoechoic area deep to the Achilles tendon at the proximal calcaneus (retrocalcaneal bursitis) and/or superficial to the Achilles tendon insertion (subcutaneous calcaneal bursitis). Take an image to confirm the findings (Figure 6B).
- Using the Doppler setting on the ultrasound, assess for the presence or absence of neovascularization within the Achilles tendon.
- Position the Doppler box (i.e., region of interest) on the tendon, hold the ultrasound probe still, and avoid pressing down or distending the tissue as this may occlude and prevent visualization of blood flow.
- Scan the length of the Achilles free tendon, being sure to assess each portion of the tendon without movement of the probe to prevent artifact. If there is vasculature visible within or in contact with the tendon, take three, 3 s videos in the region with maximal blood flow (Figure 6A).
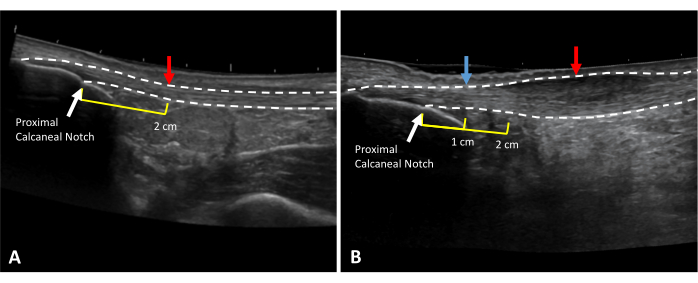
Figure 3: Achilles tendon thickness and CSA measurement locations. Extended field of view ultrasound images of (A) a healthy and (B) tendinopathic Achilles tendon. Dotted lines indicate tendon borders. Red arrows indicate measurement locations. Yellow lines indicate the distance proximal to the proximal calcaneal notch (white arrow). In the case of thickening at the 2 cm mark (B), healthy tendon thickness should be taken at a healthy area in the free tendon (blue arrow). Please click here to view a larger version of this figure.
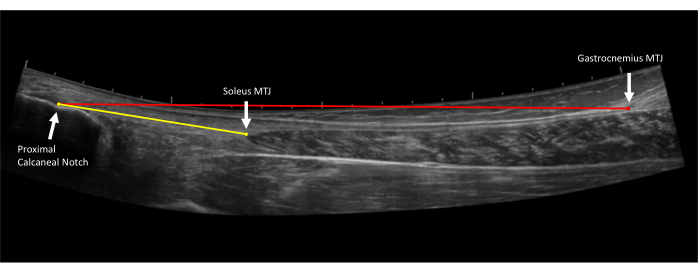
Figure 4: Achilles tendon length measurements. Extended field of view ultrasound image of the Achilles tendon. Free tendon length (yellow line) is measured from the proximal Achilles tendon insertion on the proximal calcaneal notch to the soleus myotendinous junction (MTJ). Full tendon length (red line) is measured from the proximal Achilles tendon insertion on the proximal calcaneal notch to the gastrocnemius myotendinous junction (MTJ)10. Please click here to view a larger version of this figure.
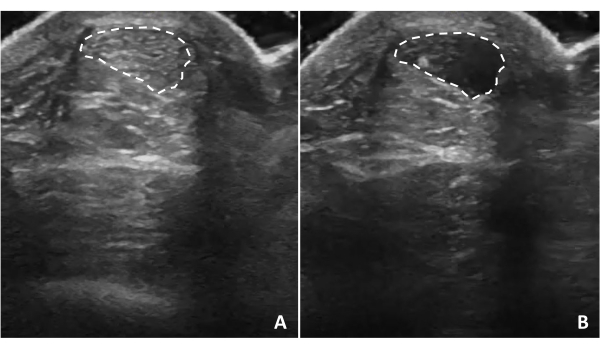
Figure 5: Tendon anisotropy. Achilles tendon anisotropy occurs when the ultrasound waves are not perpendicular to the structure. Tilting the ultrasound probe will cause the tendon structure to appear (A) hyperechoic or (B) hypoechoic depending on the relationship of ultrasound waves to the tendon. Dotted lines indicate tendon borders. Please click here to view a larger version of this figure.
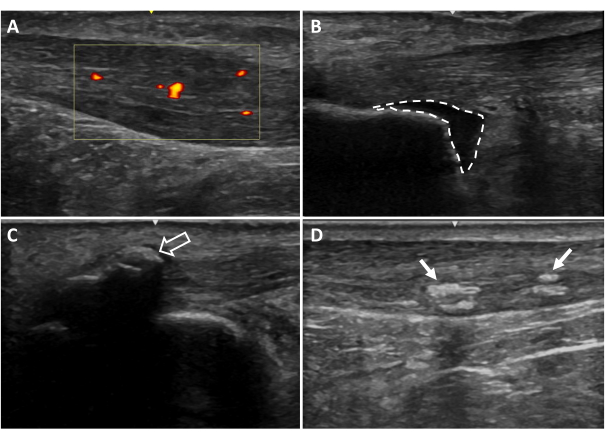
Figure 6: Additional ultrasound imaging findings. (A) Neovascularization, (B) retrocalcaneal bursitis, (C) entheseal calcifications, (D) intratendinous calcifications. Areas colored red and yellow indicate blood flow within the tendon region of interest (yellow box). Dotted lines indicate bursa borders. Arrows indicate calcifications20. Please click here to view a larger version of this figure.
3. Ultrasound measurements
NOTE: Ultrasound measurements can be made on the machine based on the settings and tools for the respective ultrasound machine. Images can also be exported for taking measurements on software such as Osirix DICOM viewer. The average of the three trials for each measure will be used for analysis.
- Gastrocnemius tendon length (full tendon length): Open the longer extended field-of-view tendon image (taken in step 2.4). Measure from the most proximal point of the tendon insertion (proximal calcaneal notch) to the gastrocnemius myotendinous junction (Figure 4).
- Soleus tendon length (free tendon length): Open the shorter extended field-of-view tendon image (taken in step 2.5). Measure from the most proximal point of the tendon insertion (proximal calcaneal notch) to the soleus myotendinous junction (Figure 4).
- Tendon thickness at 2 cm: Open the shoter extended field-of-view tendon image. Measure from the most proximal point of the tendon insertion (proximal calcaneal notch) to 2 cm, with the end of the measurement on the deep border of the tendon. Measure from this point on the deep border of the tendon to the direct superficial aspect of the tendon to get the 2 cm tendon thickness. This measure should represent healthy tendon thickness (Figure 7A).
- In the case of Achilles tendinopathy, if the tendon is thickened at this 2 cm distance, locate a healthy area in the free tendon to take this measurement and document the distance from the proximal calcaneal notch (Figure 7B).
NOTE: Thickness is used to describe the raw thickness of the tendon from the most superficial to deep.
- In the case of Achilles tendinopathy, if the tendon is thickened at this 2 cm distance, locate a healthy area in the free tendon to take this measurement and document the distance from the proximal calcaneal notch (Figure 7B).
- Tendon cross-sectional area: Open image taken in step 2.7. Visually identify the borders of the Achilles tendon and outline the circumference of the tendon (Figure 8A).
- Tendon thickness: Open image taken in step 2.6. At the center of the image, measure the Achilles tendon from the superficial border to the deep border of the tendon (Figure 8B).
- Soleus thickness: Open image taken in step 2.8. At the center of the image, measure from the superficial border to the deep border of the soleus muscle (Figure 9).
- Gastrocnemius cross-sectional area: Open image taken in step 2.9. Visualize the borders of both the medial and lateral heads of the gastrocnemius and outline the medial gastrocnemius and then the lateral gastrocnemius heads (Figure 10).
- Achilles tendon thickening: Use this calculation to determine the degree of thickening of the tendon in Achilles tendinopathy. Subtract thickness at 2 cm (or adjusted location; Figure 7A) from tendon thickness (Figure 7B) to obtain tendon thickening (measurement in step 3.5 minus measurement in step 3.3).
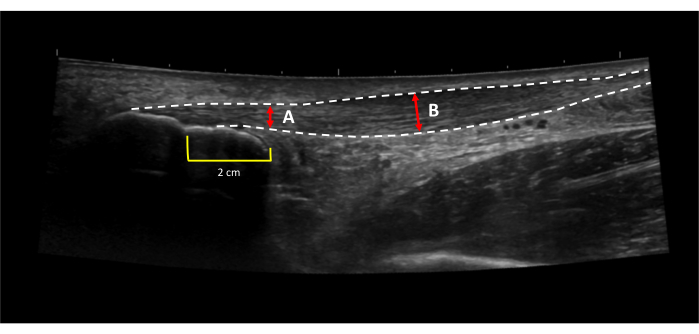
Figure 7: Achilles tendon thickening. Achilles tendon thickening is calculated by subtracting (A) the thickness of the healthy portion of the tendon from (B) the thickness of the thickest portion of the tendon31. Dotted lines indicate tendon borders. Red lines indicate tendon thickness. Yellow lines indicated a 2 cm distance proximal to the proximal calcaneal notch. Please click here to view a larger version of this figure.
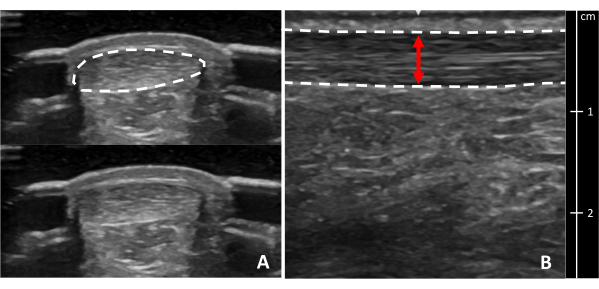
Figure 8: Achilles tendon cross-sectional area and thickness. Ultrasound images of the Achilles tendon in (A) cross-section and (B) longitudinal view at the thickest portion. Dotted lines indicate tendon borders. The red line indicates tendon thickness. A cross-section of the tendon is shown with and without a border for clarity. Please click here to view a larger version of this figure.
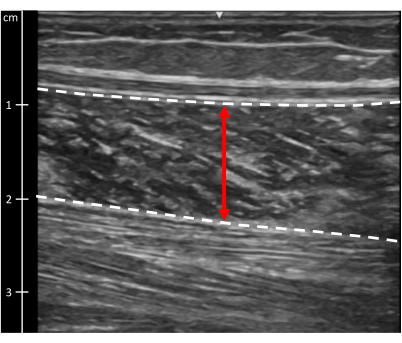
Figure 9: Soleus muscle thickness. Ultrasound image of the soleus muscle. Dotted lines indicate muscle borders. The red line indicates muscle thickness. Please click here to view a larger version of this figure.
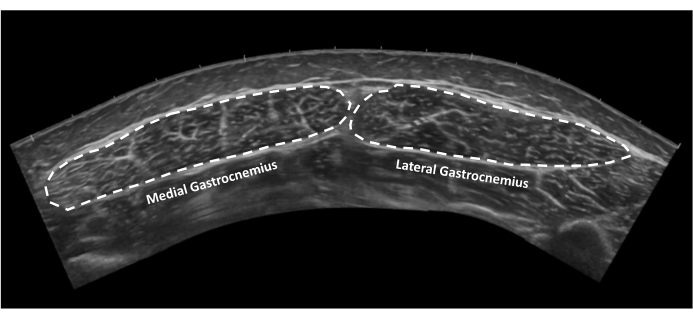
Figure 10: Gastrocnemius muscle cross-sectional area. Extended field of view ultrasound image of medial and lateral gastrocnemius muscles in cross-section. Dotted lines indicate tendon borders. Please click here to view a larger version of this figure.