DNA methylation is capable of maintaining stable levels of gene expression as well as allowing for dynamic changes in gene expression in response to a variety of stimuli. We detail techniques that allow the study of gene-specific changes in DNA methylation and the effect of these changes on gene expression.
DNA methylation serves to regulate gene expression through the covalent attachment of a methyl group onto the C5 position of a cytosine in a cytosine-guanine dinucleotide. While DNA methylation provides long-lasting and stable changes in gene expression, patterns and levels of DNA methylation are also subject to change based on a variety of signals and stimuli. As such, DNA methylation functions as a powerful and dynamic regulator of gene expression. The study of neuroepigenetics has revealed a variety of physiological and pathological states that are associated with both global and gene-specific changes in DNA methylation. Specifically, striking correlations between changes in gene expression and DNA methylation exist in neuropsychiatric and neurodegenerative disorders, during synaptic plasticity, and following CNS injury. However, as the field of neuroepigenetics continues to expand its understanding of the role of DNA methylation in CNS physiology, delineating causal relationships in regards to changes in gene expression and DNA methylation are essential. Moreover, in regards to the larger field of neuroscience, the presence of vast region and cell-specific differences requires techniques that address these variances when studying the transcriptome, proteome, and epigenome. Here we describe FACS sorting of cortical astrocytes that allows for subsequent examination of a both RNA transcription and DNA methylation. Furthermore, we detail a technique to examine DNA methylation, methylation sensitive high resolution melt analysis (MS-HRMA) as well as a luciferase promoter assay. Through the use of these combined techniques one is able to not only explore correlative changes between DNA methylation and gene expression, but also directly assess if changes in the DNA methylation status of a given gene region are sufficient to affect transcriptional activity.
Epigenetics is the study of chemical modifications that can affect the transcriptional activity of the genome. Essentially, without a change in the DNA sequence, epigenetic modifications such as DNA methylation, histone acetylation, and histone methylation are sufficient to reversibly alter patterns of gene expression 1. DNA methylation, a potent regulator of gene expression, is the most well characterized epigenetic modification. DNA methylation is the covalent attachment of methyl groups on the C5 position of a cytosine, typically the cytosine of a cytosine-guanine dinucleotide, also known as a CpG site. Areas that contain a high density of CpG sites are known as CpG islands (CGIs). CGIs are frequently associated with transcriptional start sites (TSS) and gene promoters 1-3. Thus, while changes in DNA methylation at CGIs are not always concomitant with changes in cellular expression or function, changes in DNA methylation at CGIs can exert powerful regulation on transcriptional activity 2.
Historically, DNA methylation was observed to be essential in embryogenesis, imprinting, and development, with little changes in the levels of DNA methylation occurring in post-mitotic cells (with the exception of alterations in cancer-related genes) 4,5. However, the field of neuroepigenetics has highlighted an important non-developmental role for DNA methylation. Specifically, cognitive epigenetics has redefined DNA methylation as a highly plastic mechanism integral in mediating both the transcriptional activation and repression of genes essential for the process of learning and memory 6. Apart from cognitive epigenetics, studies modeling ischemic injury and neuropathic pain characterize DNA methylation as a labile mechanism that responds rapidly to a variety of CNS insults 7-9. In regards to astrocytes, several lines of evidence suggest DNA methylation plays an important role in astrogliogenesis. Fan et al., found that conditional KO of DNMT1 in neural progenitor cells (NPCs) resulted in precocious development of astrocytes concordant with a global state of hypomethylation 10. Additionally, Perisic et al., concluded differential levels of DNA methylation of the GLT-1 promoter mediated differential levels of expression of the glutamate transporter in the cortex and cerebellum, emphasizing a role in DNA methylation in establishing brain-region specific patterns of astrocytic gene expression 11. Overall, numerous studies underscore the dynamic and labile nature of DNA methylation in the CNS as environment, drugs, and injury have all been shown to change DNA methylation and often, gene expression 4,9. Together, these neuroepigenetic studies point to DNA methylation as a feasible therapeutic target with the potential to mitigate a variety of CNS pathologies.
As the field of epigenetics expands its understanding of the role of DNA methylation in neurodevelopment and disease, the challenge of moving DNA methylation towards a therapeutic target is performing not only correlative, but causative studies that define specific gene targets and sites. Additionally, surveying changes in DNA methylation specific to brain region and cell type remains an ongoing and time worthy challenge unique to the field of neuroepigenetics. This protocol utilizes a variety of techniques including fluorescence-activated cell sorting (FACS) of astrocytes, methylation-sensitive high resolution melt analysis (MS-HRM), and a methylation luciferase assay to investigate the DNA methylation status of KCNJ10, a gene that encodes for Kir4.1. Kir4.1 is a glial specific potassium channel that demonstrates both brain region and cell specific patterns of expression in the CNS 12-16. Kir4.1 expression increases moving from rostral to caudal CNS regions, with the highest expression occurring in the spinal cord 15. Although the channel is expressed in ependymal cells, oligodendrocytes and their precursor cells, Kir4.1 is predominantly expressed in astrocytes and thought to be essential for maintaining homeostatic levels of potassium as well as supporting glutamate uptake by setting the astrocytic resting membrane potential at a hyperpolarized -80mV 12,16-19. Importantly, the expression of Kir4.1 is non-static both during development and following multiple forms of CNS injury 20-25. We wished to examine the epigenetic regulation of this channel, specifically in astrocytes during development. The techniques utilized offer gene-specific and targeted CpG site analyses that provide causal evidence for a role of DNA methylation in regulating KCNJ10 gene expression. These techniques can be applied to other genes.
All animals were handled in accordance with the National Institutes of Health guidelines. The Animal Care and Use Committee at the University of Alabama at Birmingham approved animal use.
1. Obtaining RNA and DNA from an Enriched Astrocytic Population using Fluorescent Activated Cell Sorting (FACS) of Astrocytes from Whole Brain Tissue
2. Assessing DNA Methylation Status of a Gene using Methylation-sensitive High Resolution Melt Analysis (MS-HRMA)
3. Assessing Hyper-methylated Promoter Activity via Use of Luciferase Assay
An enriched population of astrocytes was acquired via FACS sorting of eGFP-S100β transgenic animals 27. Due to decreasing quality of cells and molecular molecules isolated from animals older than postnatal day 50 (p50), animals aged p0-p40 are optimal for such experiments. Cortical tissue was used for these experiments. Cortices from two to six animals were pooled together. FACS was performed at UAB Comprehensive Flow Cytometry Core facility. Sorting was performed on Becton Dickinson FacsAria II. eGFP excitation was obtained using 488 nm laser; no compensation was necessary. A gated population was targeted based on forward and side scatter (Figure 1B). A live cell population was determined using an ethidium bromide dead cell indicator and gated (Figure 1C). Two different populations were observed based on the eGFP profile (Figure 1D). Through empiric testing, the cell population with higher eGFP profile was identified as the eGFP-positive cell population (Figure 1F-F''). Visual analysis of the second population with a lower eGFP profile revealed cell fragments expressing eGFP, but devoid of nuclei, likely representing debris from astrocytic processes (Figure 1G-G''). Representative images of dissociated eGFP positive astrocytes following dissociation but prior to sorting (Figure 2A) and after sorting (Figure 2B) are shown. Isolated eGFP positive cell population demonstrated a 40-fold increase in ALDH1L1 mRNA, an astrocytic specific marker 39 (Figure 2C). Additionally, despite shared expression of S100β in NG2+ OPCs and astrocytes 39, we observed a 4-fold reduction of NG2 mRNA, a marker for oligodendrocyte precursor cells 39, indicating isolation of an enriched astrocytic cell population (Figure 2C-D). RNA and DNA isolated from FACS sorted astrocytes were of sufficient quality and quantity to be used for subsequent methylation studies. Total RNA and DNA isolated from varying ages and number of animals is listed as a reference for expected yield of molecular molecules following FACS (Table 5). It should be noted that the yield will also vary based on number of animals utilized, incubation period, and experience of researcher. Table 6 demonstrates the variability of events acquired depending on number of animals utilized and incubation periods.
For methylation studies, starting with high quality and sufficient quantities of DNA is essential for successful downstream applications. To ensure sufficient lysis of tissue for RNA or DNA extraction, all homogenization of tissue or cells was followed by trituration using a 23G needle 7x, taking care to avoid frothing during lysis. Once high quality DNA is extracted and bisulfite converted, regions of interest can be targeted for MS-HRMA. Note that when assessing quality and concentration of bisulfite converted DNA, spectrophotometer should be set to read at an OD factor of 33 as bisulfite converted DNA is single stranded. The 260/280 values for bisulfite converted DNA ranged from 2.20-2.70.
Before beginning methylation studies, it is critical to appropriately select and calibrate a thermal cycler for MS-HRMA studies. Additionally, one must determine how to export and utilize raw data generated from MS-HRMA. Applied Biosystems High Resolution Melting Getting Started Guide was utilized to assist in calibrating the 7900HT thermal cycler. Finally, data was extracted and imported into HRM analysis software for subsequent data analysis. As detailed in the protocol, pre and post start and stop parameters were set near the transitions of the melt curve. Peak temperature differences were used to extrapolate methylation status of unknown samples. Estimated methylation data acquired from MS-HRMA corresponded closely to methylation data generated from pyrosequencing (pyrosequencing data was generated in house using primers targeting same regions as MS-HRM primers) (Figure 3C) 15.
A dual luciferase assay was utilized to assess the transcriptional activity of hyper-methylated regions of the gene of interest (Figure 4A). Each CpG-island-luc2 plasmid was linearized and then methylated. However, because both the insert (CpG island) and vector (luc2) are methylated during the reaction, one must excise the methylated insert and re-ligate to a non-methylated vector. Due to extensive manipulation of the plasmid, significant losses occur and one must begin with sufficient starting material. HpaII digestion was utilized to verify the methylation status of each plasmid as HpaII only digests non-methylated DNA (Figure 4B). It should be noted that if O/N methylation is insufficient, an additional 1x of SAM and 1x of CpG methylase may be added following 1 hr of incubation at 30 °C. Continue O/N incubation following addition of supplemental SAM and CpG methylase. Generation of methylated and non-methylated CpG-island-luc2 plasmid allows for direct assessment of changes between DNA methylation and transcriptional activity via measurement of luciferase activity.
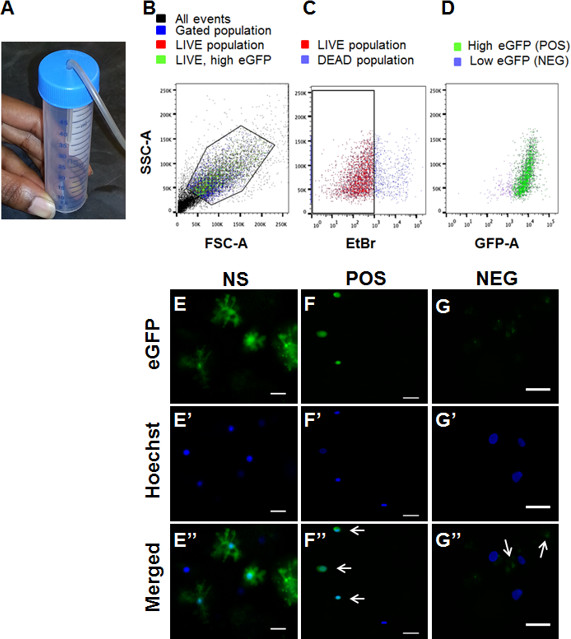
Figure 1. FACS sorting isolates eGFP+ cell popoulation. (A) Use of a 50 ml conical tube with hole cut on the top allows for surface gas exchange during papain digestion. (B) Sorted cells were gated based on forward and side scatter plots. (C) An ethidium bromide based dead cell indicator was utilized to gate a live cell population (red). (D) Live cell population demonstrated two populations – one with a high eGFP profile (green) and a low eGFP profile (purple). For all graphs, y-axis represents side scatter area (SSC-A); x-axis represents forward side scatter area (FSC-A), green fluorescent protein area (GFP-A), or ethidium bromide (EtBr). (E-G) Dissociated cells were incubated with Hoechst and 20 µl of dissociated cells was placed on coverslip and imaged. (E-E'') eGFP+ astrocytes, with extensive processes were visualized before sorting (NS). (F-F'') Following sorting, high eGFP+ population (POS) demonstrate eGFP+ cell soma which co-localize with Hoechst staining. (G-G'') Low eGFP population demonstrates eGFP+ staining which did not co-localize with Hoechst staining, likely representing astrocytic debris (for all images, scale = 20 µm). Please click here to view a larger version of this figure.
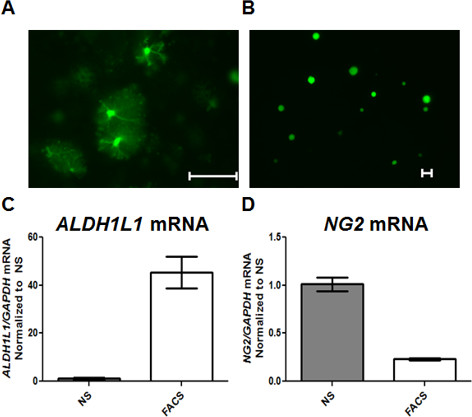
Figure 2. FACS sorting of eGFP-S100β transgenic animals provides enriched population of astrocytes. (A) 20 µl of dissociated cells before FACS (NS) are shown, processes remain intact (scale =50 µm). (B) Representative image post-FACS (FACS) cells are shown; astrocytic processes are removed and cell soma remains (scale =20 µm). (C) qPCR data demonstrates a 40-fold increase in ALDH1L1 mRNA in FACS sorted cells (FACS) compared to not sorted population (NS). (D) NG2 mRNA is reduced by 4-fold in FACS sorted cells compared to not sorted population (NS). Please click here to view a larger version of this figure.
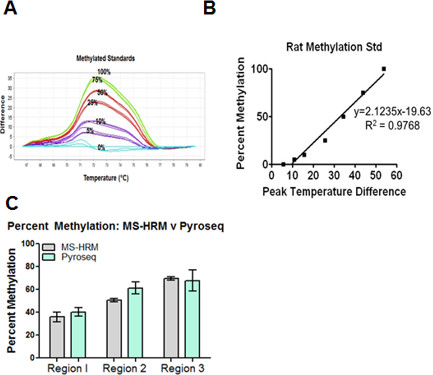
Figure 3. Sample data and analysis for MS-HRM studies. (A) Example of temperature difference plots generated from methylation standards. Corresponding percent methylation is labelled for each curve (B) Example of linear regression equation generated from rat methylated standards. (C) Comparison of the percent methylation acquired from pyrosequencing (pyroseq, green bars) and MS-HRMA (gray bars) demonstrates similar levels of methylation for varying regions of KCNJ10. Pyrosequencing data generated in house using primers targeting same regions as MS-HRM analysis. Please click here to view a larger version of this figure.
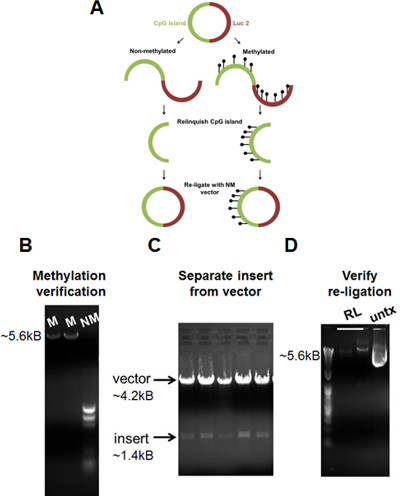
Figure 4. Dual luciferase assay allows for assessment of transcriptional activity of differentially methylated gene regions. (A) Diagram of luciferase transcriptional activity assay demonstrates workflow of protocol. (B) DNA gel displays differences in methylated versus non-methylated plasmids following HpaII digestion. Non-methylated DNA is readily digested following HpaII digestion compared to methylated DNA, demonstrating successful methylation of DNA plasmid. (C) DNA gel demonstrates separation of vector from insert following double digestion. Following DNA separation, vector and insert are gel extracted. (D) DNA gel demonstrates successful re-ligation of vector and insert. Re-ligated plasmid possesses similar molecular weight as untreated plasmid (untx). NM, non-methylated; M, methylated; RL, re-ligated; untx, untreated. Please click here to view a larger version of this figure.
. | Volume (µl) | x3 + 10% excess | x # of samples |
MeltDoc MM | 10 µl | 33 µl | |
Primer 1 | 1.2 µl | 3.96 µl | |
Primer 2 | 1.2 µl | 3.96 µl | |
gDNA | 1 µl | — | |
dH20 | 6.6 µl | 21.78 µl |
Table 1. Sample calculation of MeltDoctor Mastermix. Run each MS-HRM reaction in triplicate with 10% excess to compensate for pipetting error. Last column indicates calculation needed for multiple numbers of samples. Total volume for each reaction is 20 µl.
Cycle | Temp (°C) | Time (sec) | Ramp rate (%) |
95 °C | :15 | 100 | |
40x | 95 °C | :15 | 100 |
60 °C | :60 | 100 | |
Melting parameters | 95 °C | :10 | 100 |
60 °C | :60 | 100 | |
95 °C | :15 | 1 | |
60 °C | :15 | 100 | |
Hold | 4 °C |
Table 2: Sample protocol for amplification. Denature samples at 95 °C for 10 min followed by 40 cycles of amplification and generation of melt curve. Melting parameters are listed within table. Note change in ramp rate that allows for acquisition of high- resolution melting temperature.
Percent Methylation (Rat Standard) | Peak Temperature Difference |
y | x |
0 | 5.670116 |
5 | 10.70448 |
10 | 15.5044 |
25 | 25.52295 |
50 | 34.43047 |
75 | 43.80894 |
100 | 53.88717 |
Table 3. Example of peak temperature difference data. Percent methylation standard is labelled as y-coordinate. Peak temperature difference data is labelled as x-coordinate. Representative peak temperature difference data was acquired using MS-HRM from one gene region.
Peak Temp Difference | Estimated methylation |
X | Y |
Sample 1 (n=4) | |
47.450 | 81.115 |
46.292 | 78.657 |
41.694 | 68.894 |
47.292 | 80.779 |
Sample 2 (n=4) | |
29.925 | 43.904 |
24.269 | 31.894 |
25.061 | 33.575 |
25.389 | 34.272 |
Table 4. Example of calculated estimated percent methylation. Peak temperature difference of samples of unknown methylation status is used to estimate percent methylation using a linear regression equation. Representative data from two different conditions, Sample 1 and Sample 2, are shown; n=4 for each condition.
Age | Number of animals | Total RNA (ng) | Total DNA (ng) |
p4-p10 | 3-6 | 455-868 | 265-1523 |
p19-p22 | 1-2 | 220-680 | 583-1483 |
p40-p50 | 3-4 | 198-260 | 578-1700 |
Table 5. Total RNA and DNA acquired from FACS sorted cells. Age and number of animals used in FACS experiments are listed. Note, both cortices were utilized for each N. Total RNA and DNA is listed as a reference for expected yield.
Age | Number of animals | Pos Events | Neg Events | Incubation time (at 37 °C) |
p26 | 1 | 2.18X10^6 | 1.15X10^6 | 20:00 min |
p26 | 2 | 4.4X10^6 | 2.78X10^6 | 20:00 min |
p26 | 2 | 9.2X10^6 | 3.3X10^6 | 30:00 min |
Table 6. Number of events acquired from FACS at postnatal day 26. At p26 number of positive (eGFP+) events and negative events varies depending on number of animals utilized and incubation period.
This protocol describes the isolation of an enriched population of astrocytes via FACS as well as a variety of techniques that allow for both correlative and causative studies between DNA methylation and gene expression. These techniques, used in isolation or in combination, are particularly useful for laboratories that work with tissue of high cellular heterogeneity or are interested in the DNA methylation status of a particular gene or gene region versus global DNA methylation changes. One relatively unique challenge in studying the epigenome of the CNS is the diversity of cell populations. As genes of interest may be expressed to varying degrees with both temporally and spatially unique patterns in the CNS, the use of whole tissue often confounds data from both transcription and DNA methylation studies.
Kir4.1, the protein of interest, is spatially and temporally regulated in astrocytes, oligodendrocytes, and ependymal cells 13,14,40-47. Thus, the use of eGFP-S100β transgenic animals 27 for FACS provided an enriched population of astrocytes 15, and therefore a more accurate assessment of the level of gene transcription and DNA methylation specific to this cell population. Despite this advantage, the use of FACS sorted astrocytes presents several challenges. Preparation of a cell suspension for FACS requires significant disruption of whole tissue and several changes in the temperature and external media environment. While pH and temperature are maintained to promote cell viability and stabilize cellular machinery, it is reasonable to assume that some changes in DNA methylation occur subsequent to the mechanical and enzymatic disruption of cells. Additionally, in comparison to the use of whole tissue, FACS sorting of astrocytes yields significantly lower amounts of RNA and DNA for downstream molecular studies. This low ratio of yield to labor/reagent may limit the feasibility of some studies depending on the number and complexity of subsequent molecular applications as well as brain regions under study. Taking time to maintain proper pH and temperature as well as working efficiently to reduce total protocol time will aid in isolating healthy cells and thus high quality DNA/RNA.
In regards to methylation studies, a variety of applications are currently available for detection of DNA methylation 48,49. Methylation sensitive high resolution melt analysis (MS-HRMA) was utilized to study KCNJ10, the gene of interest. MS-HRMA is useful in screening changes in DNA methylation of any given region of a gene of interest. This technique incorporates many of the same basic concepts and procedures as standard PCR amplification 50. Thus, reactions can be setup using a number of thermal cyclers and data analysis performed in most laboratories familiar with standard molecular techniques. One caveat to MS-HRMA is that the method provides estimates of the methylation status of a given region of DNA. This is in contrast to pyrosequencing which provides exact percentages of methylation of specific CpG sites. Additionally, depending on the number of CpG sites assessed within one region, using a linear regression may skew results for those regions with limited numbers of CpG sites.
In studying the ability of DNA methylation to regulate KCNJ10 gene expression, we supplemented correlative studies with a dual luciferase assay to directly assess changes in the transcriptional activity of the KCNJ10 gene following hypermethylation. Use of the luciferase assay allows for alteration of the methylation status of a specific region of the gene and subsequent assessment of transcriptional activity directly related to these changes. Two major challenges of the luciferase assay are the laborious nature of the protocol and the loss of DNA input through each sequential step. Validation of the quantity and quality of DNA following each reaction as well as starting with a sufficient amount of DNA is essential to acquiring adequate amounts of DNA for transfection. Overall, the use of these techniques can be performed using tools found in most molecular laboratories and be can performed without the use of a large genomic sequencing facility, making these techniques widely accessible to investigators interested in DNA methylation.
The authors have nothing to disclose.
This work was supported by R01NS075062-01A1. FACS sorting performed at UAB Comprehensive Flow Cytometry Core facility (P30 AR048311, P30 A1027767). Dr. Scott Philips from the UAB Neurobiology Core facility and Dr. Susan Nozell from UAB CDIB assisted with technical aspects of the luciferase assay.
Papain Dissociation System | Worthington Biochemical Corporation | LK003150 | |
AllPrep DNA/RNA Mini Kit | Qiagen | 80204 | |
Methyl Primer | Applied Biosystems | online | software to localize CpG Islands |
EZ DNA methylation Kit | Zymo Research | D5001 | |
Rat Premixed Calibration Standard | EpiGenDx | 80-8060R-Premix | |
CpG Methylase (M.Sssl) | Zymo Research | E2010 | |
QIAquick Gel Extraction | QIagen | 28704 | Used for gel extraction and DNA cleanup |
Restriction enzymes | New England BioLabs | ||
NEB cutter | New England BioLabs | online | verify restriction digest sites |
Dual Luciferase Reporter Assay System | Promega | E1910 | |
Luc2 vector, pGL4.10 | Promega | E6651 | |
renilla vector, pGL4.74 | Promega | E2241 | |
TD-20/20 Luminometer | Turner Designs | ||
Lipofectamine LTX and Plus Reagent | Life Technologies | A12621 | |
Phenol, saturated pH 6.6/6.9 | Fisher Scientific | BP 17501-100 | |
Nanodrop 2000/2000c Spectrophtometer | ThermoScientific | ||
MeltDoctor Master Mix | Life Technologies | 4415440 | |
High Resolution Melt (HRM) Software v2.0 | Life Technologies | 4397808 | |
AB SDS software v2.3 | Life Technologies | online | |
AB High Resolution Melting Getting Started Guide | Life Technologies | online | |
AB 7900HT Fast Real-Time System | Life Technologies |