1. Preparation of Volatiles Detected from the Host Plant for EAG Screening
- After appropriate identification and authentication of all volatiles via GC-MS, perform EAG puff analysis of each available volatile. Initial screening can be a low replicate number of antennal responses (N=3-5) for each sex in order to achieve an indication of relative chemoreceptivity in a short amount of time (Table 1).
- Prepare a solution of each volatile at a 5 mg/mL concentration in pentane. Tightly seal and refrigerate the sample until ready for immediate use (e.g., acetophenone, density = 1.03 g/mL, volume = (0.005 g/1.03 g/mL) × 1,000 = 4.85 μL of acetophenone into a 1.0 mL volumetric flask and dilute to 1.0 mL with pentane).
- Just prior to EAG analysis, remove vials containing the 5 mg/mL concentration of volatiles to be tested and allow to warm to room temperature. Meanwhile, label the proper number of Pasteur pipettes to correlate with each volatile to be tested, and wrap a small piece of parafilm (ca. 15 × 15 mm) over the tip of the pipette. For the initial screening 10 stimulus pipettes (N=4 for each male and female) are loaded in the event of a bad prep or other unforeseen obstacle.
- Using a pair of tweezers, gently fold the bioassay disc in half to facilitate placement into the pipette, then partially place the folded disc into the large end of the pipette so that ca. 2-3 mm of the disc are exposed. Align the labeled and prepped pipettes in a rack holder.
- Using a pipettor or syringe, load 10 μL (50 μg) of volatile solution onto each disc and allow 2 minutes to pass before fully inserting discs into the pipette. Once loaded, immediately seal the end of the pipette with parafilm (ca. 15 × 30 mm). The amount of volatile stimulus to be loaded and puffed will most likely vary with insects species.
- Following the same protocol noted above prepare controls to include in each analysis. For the negative control load 10 μL of just pentane onto each disc, wait 2 minutes, load into the labeled pipette, and seal. For the positive control, load 10 μL (50 μg) onto the disc, wait 2 minutes, load into the labeled pipette, and seal with parafilm.
- The viability of the insect antennal prep will most likely vary with species, but we have found that Amyelois transitella antennae typically stay active and consistent for > 30 minutes after excision using the described protocol. This amount of time will generally allow for up to 4-10 volatile samples to be evaluated. Table 2 provides an example of times and sequences.
2. Preparation of Insect Antennae for EAG Bioassay
- The focus of this experiment is EAG analysis; thus, the assumption that each investigator will have access to appropriately reared insects.
- For this experiment we will be studying 3-4 day old, mated male and female moths. Individual moths are transferred into a small, lidded, plastic container the day of analysis. Immediately prior to the bioassay, the moth to be tested is transferred head-first into a holding apparatus (i.e., made from various plastic pipettor tips) and secured from behind. Manipulation of the insect can be viewed under a low-power stereo-microscope to facilitate excision.
- Antennae are teased out using a wire-tipped tool. The fork holder, with a small film of electrode gel, is placed in close proximity for quick transfer of antennae. The first antenna is excised using micro scissors and placed on the fork, ensuring the base of the antenna is placed on the non-red portion of the fork (the indifferent ground electrode). A timer set for 10 minutes is started and the second antenna is excised and placed next to the first antenna with both bases on the same side of the fork.
- Alternatively, the antennae may be left secured within the holding tube, excised, then gently removed from between the tube and the insect using a wire-tipped tool with a dab of gel on the end.
- Antennae are checked to ensure the base and tip are immersed in electrode gel and no bubbles are present in the gel. The ends/tips can be trimmed to guarantee full exposure to the electrode gel. Care should be used to ensure that the remainder of each antenna is not covered with gel, thus guaranteeing maximum antennal surface area is exposed to the puff.
- The prepped fork is then inserted into the probe pre-amplifier and kept under a constant stream of humidified air at 200 mL/min for the remaining time of the 10 minute waiting period. The excise time and EAG initiation times are noted (Table 2) and 30 seconds prior to the first stimulus puff, the pipette containing the positive control is unsealed and placed in the holder which is adjusted to direct air/puff flow 2-3 mm from the prepped antennae.
- After each experiment, the test moths are euthanized in a dry ice environment and properly disposed.
- Female moths are dissected to check mating status. Cohabitating males are assumed to have mated.
3. EAG Protocol for Individual Components
- Antennal responses are recorded via the AutoSpike software included with the Syntech EAG instrument. The configuration in the AutoSpike Properties tab for the channel with the EAG probe is set at a sampling rate of 106.7, NO to rectify, and a filter of 0-42 Hz. For the Filter tab, the EAG filter is ON and the low-cutoff is set to 0.1 Hz.
- Stimulus puffs are 1-2 seconds in duration. A timer set for 1 minute is started after each puff.
- The next test volatile pipette is unsealed and placed in the holder. The sequence of test volatiles, randomized between runs to ensure no test compounds consistently follow another test volatile, is then followed (e.g., Table 2) carefully allowing 1 minute between puffs.
- To facilitate ease of reading EAG responses, portions of rulers are placed on the computer screen and the baseline level to the apex of the downward deflection signal is measured in mm and logged on a data sheet (i.e., for the 5 mV setting, 33 mm = 2.5 mV). The software has the capability of playback of the saved recordings for future analysis. Conversion of mm to either mV or μV amplitude is performed in later data analysis.
- After the final positive control puff (e.g., record #12) is administered, the antennae are removed, the fork is cleaned with an ethanol-saturated wipe and allowed to dry before subsequent use.
- To increase the throughput of assays, the excision of the next set of antennae can be started by a second laboratory personnel approximately 10 minutes before the end of current experiment – after the fourth puff; the second test volatile of the current experiment, as per Table 2. This will allow for the start of the next experiment directly after the current experiment ends.
- Higher number of replications (on different antennae) can be performed on compounds of interest to provide further statistical validation.
4. An Example of EAG Analysis of Blends or Other Matrices (Table 3)
- Next, the ratios and volumes for two tertiary blends (3-component mixtures) are calculated to provide an example of combining volatiles eliciting high EAG responses (Table 4). The calculations are for some basic ratios, a 1:1:1 molar ratio of α-humulene : 2-undecanone : 2-phenylethanol and then comparing to a second blend ratio of 1:2:4.
- Using similar protocols described earlier, the mixtures are prepared and labeled Pasteur pipettes are loaded along with the necessary positive and negative controls.
- The volatile samples are puffed across male and female antennae and the responses are measured and logged onto a data sheet (Table 3).
5. Representative Results
For female navel orangeworm the following settings are used: 2 second puffs, 10 second recording times, 10 second window, and 5 mV scale. A negative deflection is the typical response, yet the absolute value is recorded (e.g., -3,400 μV deflection is recorded as 3,400 μV). A relatively weak response of the prep to the positive control is discarded. Figure 1 provides a graphical representation of a poor response to the positive control by navel orangeworm.
For example of a poor control result, the average female antennal response to acetophenone is typically ca. 2,600 μV (Figure 2), if the prep only gave a response of ca. 1,300 μV it would be discarded and another pair of antennae prepped. Similarly, the average male response to (Z,Z)-11,13-hexadecadienal was typically 3,000 μV; thus, any response less than 1,500 μV was typically discarded.
The positive control at the start and end of each experiment also provides information regarding the condition of the antennae. A rule of thumb we follow for rapid screening is if the antennal response to the puff of the post-control (record #12, Table 2) is either less than 75% of the 1st puff of the pre-control (record #1, Table 2) or less than the 2nd puff of the pre-control (record #2, Table 2) then the experiment is not used in the data analysis due to possible degradation of the prep (Figure 3). An example of the first rule of thumb would be record #1 = 2,730 μV and record #12 = 1,680 μV; and the second rule of thumb if record #2 = 2,350 μV and record #12 = 1,680 μV, In each of these cases, the prep and experiment’s results would be discarded.
A representative example of correcting the EAG response values as measured to the positive control would be as follows.
| Run # | EAG (μV) | Run #2 | EAG (μV) | Run #3 | EAG (μV) |
| (+) Ctrl | 2800 | (+) Ctrl | 2420 | (+) Ctrl | 3030 |
| Cmpnd A | 3000 | Cmpnd A | 2500 | Cmpnd A | 3440 |
| (-) Ctrl | 530 | (-) Ctrl | 755 | (-) Ctrl | 910 |
| Cmpnd B | 2400 | Cmpnd B | 2000 | Cmpnd B | 2560 |
| (+) Ctrl | 2770 | (+) Ctrl | 2400 | (+) Ctrl | 3020 |
Using the values above for an N=3 experiment, the negative control response is subtracted from every value within each experiment under the assumption the negative control is the baseline antennal response to the mechanical puff and residual solvent.
| Run #1 | EAG (μV) | Run #2 | EAG (μV) | Run #3 | EAG (μV) |
| (+) Ctrl | 2270 | (+) Ctrl | 1665 | (+) Ctrl | 2120 |
| Cmpnd A | 2470 | Cmpnd A | 1745 | Cmpnd A | 2530 |
| (-) Ctrl | 0 | (-) Ctrl | 0 | (-) Ctrl | 0 |
| Cmpnd B | 1870 | Cmpnd B | 1245 | Cmpnd B | 1650 |
| (+) Ctrl | 2240 | (+) Ctrl | 1645 | (+) Ctrl | 2110 |
The positive controls for each experiment would then be averaged and corrected to 1,000 μV, noting the ratio for correction to 1,000 μV. A data sheet (e.g., Excel) can easily be manipulated to convert responses to usable data.
| Run #1 | Avg (μV) | Run #2 | Avg (μV) | Run #3 | Avg (μV) |
| (+) Ctrl | 2255 | (+) Ctrl | 1655 | (+) Ctrl | 2115 |
| (+) Ctrl adj. | 1000 (0.443) | (+) Ctrl adj. | 1000 (0.604) | (+) Ctrl adj. | 1000 (0.473) |
Multiplying by the correction ratio within each experiment, the values for compound A and compound B are then adjusted.
| Run #1 | Adj. EAG(μV) | Run #2 | Adj. EAG(μV) | Run #3 | Adj. EAG(μV) |
| Cmpnd A | 1094 | Cmpnd A | 1054 | Cmpnd A | 1197 |
| Cmpnd B | 828 | Cmpnd B | 752 | Cmpnd B | 780 |
The averages (means) for each compound are then determined along with other relevant statistical data and the EAG responses for the compounds tested can then be evaluated for candidacy for further investigation.
| Compound | EAG (μV) | No. Runs, N= |
| A | 1115 | 3 |
| B | 787 | 3 |
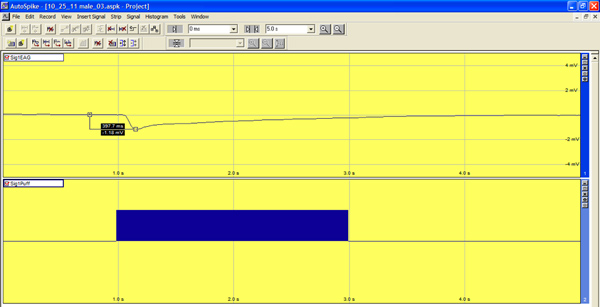
Figure 1. Representative EAG for male antennal response (1,180 μV) to the pre-control (1st positive control puff) that would be discarded due to poor antennal response after ensuring the antennae have good contact with the gel. Blue bars in bottom windows represent the two second puff of volatile. Click here to view larger figure.
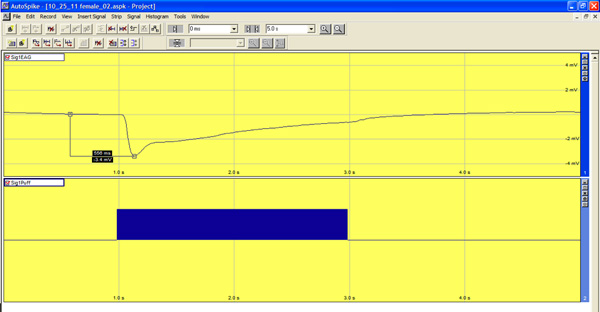
Figure 2. Representative EAG for the female antennal response (3,400 μV) to the 1st puff pre-control that would be considered appropriate. Click here to view larger figure.
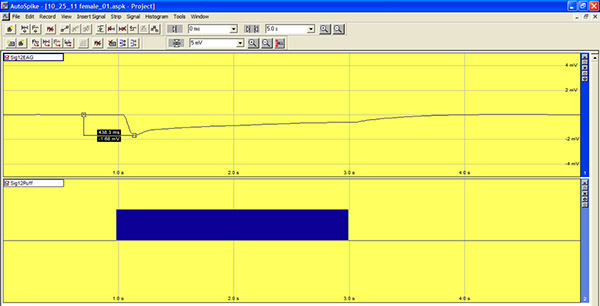
Figure 3. Representative EAG for the female antennal response (1,680 μV) to the post-control (last positive control for each experiment) that would be considered poor, and suggestive of antennae degradation (<75% of 1st pre-control or < 2nd puff value of pre-control). For this example the 1st pre-control puff was 2,730 μV and 2nd pre-control puff was 2,350 μV. Click here to view larger figure.
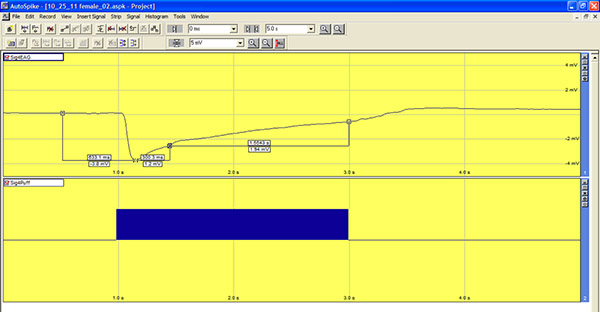
Figure 4. Representative EAG for the female antennal response (3,800 μV) to the puff of a candidate volatile blend and the subsequent measurements of the maximum initial deflection (3,800 μV), the initial slope during the puff duration (0.3 s/1.2 mV = 0.25 s/mV), and the slope for the remaining puff duration (1.6 s/1.9 mV = 0.84 s/mV). Click here to view larger figure.
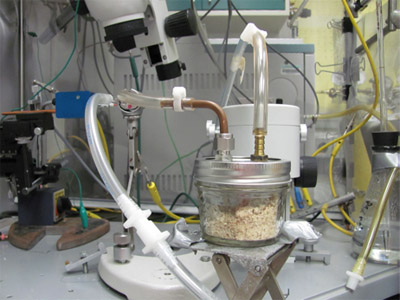
Figure 5. Small modified vessel containing a sample matrix and associated volatiles to be puffed across A. transitella antennae.
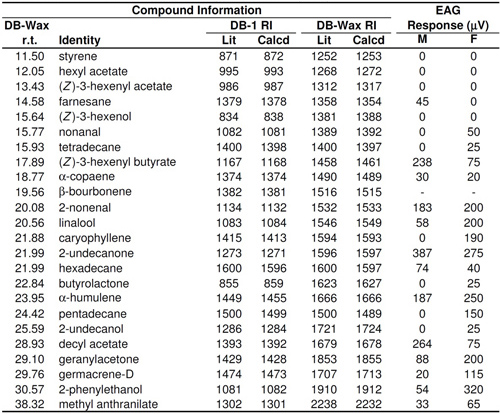
Table 1. In situ volatile emission of Nonpareil almonds (2007) and EAG responses determined by a different and less sensitive configuration in the Autospike program.
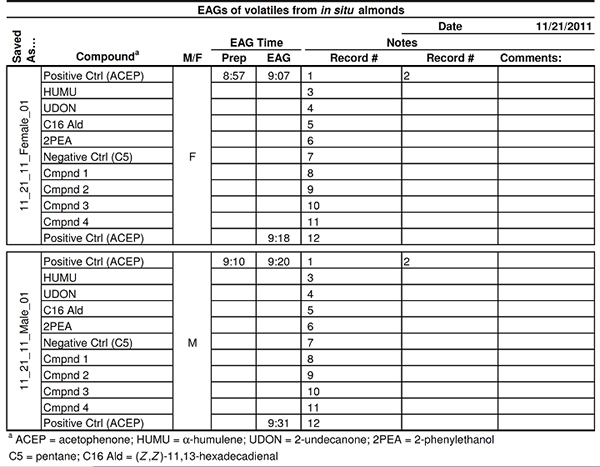
Table 2. Example of a form for recording male and female antennal responses to individual volatile components.
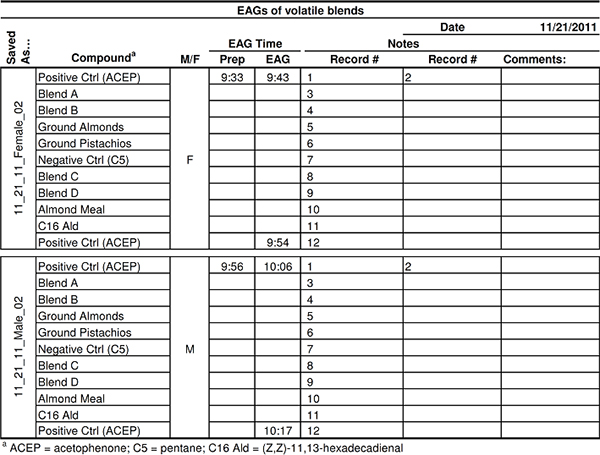
Table 3. Example of a form for recording male and female antennal responses to volatile blends and/or bouquets.
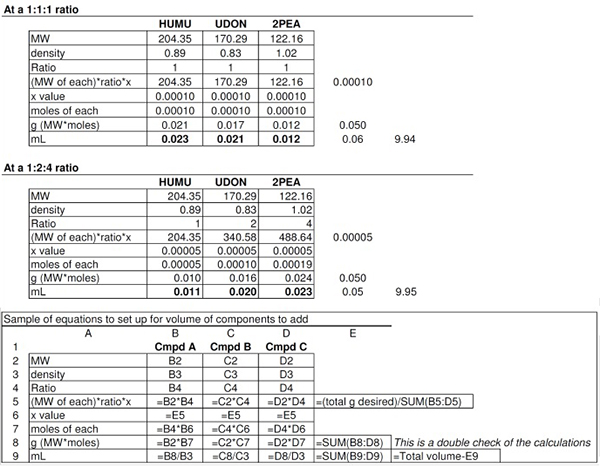
Table 4. Examples of preparation of 10 mL of a 5 mg/mL solution for two different ratios of blends.
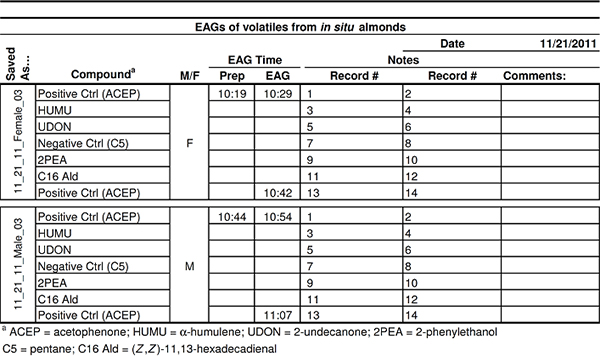
Table 5. Example of form for recording two consecutive puffs of single volatile components across male and female antennae.
