Analyzing the physiological properties of olfactory sensory neurons still faces technical limitations. Here we record them through perforated patch-clamp in an intact preparation of the olfactory epithelium in gene-targeted mice. This technique allows the characterization of membrane properties and responses to specific ligands of neurons expressing defined olfactory receptors.
Analyzing the physiological responses of olfactory sensory neurons (OSN) when stimulated with specific ligands is critical to understand the basis of olfactory-driven behaviors and their modulation. These coding properties depend heavily on the initial interaction between odor molecules and the olfactory receptor (OR) expressed in the OSNs. The identity, specificity and ligand spectrum of the expressed OR are critical. The probability to find the ligand of the OR expressed in an OSN chosen randomly within the epithelium is very low. To address this challenge, this protocol uses genetically tagged mice expressing the fluorescent protein GFP under the control of the promoter of defined ORs. OSNs are located in a tight and organized epithelium lining the nasal cavity, with neighboring cells influencing their maturation and function. Here we describe a method to isolate an intact olfactory epithelium and record through patch-clamp recordings the properties of OSNs expressing defined odorant receptors. The protocol allows one to characterize OSN membrane properties while keeping the influence of the neighboring tissue. Analysis of patch-clamp results yields a precise quantification of ligand/OR interactions, transduction pathways and pharmacology, OSNs' coding properties and their modulation at the membrane level.
Olfactory sensory neurons (OSN) represent the first step of olfactory perception. Located in the olfactory epithelium lining the nasal cavity in rodents, they transform the chemical information of odorants into action potentials sent through their axon to the brain. To better understand the olfactory coding mechanisms, it is necessary to characterize the transduction and membrane properties of OSNs. Until recently, most of the techniques used to characterize the properties of mammalian OSNs were carried out on dissociated OSNs1-4. The dissociation process uses various mechanical and chemical (i.e., enzymes) processes to free the OSNs from their environment. These processes induce a low number of available cells for recordings. This low number can be even more critical in the case of GFP labelled cells. Dissociation also removes the local cell-to-cell interactions between OSNs and other cells of the olfactory epithelium that may enhance survival and modulation of OSNs' properties. In order to bypass the dissociation procedure, an intact preparation was developed5.
Each OSN expresses one olfactory receptor (OR) selected from a large multigene family6. There are ~1,000 ORs expressed in the main olfactory epithelium in the mouse. Due to the large number of OR in wild type animals, the chances to record OSNs expressing the same OR are very low. To overcome these limitations, gene targeted mice are available in which all OSNs expressing an identified OR are labeled with a fluorescent protein7-9. These labeled OSNs were used to do functional analysis in dissociated preparations7,10,11 with the drawbacks mentioned earlier. An intact epithelium preparation5 from genetically labeled mice therefore circumvents these issues. It allows the monitoring of the activity of OSNs expressing precisely defined ORs in an environment as close to in vivo as possible. Besides, patch-clamp recordings of OSNs also allow precise analysis of membrane properties, transduction pathway pharmacology, ligand/OR interactions. All these topics can hardly be analyzed using extracellular recordings. We used this technique to monitor the responses of OSNs expressing the odorant receptors SR1 and MOR2312,13. The feasibility of the technique was confirmed by other groups on MOR23 expressing OSNs14 as well as on other ORs expressing neurons15,16. The monitoring of a defined population of OSNs can lead to the analysis of their properties in many different contexts such as development14, aging17, odorant induced plasticity18, and the role of variations in the odorant receptor’s sequence in odor coding15. This protocol thus provides a powerful tool to monitor the functional properties of defined OSNs at the membrane level.
This protocol follows the animal care guidelines of the Université de Bourgogne and was approved by the Université de Bourgogne ethics committee.
1. Animals
2. Preparation of Electrodes and Solutions
3. Preparation of Olfactory Epithelium
Note: OR-IRES-tauGFP mice express the tauGFP under the control of the OR promoter. In these mice, all neurons expressing the OR of interest are labeled with GFP. This protocol is adapted for ORs expressed in all zones. However, dissections and recordings are easier for ORs expressed in the dorsal zone.
4. Recording Session
5. Data Analysis
The outcome of this protocol depends on the quality of the dissection. This dissection steps must be short (less than 10 to 15 min) and precise (i.e., to avoid damages of the epithelium). The Figure 1 illustrates how an ideal preparation looks like at different magnification levels. At a low magnification under bright field the different cell types (such as knobs of OSNs, supporting cells) are distinguishable (Figure 1A). At the highest magnification level, typically 80X to 160X, in bright field, the dendritic knobs of the OSNs should be clearly distinguishable from the supporting cells (Figure 1B). Under fluorescent light, only the dendritic knobs and cilia of GFP labelled cells are visible (Figure 1C). By comparing the 2 images, the labelled cells can be approached with the recording pipette (Figure 1D).
The temperature of the dissection solution and timing of the dissection are critical. The first part of the dissection, the preparation of the septum (section 3.1.1 to 3.2) should take place within 5 to 10 min in ice-cold solution. The final dissection (3.3) should last less than 5 min at room temperature. In case the dissection lasted for too long, or was performed in dissection solution too warm, the preparation invariably looks rapidly damaged: dendritic knobs are floating above the surface of the epithelium, and resemble dead cells.
Once a seal is reached and the cell opens under the effects of nystatin, typical voltage gated currents can be observed (Figure 2A). The shape and characteristics of these currents can be used to monitor the health of the cell: in a dying cell or if the seal’s quality is decreasing, these currents’ amplitude will decrease. Under the current clamp configuration, action potentials can be recorded either spontaneously (Figure 2B) or by injection of a depolarizing current (Figure 2C). The firing properties induced by current injection characterize the excitability of the recorded neuron. The excitability of different OSNs’ population can be compared (using classical frequency and ISI calculations).
A multibarrel pipette loaded with different odorants and/or different concentrations of odorants can be used to stimulate the cells by pressure ejection. This allows to measure the odorant induced responses. The odorants and concentrations must be chosen depending on the OR expressed in the cell of interest, for example Lyral is the ligand for MOR23, acetophenone for M71, eugenol for mOREG. In the experiment illustrated on the Figure 3, the recorded MOR23-IRES-tauEGFP neurons responded to different concentrations of Lyral, a ligand for MOR23, under current clamp mode (Figure 3A) or under the voltage clamp mode (Figure 3B). In voltage clamp mode recordings, different characteristics can be monitored to quantify the response (maximum amplitude, rise-time, total current elicited, etc.) as performed classically in electrophysiology. Using the maximum amplitude of the odorant-induced response, dose-response can be plotted and fitted using the Hill equation. These results provide information about the encoding properties of each OSN: detection threshold, temporal dynamic, dynamic range and saturation level. Examples of dose-response curves are shown on Figure 3C. All these details can be compared between individual OSNs to measure potential heterogeneity within a population; they can also be compared between OSNs with or without application of a treatment to measure potential modulation and plasticity.
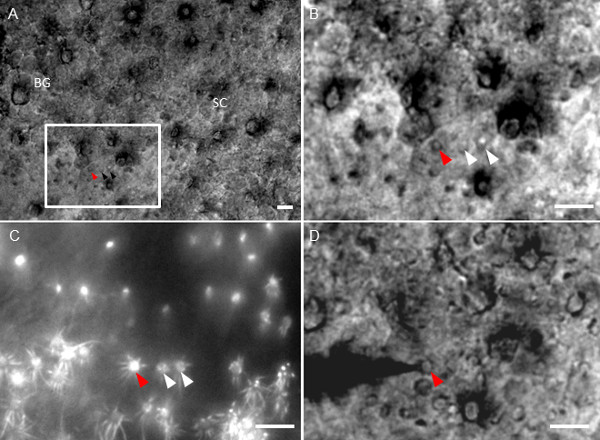
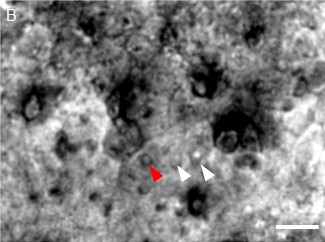
Figure 1: Representative images of a healthy preparation. (A) Intact olfactory epithelium extracted from the nasal cavity of a SR1-IRES-tauGFP transgenic mouse observed under bright field condition at the 40X magnification. OSN dendritic knobs (black arrow heads) are enclosed in a mesh of supporting cells (SC) and Bowman glands (BG). (B) Dendritic knobs of SR1 expressing OSNs observed under bright field condition (white and red arrow heads). (C) The same field as in (B) under fluorescent light showing dendritic knobs of SR1 expressing OSNs. (D) Recording pipette approaching a SR1-expressing OSN under bright field. The red arrowhead represents the same SR1 OSN in (B–D). Scale bar: 5 µm.
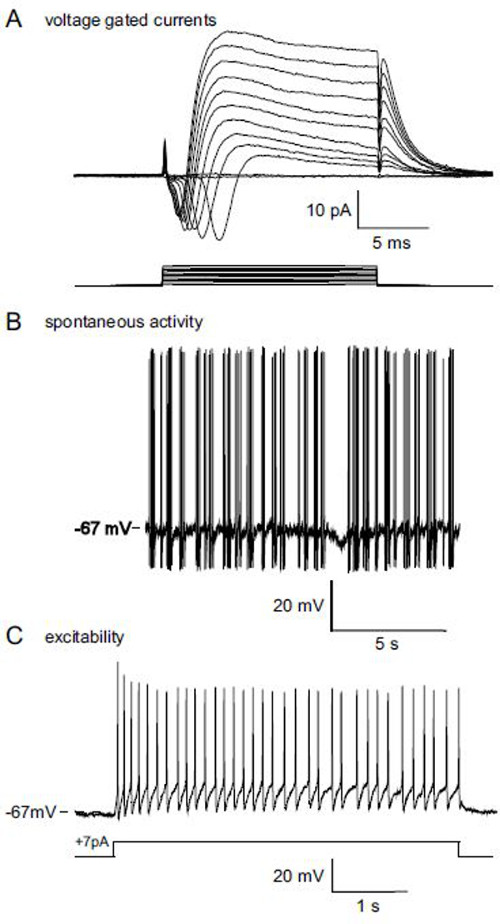
Figure 2: Representative membrane properties results obtained with the protocol: patch-clamp recordings on the dendritic knob of a SR1-IRES-tauGFP OSN. (A) Voltage gated currents elicited by increasing depolarizing steps from the membrane potential -67 mV to +40 mV. (B) Spontaneous activity recorded in the current clamp configuration; action potentials can be observed during the 15 sec recording epoch. (C) Action potentials elicited by a +7 pA excitatory current; this protocol provides information about the excitability of the cell.
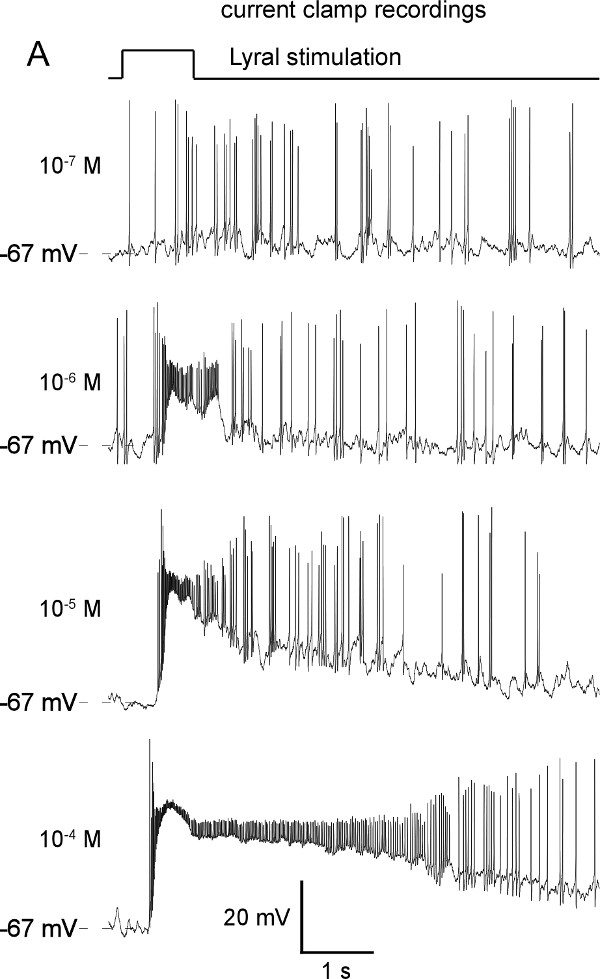
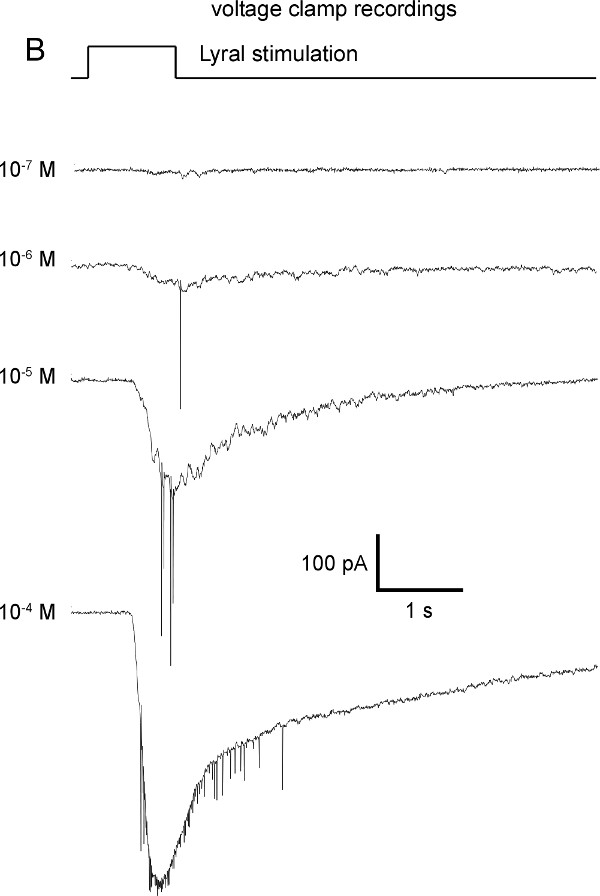
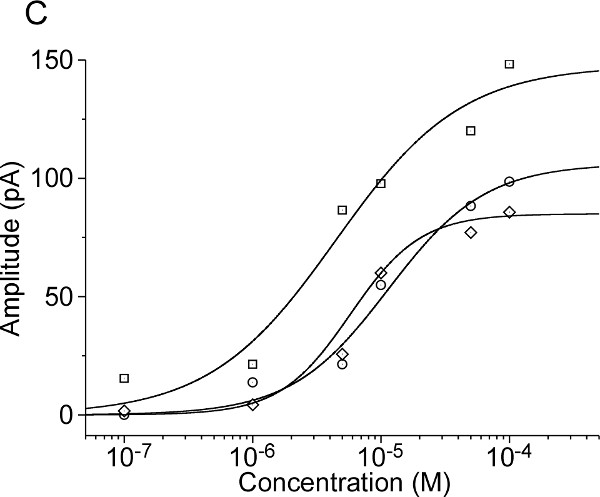
Figure 3: Representative examples of odorant induced responses in a MOR23-IRES-tauEGFP neuron. Increasing concentrations of Lyral, a ligand of the MOR23 receptor, induce increasing responses both in current clamp (A) and in voltage clamp (B). The membrane potential was clamped at -67 mV. (C) Examples of individual dose-response curves acquired on three M71 neurons in response to increasing concentrations of acetophenone and fitted with the Hill equation.
The ability of this protocol to correctly monitor the properties of healthy OSNs depends heavily on the quality of the preparation. Therefore, the dissection steps are critical. First it is critical to pay attention to the quality (pH, osmolarity), oxygenation and temperature (ice-cold but not frozen) of the dissection medium. Second, the manipulation of the epithelium with dissecting tools must be as limited as possible to avoid damages. Finally, it is critical to obtain a preparation as flat as possible in order to access the largest OSN population as possible.
The dissection quality is fundamental to obtain a healthy preparation. However, different approaches can be used for the dissection: here we present a ventral to dorsal dissection but some users can prefer to start the dissection dorsally to open the nasal cavity rapidly and have a rapid access to the septal recess of the olfactory epithelium. Each user can hence adapt the protocol for the most efficient strategy to reach a healthy preparation of the area of interest.
Once the preparation is under the microscope, permanent monitoring of the preparation’s health is required. Indeed, an unhealthy preparation leads to a low probability to reach a gigaseal. A low efficiency in obtaining gigaseals can be improved by changing the area of interest on the preparation in order to find healthier OSNs. A more drastic solution is to replace the preparation entirely by a new one. Once the seal is reached, a low probability to reach the “opened” state can take place. This may be due to the internal solution’s quality. The internal solution must be prepared shortly before the experiment. The use of vortex and sonication are critical since the solubility of nystatin is rather low. To improve the probability of opening, the internal solution should be again vortexed for 10 sec and then sonicated for 30 to 60 sec. This usually improves the efficiency of the cell opening.
To stimulate the recorded OSN with odorants, the protocol presented uses a 7 barrel stimulating pipette. This type of pipette implies a limitation in the number of odorants and/or concentration of odorants tested on each recorded cells to seven. This limitation is relatively not significant in the case of a dose response curve since it can cover up to 7 log units of concentration. However, in the case of screening experiments, in which different odorants are tested, a seven barrel pipette may show limitations. In screening experiments, the goal is to find a ligand for labeled OSNs expressing an orphan OR. Using this protocol will require the use of odorant mixtures. Each mixture eliciting a response will be then divided into individual odorants. This was done to screen amine odorants on TAAR expressing OSNs16. In these experiments, the fluorescent neurons expressed TAARs and the ligand was unknown. Using the protocol, authors could screen several dozens of amine odorants in mixtures. The mixtures eliciting a response were then broken down to single odorants in order to find the most efficient ligand.
The distance between the recording site and the stimulating pipette should be chosen wisely in order to minimize the mechanical stimulation of the cell20. If the pressure is too high (above 30 psi in our recording conditions) and/or the distance too small (below 20 µm), the mechanical response in some OSNs can even mask the odorant response. Pressure and distance between the puffing pipette and the recording site are also critical to control solution exchange during stimulation. The concentration reaching the neuron was previously evaluated to be as close as possible to the concentration present in the pipette through a series of tests13. These tests used a solution colored with blue dye to measure the onset and offset of the stimulation. Using 20 psi pressure and 30 µm distance, the maximum intensity of the stimulus was reached within 300 msec. The offset of the stimulus was also carefully evaluated: since the preparation is under continuous flow of perfused solution, the stimulus was washed out within 0.8 to 0.9 sec13.
The odor coding properties of OSNs were historically measured either through extracellular recordings in vivo or through experiments on isolated cells. In mammals, extracellular recordings were performed at first in vivo in rats21. In extracellular recordings, the OR expressed in the recorded cell is unknown thus limiting the success ratio to find a cell responding to the odorant tested. The protocol allows the recording and characterization of defined receptors in neurons in the cellular environment of the epithelium. The receptors’ properties can therefore be analyzed at different levels: the specific ligand/OR interactions during the first step of the transduction pathway; consequently, the agonist/antagonist interactions of diverse ligands tested; the properties of mixtures integration of defined ORs and the role of the transduction pathway for OSNs' specificity; the influence on olfactory coding of cell-to-cell interactions (such as GAP junction) within the epithelium; and finally the modulation of the transduction pathway using pharmacological agents.
In the dissociated cell recordings, as mentioned earlier, the dissociation process removes the mucus and the cell-to-cell interactions within the olfactory epithelium. This may induce changes in the coding properties of the OSNs. Calcium imaging experiments on isolated cells were frequently reported. For example, dose-response curves of M71 expressing OSNs in response to acetophenone were reported7. These dose-response curves are steeper than the dose-responses curves obtained using the protocol presented here4. These discrepancies may be due to the cell-to-cell interactions in the intact preparation and also to the removal of mucus in isolated cells. Mucus is known to contain many protein and enzymes involved in perireceptor events fundamental for the olfactory transduction22,23. In the protocol reported here, the preservation of the structure of the olfactory epithelium and the putative presence of the mucus contribute to preserve the native features of odorant coding in OSNs. The concentrations used in the protocol are indicated in mol/L and usually are in the 10-7-10-3 range. These concentrations are higher than concentrations used in air-phased recordings (either in local field potential or extracellular recordings). These discrepancies might be due to i) the liquid phase of the recordings (and therefore of the stimulation) and ii) the slow washout of the mucus by the perfusion during recordings. In fact, the washout of the mucus and the section of the OSNs' axons during dissection may support that the preparation presented be potentially qualified as a "pseudo-intact" rather than a "fully-intact" preparation. This preparation represents, however, recording conditions as close to in vivo as possible and yet eliciting patch-clamp recordings. As any in vitro preparation from a mammalian organism, the survival remains time-limited. This limit might be due to the washout of the mucus, the section of OSNs' axons as well as the absence of blood circulation within the preparation.
The protocol presented here allows one to record membrane properties of olfactory sensory neurons. This technique can have multiple applications such as analysis of membrane properties of OSNs, pharmacological investigations of OSNs, modulation of odorant coding properties of OSNs, and deorphanization of ORs. The events recorded during calcium imaging are slow and long lasting. Patch-clamp recordings in the present protocol lead to data about rapid events in olfactory transduction pathway at the membrane level.
The recordings presented here are performed in the patch-clamp configuration. In this configuration, the membrane properties of the recorded cell can be analyzed, whether it is the olfactory transduction pathway machinery or the voltage gated currents involved. Experiments using this protocol can provide data about the modulation of the odorant coding properties of OSNs. Pharmacological agents can be used to investigate the olfactory transduction in different conditions: for example, MDL12330A, a blocker of adenylate cyclase III (ACIII)24,25 can be applied in the perfusion solution to investigate the role of ACIII in an odorant response. Additionally, this protocol can be used to investigate how olfactory coding properties are modulated in different conditions such as the olfactory environment18 or under the influence of hormones involved in feeding behaviors26. Finally, this protocol can also lead to data about OR/ligand interaction and deciphering agonist/antagonist activities on defined ORs or even in randomly chosen receptors27.
Finally, with the limitations due to the 7 barrel stimulating pipette, this protocol can be also be used for deorphanizing ORs. As mentioned earlier, in this case, several odorant mixtures can be tested. Mixtures eliciting a response should then be divided into individual odorants tested on other cells.
By targeting OSNs expressing defined ORs, this protocol provides powerful data about the ORs, ligands/ORs interactions, transduction pathway properties and to compare properties of defined populations of OSNs in different conditions.
The authors have nothing to disclose.
Authors would like to thank Peter Mombaerts for the generous gift of OR-GFP mice; Anne Lefranc and the CSGA animal facility for excellent animal care. Funding was provided by CNRS through an ATIP and ATIP Plus grants, by Conseil Régional de Bourgogne (FABER and PARI grants), by Université de Bourgogne (BQR program).
heavy equipment | |||
vibration table with Faraday cage | TMC | 63-500 SERIES | required : isolates the recording system from vibrations induced by the environment (movements of experimenter, vibrations of equipment such as fans for cooling computers, etc); can also be purchased with a Faraday cage, or equipped by a custom made Faraday cage; this cage is recommended to avoid electric noise from the environment |
optics | |||
microscope | Olympus | BX51WI | upright microcope equipped with epifluorescence; fixed or moving stage depending on the user's preference |
objectives | Olympus | LUMPLFL40XW | at least 2 objectives required: a 4x or 10x for coarse approach to the cell; and a 40x immersion long distance example Olympus LUMPLFL40XW/IR/0,8/WD:3.3 MM |
magnifier | Olympus | U-TVCAC | ABSOLUTELY REQUIRED: placed in the light path between the objective and the camera; allows to magnify the image on the screen in order to reach precisely the knob with the recording electrode |
camera | Olympus | DP72 | a good camera is required to see the neurons in fluorescence as well as in bright field; the controlling software is simple and allows to take pictures and do live camera image to monitor the approach of the electrode to the cell. An ultrasensitive camera is not necessary |
filters | Olympus/Chroma | depending on the fluorescent protein used in the mice; example for GFP: excitation : BP460-490: emission: HQ530/50m | |
recording electrodes /system | |||
amplifier | HEKA | EPC10 USB | monitors the currents flowing through the recording electrode and also controls the puffing by sending a TTL signal to the spritzer; the EPC10 setup is controled by computer |
software | HEKA | Patchmaster | controls the amplifier during the experiment |
micromanipulator | Sutter | MP225 | precision micromanipulator, allows precise movements down to 1/1Oth of a micrometer; this model is very stable; avoid hydraulic manipulators that may drift |
electrode puller | sutter | P97 | with a FT345-B wide trough filament; to prepare recording pipets of about 2µm diameter with a long tip to reach the cells; the resistance should be 15 to 20Mohm with perforated patch clamp solution |
glass | sutter | BF120-69-10 | in our recording conditions, this glass is ideal for recording pipets |
recording chamber | warner instruments | RC-26G | a chamber is needed to set the preparation under the microscope. To maintain the preparation in the center of the chamber, a net/anchor should be used. |
stimulation | |||
glass | WPI | TW100F-4 | attached in groups of 7, these pipettes are used to prepare prepulled stimulating pipettes |
multibarrel puller | MDI | PMP-107-Z | by association of pull and twist, this puller allows us to prepare puffing electrodes with 7 barrels |
precision pressure injector | Toohey Company | P/N T25-1-900 Single Channel | this precision pressure injector controls the pressure ejected in the multibarrel puller; it is controlled manually or by the amplifier by a 5V TTLs |
micromanipulator | Narishige | YOU-1 | a coarse manipulator is enough to bring the puffing electrode close to the recording site |
tubings | N/A | tygon tubing to bring the pressure from the puffer to the puffing pipette | |
solutions/perfusion/chemicals | |||
vacuum pump | gardner denver | 300 series | a vibrating membrane pump is more quiet and efficient than other types of pumps |
perfusion system | N/A | N/A | gravity perfusion system with polyethlylen tubing to bring in and out the external solution from the recording chamber |
nystatin | Sigma-Aldrich | N3503 | mandatory to perpare internal solution for perforated patch clamp |
DIMETHYL SULFOXIDE | Sigma-Aldrich | D5879 | used to disolve nystatin for internal solution for perforated patch |
Sodium chloride | Sigma-Aldrich | S9625 | extracellular solution |
Potassium chloride | Sigma-Aldrich | P4504 | intracellular/extracellular solution |
Calcium chloride di hydrate | Sigma-Aldrich | C7902 | extracellular solution |
Sodium phosphate monobasic monohydrate (NaH2PO4) | Sigma-Aldrich | S9638 | extracellular solution |
Magnesium sulfate heptahydrate (MgSO4 7H2O) | Sigma-Aldrich | 63140 | extracellular solution |
Glucose | Sigma-Aldrich | G8270 | extracellular solution |
Sodium bicarbonate | Sigma-Aldrich | S6297 | extracellular solution |
EGTA (Ethylene glycol-bis(2-aminoethylether)-N,N,N′,N′-tetraacetic acid) | Sigma-Aldrich | E3889 | internal solution |
Potassium hydroxyde | Sigma-Aldrich | P1767 | internal solution |
MethylSulfoxide | Sigma-Aldrich | 47,135-6 | intracellular solution |
Hepes-Na | Sigma-Aldrich | H7006 | intracellular solution |
Sucrose | Sigma-Aldrich | S0389 | intracellular solution |