We present a protocol to assess the rate of alveolar fluid clearance or pulmonary edema in neonatal mouse lung using X-ray imaging technology.
At birth, the lung undergoes a profound phenotypic switch from secretion to absorption, which allows for adaptation to breathing independently. Promoting and sustaining this phenotype is critically important in normal alveolar growth and gas exchange throughout life. Several in vitro studies have characterized the role of key regulatory proteins, signaling molecules, and steroid hormones that can influence the rate of lung fluid clearance. However, in vivo examinations must be performed to evaluate whether these regulatory factors play important physiological roles in regulating perinatal lung liquid absorption. As such, the utilization of real time X-ray imaging to determine perinatal lung fluid clearance, or pulmonary edema, represents a technological advancement in the field. Herein, we explain and illustrate an approach to assess the rate of alveolar lung fluid clearance and alveolar flooding in C57BL/6 mice at post natal day 10 using X-ray imaging and analysis. Successful implementation of this protocol requires prior approval from institutional animal care and use committees (IACUC), an in vivo small animal X-ray imaging system, and compatible molecular imaging software.
At birth, the newborn lung must transition from a fluid secreting to a fluid reabsorbing organ to establish adequate ventilation and oxygenation of the body. The mechanisms that facilitate (or hinders) effective clearance of lung fluid at the time of birth remain unclear. Modeling the rate of alveolar fluid clearance in C57BL/6 newborn mouse pups will lead to a better understanding of regulatory factors that can enhance or attenuate the rate of fluid absorption. It could also be applied to other neonatal models of acute lung injury or infection, and could lead to novel therapeutic strategies for newborn infants with respiratory distress.
Since newborn lungs are minuscule compared to adult lungs, conventional measures of alveolar fluid clearance that rely on lavage or gravimetrical measurements may not be suitable to accurately study lung fluid clearance in neonatal lung models. In this protocol, we demonstrate an assay that allows for the accurate determination of alveolar fluid clearance rates in postnatal day 10 C57BL/6 mouse pups using a small animal imager. One major benefit of using a fluoroscopic approach is that the animals are imaged in vivo. They are freely breathing and may recover from this minimally invasive assay for future observation and study. The overall goal of this method is to model pulmonary edema in the newborn lung, and evaluate the rate of alveolar fluid clearance in neonatal lung. This technique was developed, in part, as a reduction strategy to decrease the number of animals needed, yet maximize experimental output. This technique also allows for superior detection of lung fluid volumes using X-ray imaging and requires proficiency in basic animal restraint and handling1; small animal surgeries and tracheal instillation2, a small animal imager, and basic image analysis software. Investigators who wish to evaluate lung fluid volumes in vivo (freely breathing anesthetized animal models) may find this procedure suitable for their application. Lastly, this protocol could augment other existing models of neonatal lung injury used in the mechanistic study of bronchopulmonary dysplasia, including hyperoxia-induced lung injury, mechanical ventilation, and models of lung inflammation3.
All experimental techniques must be conducted in accordance with Institutional Care and Use Committee guidelines.
1. X-ray Imaging Acquisition
2. Illumination Reference Files
Note: Apply X-ray illumination reference files to an X-ray image in order to automatically correct for variations in detector uniformity of the X-ray images obtained throughout experiment. The procedures outlined below are specific to the Bruker In Vivo Animal Imaging Systems; other in vivo imaging systems may be used.
3. Animal Handling
4. Tracheal Instillations
5. Animal Imaging
6. Data Analysis
Note: Molecular imaging software allows for quantification and the translation of X-ray pixel intensity into rate of lung fluid clearance. The steps below outline the procedures needed to normalize X-ray images and quantify intensities in defined regions of interest (ROI).
The left panels in Figures 9 – 10 are of PN 10 mouse lungs imaged at baseline (pre-instilled). These images show successful instillation of saline challenges into the left lobe of the neonatal lungs. In Figure 9, the mouse lung was tracheally instilled with the saline solution defined above (see section 2.1). The middle and right panels of Figure 9 are X-ray images from the same mouse obtained 5 min and 2 hr post instillation; this animal had successfully cleared the saline challenge. Specifically, the X-ray intensity of this animals ROI increased from 187.67 to 515. Thus, there is a reverse correlation between pixel density and lung fluid volume; that is to say, the larger the relative value, the less fluid there is in the lungs. It may be helpful to understand that more X-ray energy is absorbed (hence a larger reported value) when there is less fluid attenuating the X-ray. In Figure 10, the PN 10 mouse lung was tracheally instilled with a compound containing oxidized glutathione (reconstituted in saline described in 2.1) that inhibited alveolar fluid clearance of the saline challenge by blocking epithelial sodium channel activity; the numerical value of this animal's ROI will decrease from the pre-instill and post-instilled X-ray imaged files, indicative of increasing X-ray opacity. Specifically, the net intensity of the animal approximately 5 min post-instillation was – 64, and decreased to – 182. Again, note the inverse relationship between the ROI pixel intensity and amount of fluid in the lungs; increased fluid in the upper left lobe of the lung attenuates X-ray absorbtion.
Evaluating net intensity of the ROI enables quantitative evaluation of changes in the rate of lung fluid clearance, albeit acquisition software also allows the investigators to express data in terms of g/cm3 if desired. Moreover, the investigators can use each animal as its own control and normalize all X-ray intensities to an initial time point (Io), such as t = 5 min and report net changes in X-ray opacity (i.e., a measure of change in lung fluid volumes).
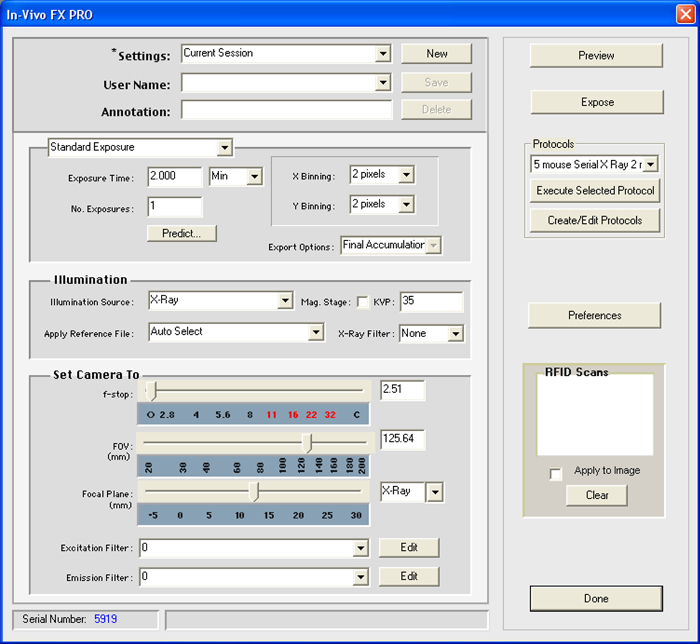
Figure 1. Exposure Settings. This screen shot illustrates the appropriate exposure settings utilized in this protocol. Please click here to view a larger version of this figure.
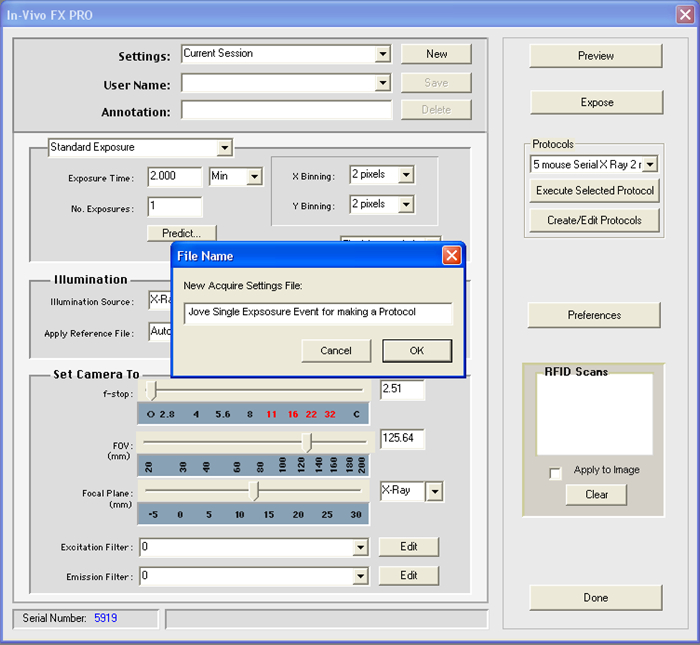
Figure 2. Settings File. This screen shot illustrates a key step in generating a file setting that will be used in a protocol. A pop up window (as shown) will request a new name for the acquisition settings file. Please click here to view a larger version of this figure.
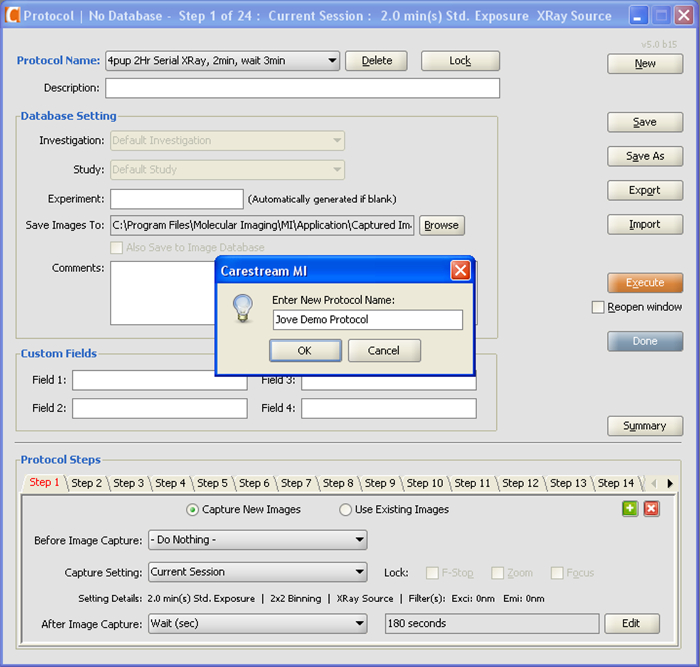
Figure 3. Imaging Protocol. This screen shot illustrates a key step in determining whether a new imaging protocol has been successfully created. A pop up window (as shown) will appear and a new protocol name will be requested for the generated protocol. Please click here to view a larger version of this figure.
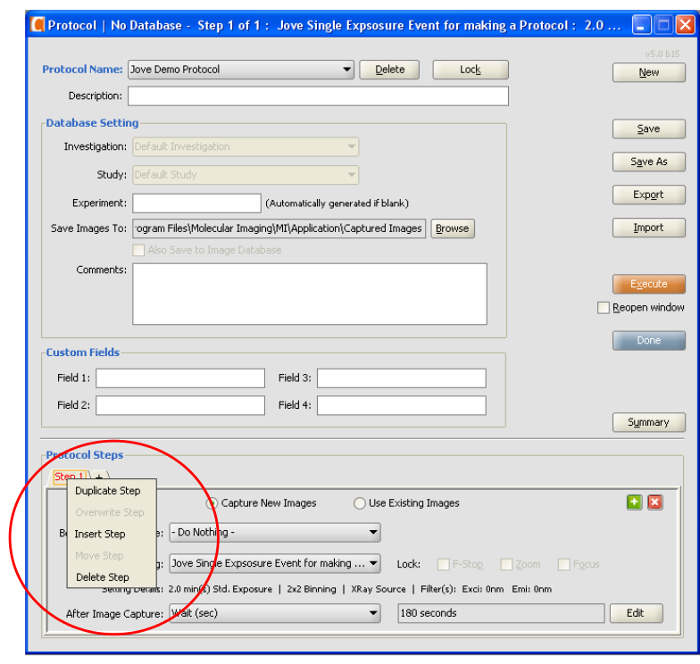
Figure 4. Protocol Steps. This screen shot illustrates a shortcut to duplicate an acquisition settings file, insert a new step, or to delete a step within an imaging protocol. Please click here to view a larger version of this figure.
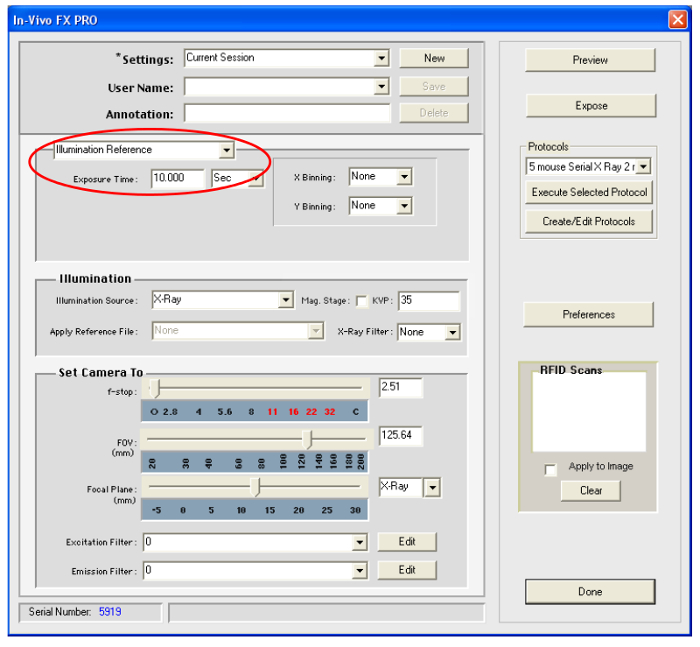
Figure 5. Illumination Reference. This screen shot exhibits the illumination reference command and appropriate settings in the animal imaging software appropriate for creating an illumination reference file. Please click here to view a larger version of this figure.
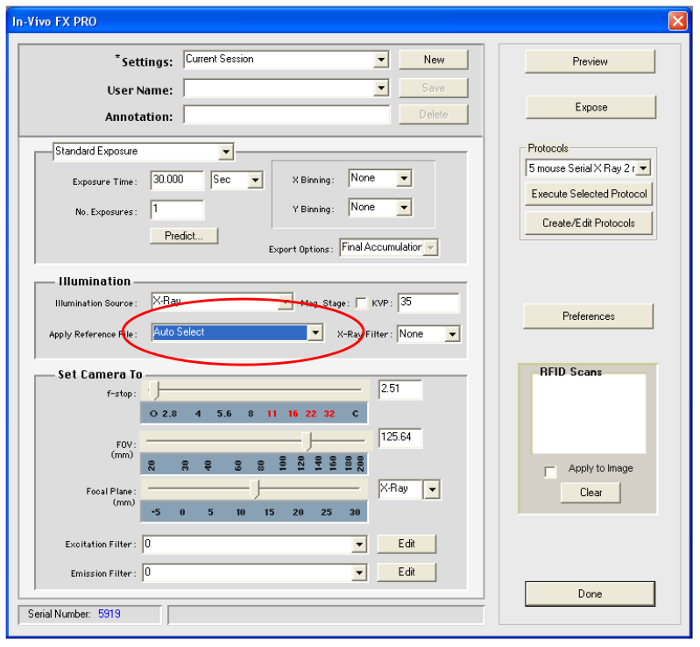
Figure 6. Auto Select. This screen shot exhibits the Auto Select function and appropriate settings in the animal imaging software appropriate for applying an illumination reference file. Please click here to view a larger version of this figure.
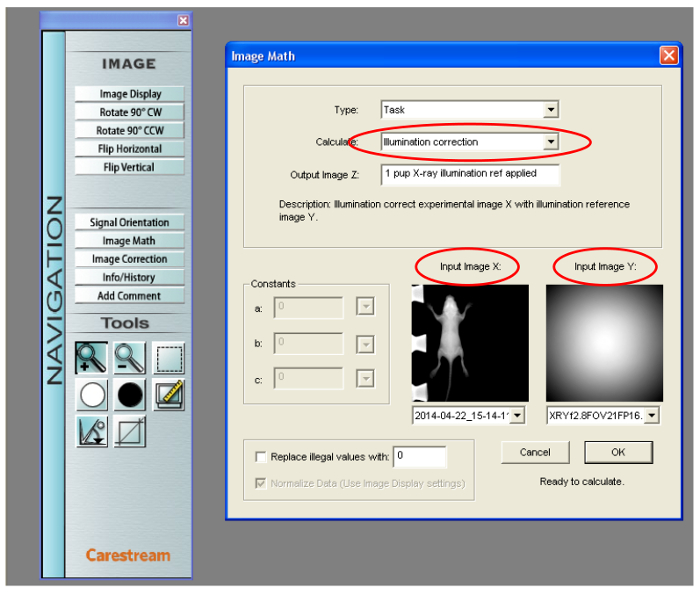
Figure 7. Illumination Correction. This screen shot illustrates the appropriate application of an illumination reference file generated after animal imaging. Please click here to view a larger version of this figure.
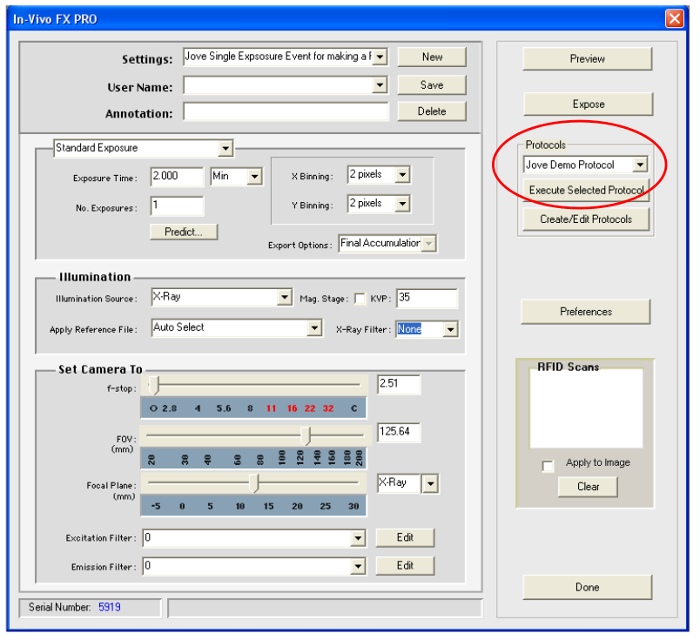
Figure 8. Execute Protocol. This screen shot illustrates how to execute a selected protocol. Please click here to view a larger version of this figure.
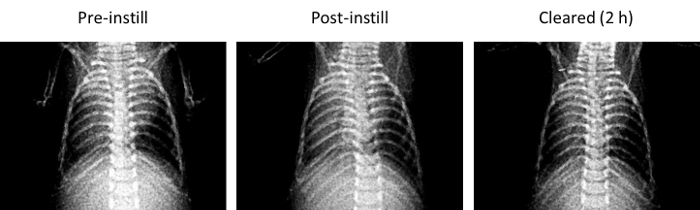
Figure 9. X-ray images of cleared lungs. Representative image of PN 10 lungs prior to receiving a saline challenge (pre-instill; left panel); 5 min post-instillation (middle panel), and 2 hr after the saline challenge had cleared from the otherwise healthy lung (right panel). Please click here to view a larger version of this figure.
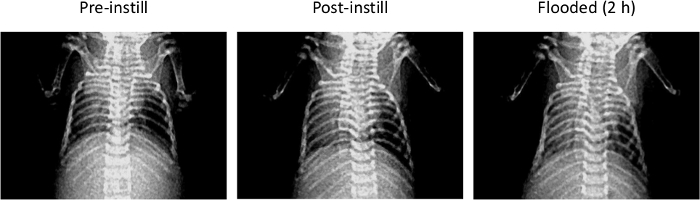
Figure 10. X-ray Images of Flooded Lungs. Representative image of PN 10 lungs prior to receiving a saline challenge (pre-instill; left panel) containing glutathione disulfide , which inhibits paracellular solute transport; 5 min post-instillation of glutathione disulfide (middle panel), and 2 hr after inhibiting paracellular transport which leads to alveolar flooding (right panel). Please click here to view a larger version of this figure.
No filter= | 10 sec exposure |
0.1mm = | 15 sec exposure |
0.2mm = | 20 sec exposure |
0.4mm = | 30 sec exposure |
0.8mm= | 30 sec exposure |
The size of the X-ray filter correlates to a specific exposure time for creating an illumination reference file. |
Table 1. Illumination Reference File. This file reports the appropriate exposure times for generating illumination reference files based on X-ray filters used in imaging studies.
Using X-ray imaging, clear images of neonatal lungs can be analyzed for lung fluid volumes. We7,3,11, and others10, have successfully utilized X-ray imaging to determine dynamic changes in lung fluid volume in freely breathing anesthetized animal models, and this technique holds great promise to advance the study of neonatal lung injury. One major advantage in using our approach to assess lung fluid volume (as opposed to x-ray phase constrast10 for example) is that up to five PN10 mouse pups can be simultaneously studied using an imaging system that is common place in research facilities and cores.
Instilling an appropriate lung fluid volume, as to not drown or collapse the lung, is critical to the successful implementation of this protocol and may need to be experimentally explored before X-ray imaging protocols can be applied. The sensitivity of this assay allows for the detection of very small volumes of instilled saline via X-ray detection. We have been able to discern differences in the X-ray opacity of neonatal lungs instilled with 10 μl volumes of saline solution. The difference in X-ray opacities are even more pronounced when sodium channel inhibitors are introduced into the alveolar airspace because the saline challenges cannot be absorbed and the lungs continue to secrete fluid into the airspace. In the event that an inappropriately high volume of saline is introduced, placing animals into the imaging chamber with oxygen flowing into the chamber via the anesthesia ports can facilitate respiration in flooded lungs.
Our results using X-ray imaging are comparable to alveolar fluid clearances measured using more conventional approaches, such as lung wet-to-dry weight ratios and Evan's Blue for the determination of protein concentration4. We now demonstrate that this approach can be applied to the neonatal mouse pup. This X-ray imaging technique for determining lung fluid volumes can easily be combined with additional imaging modalities. For instance, fluorescent markers or bioluminescent probes can be simultaneously instilled into the alveoli and assessed. (Detection of fluorescent and luminescent probes has been described8, and is beyond the scope of this report). The ability to co-register the volume of lung fluid (using X-ray imaging) alongside the ability to detect fluorescent biomarkers is one of several advantages of using this dynamic assay and the commercial system for measuring lung fluid clearance. Other benefits of utilizing this approach for determining clearance and relative lung fluid volume includes the ability to conduct longitudinal studies (thus decreasing the number of animals needed to achieve statistically significant observations), and the ability to detect small changes in lung fluid volume in freely breathing, anesthetized, neonatal mouse pups. One limitation of using an in vivo imaging approach, however, is that the anesthesia can alter the distribution of gas and blood flow within the lungs. Mismatches in ventilation and perfusion (V/Q) and shunting have been shown to increase under anesthesia in healthy adult volunteers12, thus reducing oxygenation of the body. This adverse effect, however, can be compensated for by increasing the inspired oxygen concentration. From a technical viewpoint, variability between imaging systems in X-ray flux energy may require optimization of each system prior to performing imaging studies. For example, on a system with an X-ray source with more flux and/or a detector with superior quantum efficiency, a higher f/stop and lower binning state might provide better image quality when assessing small change in X-ray impedance.
The authors have nothing to disclose.
This work is supported by a grant awarded to MNH by Children’s Healthcare of Atlanta, the APS 2014 Short-Term Research Education Program to Increase Diversity in Health-Related Research (STRIDE) fellowship awarded to PT, and the University of Notre Dame Integrated Imaging Facility.
Preclinical Imaging System (In- Vivo MS FX PRO) | Bruker; Billerica, MA | |
Ketamine | Ketaset; Fort Dodge Animal Health, IA | 26637-411-01 |
Xylazine | Lloyd Laboratories; Shenandoah, IA | 4821 |
Dulbecco's Phosphate Buffered Saline (with Calcium and Magnesium) | Lonza; Walkersville, MD | 17-513F |
Sodium chloride | Amresco; Solon, OH | 241 |
Potassuim chloride | Fisher Scientific; Fair Lawn, NJ | P217-3 |
Calcium chloride | Sigma-Aldrich; St. Loius, MO | C5080 |
HEPES | Sigma-Aldrich; St. Loius, MO | H3375 |
0.3 mL insulin syringe with 31Gx5/16" (8mm) needle | BD Insulin Syringe; Franklin Lakes, NJ | 328438 |