1. 3D Mold Design and Parts
- Mold
- Before working, obtain a silicone elastomer kit, a live cell imaging chamber, a 22 mm glass coverslip, and a machined aluminum metal cube with dimensions 10.07 mm x 3.95 mm x 5.99 mm. Prepare the live cell imaging chamber for molding by placing the coverslip in the bottom holder and assembling the rest of the chamber as directed by the vendor.
- Next, using forceps, place the machined aluminum metal cube in the middle of the live cell imaging chamber housing and on top of the coverslip, and then set aside.
- Mix silicone elastomer solutions according to manufacturer’s protocol to make 5 ml of elastomer.
- Using a disposable lab spatula, pour silicone elastomer solution into live cell imaging chamber setup and ensure not to move placed machined aluminum metal cube. Place the system on the lab bench, in a safe location O/N for curing.
- The next morning, deconstruct the live cell imaging chamber, as recommended by the manufacturer and pull out mold using forceps. Using forceps, carefully extract the machined aluminum metal cube from mold. Go to the sink and rinse the mold with deionized water. Place the mold on a paper towel to dry.
- Once dry, using a hobby utility knife, cut slits through the mold, spaced 2.34 mm apart from each longitudinal end, inside the silicone mold. Ensure the mold stays in a safe and dry place until you are ready to construct the system for an experiment.
- Hydrophilic and Hydrophobic Glass Coverslips Preparation
- To allow the collagen matrix to adhere to a surface, create hydrophilic coverslips:
- Using a disposable pipette, measure out 150 µl of 3-aminopropyl-trimethoxysilane and pour solution in a 50 ml tube. Add 30 ml of 100% ethanol to the 50 ml tube with a second disposable pipette and close the lid. Vortex the solution for 2 min, ensuring complete mixing. Pour solution in a glass Petri dish and set aside.
- Pour 15 ml of 100% ethyl alcohol in a second Petri dish and set aside (make sure to label dishes).
- Using a new disposable pipette, measure out 30 ml of deionized water and pour solution into a 50 ml tube. Next, using a new disposable pipette measure out 1,875 µl of glutaraldehyde and pour solution into the same 50 ml tube and close the lid. Vortex the solution for 2 min, ensuring complete mixing. Pour mixture into third Petri dish, and set aside.
- Using forceps, take out one 22 mm round glass coverslip and rinse both sides with 100% ethanol mixture using a disposable pipette.
- Place rinsed glass coverslip into 3-aminopropyl-trimethoxysilane with 30 ml of 100% ethanol solution dish and allow to sit in solution for 5 min.
- With forceps, take out glass coverslip and rinse again with 100% ethanol solution with disposable pipette.
- Drop rinsed glass coverslip into 1,875 µl of glutaraldehyde and 30 ml of deionized water mixture and set aside for 30 min.
- After 30 min, remove glass coverslip with forceps and rinse with deionized water and place onto dry tissue O/N to dry at RT.
- Repeat coverslip dipping and moving for as many coverslips as needed with the same generated solutions.
- Make hydrophobic coverslips by the given protocol.
- Add 500 µl of tridecafluoro-1,1,2,2-tetrahydrooctyl, 100 µl of acetic acid and 19.4 ml of hexane in a 50 ml tube and vortex for 2 min. Pour solution in glass Petri dish and set aside.
- Using clean forceps, take out one glass coverslip and drop into prepared mixed solution for 2 min. After 2 min have passed, take out glass coverslip with forceps and rinse with deionized water using a disposable pipette and place coverslip onto dry tissue O/N to dry at RT. Store coverslip in plastic Petri dishes until used.
- Repeat coverslip dipping and moving for as many coverslips as needed with the same generated solutions.
- To allow the collagen matrix to adhere to a surface, create hydrophilic coverslips:
2. Mold Assembly
- Before using molds, using a disposable pipette rinse the mold with 90% ethyl alcohol over a chemical waste container. Next, place the mold in a Petri dish filled with deionized water and allow to sit O/N.
- Take mold out of solution using forceps and place on a towel to air dry before starting the mold assembly.
- While the mold is air-drying, cut the square hydrophilic coverslips into two rectangles slightly larger than 3.95 mm x 5.99 mm using a high-precision diamond-scribing tool. Slide each cut rectangle coverslip into the slots cut into the silicone mold.
- Flip the mold upside down and apply vacuum grease along the bottom of the silicone mold using a disposable pipette. Next, flip the mold back right-side up and press the bottom of the mold onto the circular hydrophilic glass coverslip to create a seal.
- With disposable gloves, pick up the assembled mold and place into a disposable Petri dish and then into a bio-hood. Turn on UV Bio-hood lamp for 1 hr to sterilize the mold before experimentation occurs.
3. Collagen Mixture and 3D Matrix
- Before preparing the collagen mixture, stain and prepare cells for imaging according to standard protocols28.
- Using standard laboratory techniques and protocols29,30, in a bio-hood, mix cell media and chemoattractant in a 15 ml tube to desired chemoattractant concentration. Pipette 5 ml of specific cell media-chemoattractant concentration solution into a 15 ml tube and move the solution into a heated water bath.
- Using a pipette, extract 5 ml of just cell media into a second 15 ml tube and place in a heated water bath to heat up the solution for microscopy experiments.
- In a bio-hood, pipette 30 µl of 10x phosphate buffered solution (PBS) into micro centrifuge tube. Add 6 µl of 1 N sodium hydroxide (NaOH) into same micro centrifuge tube and vortex for 15 sec.
- Obtain collagen I rat tail solution from the fridge and move to the bio-hood using standard laboratory techniques and protocols29. Ensure the collagen is still cold. Pipette 168.3 µl of collagen into same micro centrifuge tube.
- Next, add 18 µl of yellow-green fluorescent carboxylate-modified microspheres using a pipette to the same micro centrifuge tube. Vortex the micro centrifuge tube with all the solutions for 30 sec.
- Add 77.7 µl of desired cell media-cell mixture (approximately 2 x 10⁶ cells/ml concentration) into micro centrifuge tube and mix using pipette tip for 20 sec. As necessary, alter the matrix density by following the custom collagen mixture adapted for the addition of fluorescent beads and cell viability table (Table 1).
- Pipette 300 µl of collagen-cell mixture into the center well (well #2) of the prepared mold assembly. Place the mold onto a disposable Petri dish and move it into a standard incubator for 20 min at 37 °C with 5% CO2.
- Remove system from incubator and place back into bio-hood. Using forceps, remove both hydrophobic cover slips by clamping onto the top of each coverslip and pulling up and away from the mold.
- Move the whole system to the desired microscopy and image to ensure collagen mold sides are still straight to allow for a planar diffusion gradient.
- With the system still under the microscope, using a 100 µl single-channel pipette, add 100 µl of cell media into well #1. Next, using a 100 µl single-channel pipette add 100 µl of cell media with desired chemoattractant concentration into well #3.
- Immediately after adding solutions into both wells, commence imaging.
4. Imaging and Diffusion Modeling
- If one wants to find the diffusion coefficient for the specific collagen density to calculate the specific concentration, follow the protocol below:
- Follow the given protocol above titled “Collagen Mixture and 3D Matrix,” instead of generating cell media with desired chemoattractant concentration, make 5 µM rhodamine in a 15 ml tube using standard calculations and protocols30.
- Image the 3D collagen matrices with a confocal system mounted on an inverted microscope using an argon laser (488 nm) to capture the fluorescence. Image every 2 or 3 sec for up to 7 hr.
- For Diffusion Modeling: Using the mathematical model shown below, write a computational software code for processing and analysis with these general steps.
- Import images into computational software for rescaling and normalizing by the maximum intensity. Convert images to a gray color-map of the image to select the edge. Pick an axis along the center of the image, to the right of the center and to the left of the center.
- Using the computational software code, plot the normalized intensity, along with the true intensity and the difference between the two.
- Next, input the parameters necessary for fitting (concentration, time, and length).
- Plot the normalized concentration versus time and the concentration profile across the x-axis with a polynomial fit to the data.
- Calculate the coefficient of diffusion using the computational software code.
5. Experimental Measurements
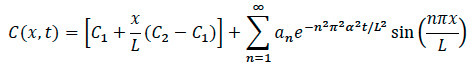
- Referring back to the diffusion equation, rewrite the equation to find the specific concentration at any location within the system as shown in below.
Where:
L = Length of the collagen matrix
x = location under investigation
D = coefficient of diffusion
t = elapsed time - During chemotaxis experiments, ensure to record the specific time that the moment chemokine was added to system. Once cell migration movement is found, ensure to record confocal time-lapse recording, and note the specific time and location from edge where imaging occurred.
- During data analysis, plug the noted elapsed time, location and coefficient of diffusion for the specific cell into the equation to find the normalized specific concentration at any point within the collagen for both diffusion and cell experiments.
6. Tracking Cell Migration Utilizing TFM
- To track cell migration using TFM/DVC techniques follow the protocol below:
- After the addition of desired chemoattractant concentration into well #3, start imaging the 3D collagen matrices with a confocal system mounted on an inverted microscope to find a cell to investigate.
- Once a moving cell is found, place the cell in the middle of the field of view and utilize a piezoelectric motor (to image in the z-axis), image every 1 or 2 min.
- For calculating cell force generation and deformation, generate a computational code to find the displacements of the fluorescence beads following the TFM/DVC protocols31.
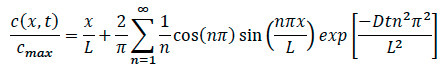
The ability of this assay to accurately assess the migration of the cell relies upon a good setup of the system. Therefore, it is critical for make sure to design the diffusion system mold accurately and take great care in placing both hydrophobic and hydrophilic coverslips, as illustrated in Figure 1. If the system is properly designed and during the diffusion modeling stage ensuring to find a very good linear starting line, one is able to achieve nice fluoresces images, as depicted in Figure 2, for analyzing diffusion of the system.
The key to a successful cell chemotaxis analysis is modeling the diffusion and solving the general diffusion equation to find the coefficient of diffusion and specific concentration equation through a computational software generated code. After importing the images into computational software and running analysis (Figure 3), the coefficient of diffusion can be assessed (Table 2). Figure 4 represents the plots of the diffusion of rhodamine through the five tested collagen concentrations. The shapes of the diffusion plot match the traditional shape of a linear diffusion model. It can be seen that diffusion of rhodamine is inversely proportional to the concentration of collagen—the lower the collagen density the faster the diffusion. This is to be expected, as this concentration of collagen has a higher porosity. The horizontal lines in the collagen diffusion plot at a concentration of 1.5 mg/ml (Figure 4B) are simply the result of over saturation of the tracer signal. More importantly, as shown in Figure 4 each line represents a specific point (x, y) inside the collagen, to whereas time increases the normalized concentration never exceeds the previous point at the same time (dt), indicating no reversal of the chemical. This is an important characteristic of a chemotaxis chamber to allow direct flow of a chemoattractant without reverse flow.
By examining the last ten images at each x location, one is able to generate a plot of the steady-state concentration of rhodamine at each of the locations. By extrapolating across the entire sample length (Figure 5), one can to look at the whole sample. This indicates that the linear diffusion gradient is consistent across the entire sample length, which can be utilized for cell experiments (Figure 6).
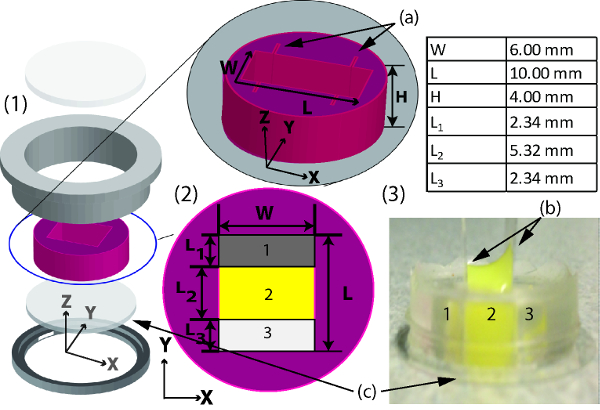
Figure 1: A schematic of planar gradient diffusion system mold assembly in live cell imaging chamber. (1) A computer rendition of the complete system consisting of (from bottom to top) a bottom housing (c) a hydrophilic 22 mm coverslip, mold, top housing, and a glass cover. (2) Dimensions of mold where (a) cut inserts are shown. (3) Mold with collagen matrix with (b) hydrophobic coverslips on each side slid into the cut inserts to create the 3-well system. Please click here to view a larger version of this figure.
Figure 2: Example of rhodamine microscopy images in collagen. Representative images taken during rhodamine diffusion experiments, at same z-axis location, in the planar gradient diffusion system with a 1.0 mg/ml collagen concentration. Scale bar = 500 µm where (a) is 0 min (b) 3 min (c) 7 min, and (d) 15 min after rhodamine was added to chamber. Arrow indicates direction of diffusion of rhodamine through the collagen matrix. Please click here to view a larger version of this figure.
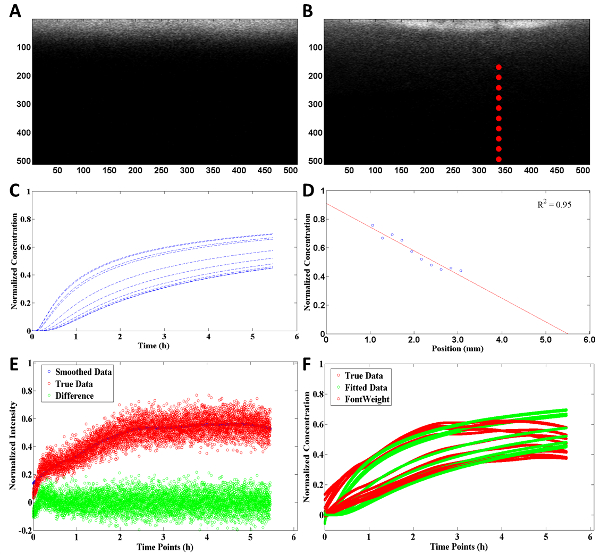
Figure 3: Example of analysis and summary of diffusion calculations generated by computational software code with a 2.5 mg/ml collagen concentration. (A) Black and white rendering of initial (dt = 0) image uploaded into computational software for analysis. (B) Specific points chosen by the user for intensity comparison and for diffusion calculations (x, y-axis are in pixels). (C) Diffusion profile of rhodamine throughout the collagen matrix where each line correlates to a red point in image B. (D) Concentration profile of rhodamine throughout the collagen matrix at steady-state. (E) Comparison between the smoothed data (blue dot) and true data from diffusion experiment (red dot) with difference between smoothed and true (green dot). (F) Normalized concentration of true (red dot) and fitted (green dot) data from computational software code throughout the experiment. Please click here to view a larger version of this figure.
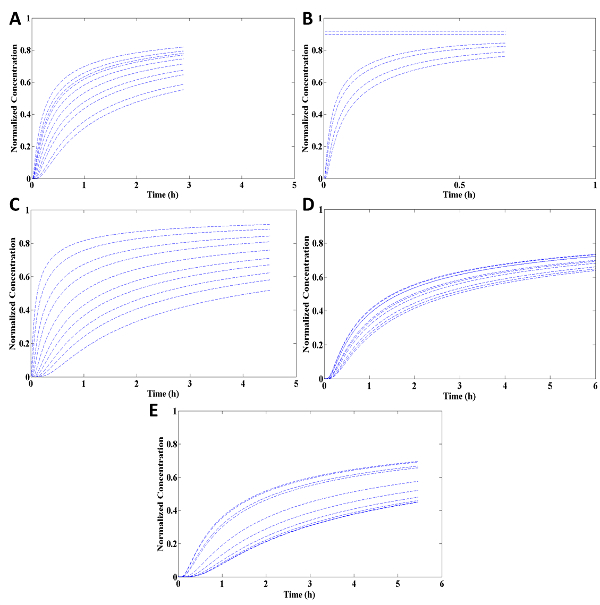
Figure 4: Example of diffusion profile through collagen matrix using the planar gradient diffusion system at different points. Each line indicates a different selected data points chosen from the computational software code by the user. Collagen matrix at a density of (A) 1.0 mg/ml (B) 1.5 mg/ml (C) 2.0 mg/ml (D) 2.2 mg/ml and (E) 2.5 mg/ml. Please click here to view a larger version of this figure.
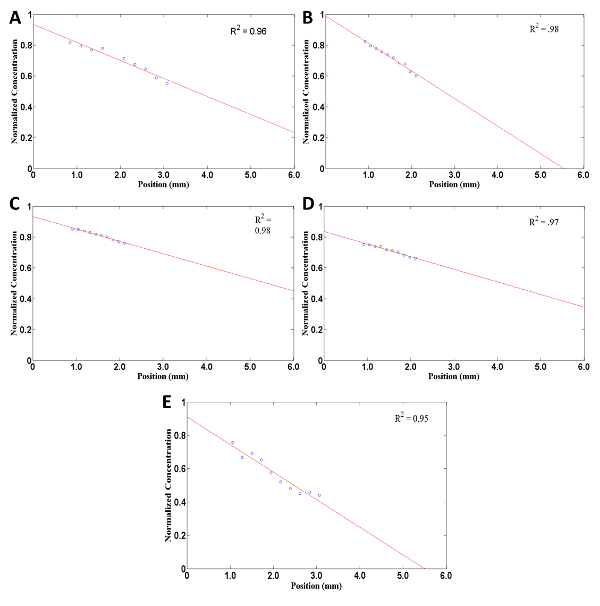
Figure 5: Example of a concentration (normalized) profile of rhodamine throughout the collagen matrix using the planar gradient diffusion system at steady-state. Circles are specific data points chosen though the computational software code by the user. Red line constructed using data points and extrapolating best line-fit (with R2 value shown) to show rhodamine concentration throughout the whole collagen matrix. Collagen matrix at a density of (A) 1.0 mg/ml (B) 1.5 mg/ml (C) 2.0 mg/ml (D) 2.2 mg/ml and (E) 2.5 mg/ml. Please click here to view a larger version of this figure.
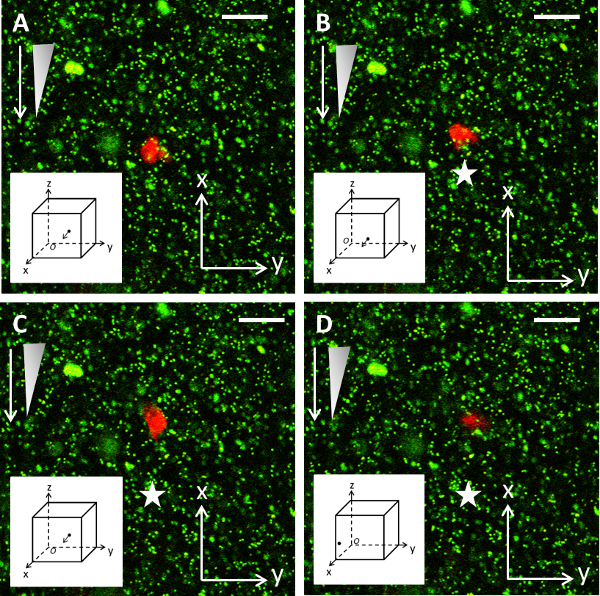
Figure 6: Example of cell migration experiments. A Z-slice microscope image of a neutrophil migrating in the 3D planar gradient system. Neutrophil migrates towards the chemoattractant gradient (white arrow depicts direction of gradient and the triangle shows its concentration profile), where the star indicates the initial position of the cell at the start of the experiment. Subplot shows cell in 3D space, where arrow indicates next time-point direction. Scale bar = 10 µm. dt = 5 min between images (i.e., A-B). Please click here to view a larger version of this figure.
| Collagen Cell Density | PBS | Fluorescent beads | NaOH | Collagen I Rat Tail | Media |
| 2.5 mg/ml | 10% | 6% | 2% | 70.20% | 11.80% |
| 2.2 mg/ml | 10% | 6% | 2% | 61.70% | 20.30% |
| 2.0 mg/ml | 10% | 6% | 2% | 56.10% | 25.90% |
| 1.5 mg/ml | 10% | 6% | 2% | 42.10% | 39.90% |
| 1.0 mg/ml | 10% | 6% | 2% | 28.10% | 53.90% |
Table 1: Custom collagen mixture adapted for the addition of fluorescent beads and cell viability.
| Concentration of collagen Gel | Coefficient of Diffusion (cm2/sec) |
| 2.5 mg/ml | 1.03 x 10⁻⁶ ± 2.54 x 10⁻⁷ |
| 2.2 mg/ml | 1.28 x 10⁻⁶ ± 3.53 x 10⁻⁷ |
| 2.0 mg/ml | 6.48 x 10⁻⁶ ± 1.66 x 10⁻⁷ |
| 1.5 mg/ml | 1.05 x 10⁻⁵ ± 2.04 x 10⁻⁷ |
| 1.0 mg/ml | 1.39 x 10⁻⁵ ± 1.06 x 10⁻⁷ |
| Water | 1.50 x 10⁻⁵ |
Table 2: Coefficients of diffusion.
