This protocol follows the guidelines of and has been approved by the human research ethics committee of Georgia Institute of Technology.
1. Human RBCs Isolation, Biotinylation and Osmolarity Adjustment
Note: Step 1.1 should be performed by a trained medical professional such as a nurse, with an Institutional Review Board approved protocol.
- Obtain 8-10 µl (one drop) of blood from finger prick and add to 1 ml of the carbonate/bicarbonate buffer (Table 1 and 2). Gently vortex or pipette the mixture and centrifuge for 1 min at 900 x g. Discard supernatant and wash once more.
- In a small beaker weigh 3.5-4 mg of Biotin-PEG3500-NHS linker (Table 1). Dissolve it in the carbonate/bicarbonate buffer to make the final concentration 3 mg/ml.
- Mix 171 µl of carbonate/bicarbonate buffer, 10 µl of RBC pack and 1049 µl of Biotin-PEG3500-NHS linker solution and incubate at RT for 30 min. Wash the RBC once with carbonate/bicarbonate buffer and then twice with N2-5% buffer (Table 1 and 2).
- Meanwhile, place the linker bottle with loosened cap in a glass vacuum desiccator filled with desiccants in the bottom and vacuum for 5 min, and fill the desiccator with argon. Tighten the cap and take the bottle out. Seal the bottle with plastic paraffin film (Table 1), place it into a container filled with desiccants on the bottom and store in -20 °C.
Note: The steps that involve the use of Biotin-PEG3500-NHS linker, including 1.2-1.4 (except for the incubation and wash in 1.3), need to be performed as fast as possible. - Dilute nystatin into N2-5% buffer to make a final concentration of 40 µg/ml. Mix 5 µl of biotinylated RBC with 71.4 µl of nystatin (Table 1) solution and incubate for 1 hr at 0 °C. Wash twice with N2-5% buffer and store with N2-5% buffer + 0.5% BSA (Table 1) in the refrigerator (4 °C).
2. Glass Bead Silanization
- Cleaning of Bead Surface
- Weigh 50 mg of glass beads powder and re-suspend them in 500 µl of DI water.
- Mix 0.5 ml of 30% H2O2 (Table 1) with 9.5 ml of DI water in a 50 ml beaker, then add 2 ml of concentrated NH4OH (Table 1) and bring this solution to a boiler on a hot plate.
- Add the glass beads to the boiling solution and continue to boil for another 5 min. Gently swirl the solution every min.
- After boiling, transfer ~5 ml of this hot bead suspension into a 15 ml micro-centrifuge tube and top up with RT DI water. Centrifuge at 3,500 x g for 5 min, remove and discard the supernatant.
- Transfer another 5 ml of hot bead suspension and add to the washed beads, top up with more DI water, mix well, and centrifuge again. Repeat this procedure until about 50 ml of DI water is used, which will be a total of 4 to 5 times of washing.
- Transfer the bead suspension into a 1 ml vial. Repeat washing the beads with methanol (Table 1) by centrifugation at 17,000 x g for 5 min for 3 times, and finally re-suspend the beads in 1 ml of 100% methanol.
- Bead Surface Thiolation
- To a 50 ml centrifuge tube add 45.6 ml of methanol, 0.4 ml of acetic acid (Table 1), 1.85 ml of DI water, 1.15 ml of 3-Mercaptopropyltrimethoxysilane (MPTMS) (Table 1) and 1 ml beads suspension prepared in 2.1, then incubate at RT for 3 hr.
- After the reaction, remove all the reactants by washing once with fresh methanol, and re-suspend the beads into 500 µl of methanol. Evenly divide this concentrated glass bead suspension into a set of 20 dry and clean glass vials with screw caps. Evaporate off the methanol by using a jet of dry argon and slowly rotate the vials so as to make a thin layer of dry beads on the sides of each vial.
- Place the vials of beads into a pre-heated drying oven at 120 °C for 5 min and then take out and quickly place the cap(s) loosely on. Place the vials in a glass vacuum desiccator filled with desiccants in the bottom and vacuum the desiccator with a vacuum pump until cooled.
- Purge the vacuumed desiccator with dry argon to bring the desiccator to normal atmospheric pressure. Remove the desiccator lid and quickly re-tighten the cap(s) on the vial. Seal the vials with plastic paraffin film and store them at RT in a dry dark storage box.
- Upon immediate use, take one vial of dry beads and wash once with phosphate buffer (Tables 1 and 2), re-suspend into 50 µl of phosphate buffer and store at 4 °C. This concentrated bead preparation will be referred to as “MPTMS beads” in the following steps.
Note: With proper storage, MPTMS beads could remain functional for up to three months.
3. Bead Functionalization
- Covalently Coating Proteins on Beads
- Take a certain volume (e.g., 2.5 µl) of the protein stock and mix with equal volume of carbonate/bicarbonate buffer to make Solution 1.
Note: The volume depends on the stock concentration and the desired final site density of the protein on the beads surface. - In a small beaker weigh 2-3 mg of MAL-PEG3500-NHS linker (Table 1) and dissolve it with carbonate/bicarbonate buffer to reach a final concentration of 0.231 mg/ml.
- Mix Solution 1 with an equal volume of the linker solution prepared in 3.1.2. Incubate the mixture at RT for 30 min to make Solution 2.
- Meanwhile, place the linker bottle with loosened cap in a glass vacuum desiccator filled with desiccants in the bottom and vacuum for 5 min, and fill the desiccator with argon. Tighten the cap and take the bottle out. Seal the bottle with plastic paraffin film, place it into a container filled with desiccants on the bottom and store in -20 °C.
Note: The steps that involve the use of MAL-PEG3500-NHS linker, including 3.1.2-3.1.4 (except for the incubation in 3.1.3), need to be accomplished as fast as possible. - Mix 5 µl of MPTMS beads with Solution 2 and add phosphate buffer (Table 1) to make a final volume of 250 µl.
- Incubate the beads overnight at RT, wash 3 times with phosphate buffer, and re-suspend into 100 µl of phosphate buffer and store at 4 °C.
- Take a certain volume (e.g., 2.5 µl) of the protein stock and mix with equal volume of carbonate/bicarbonate buffer to make Solution 1.
- Preparing Protein/Streptavidin (SA) Coated Beads
- Follow protocol 3.1.1-3.1.4.
- Mix 5 µl of MPTMS beads with Solution 2 and 5 µl of 4 mg/ml Streptavidin−Maleimide (SA-MAL) (Table 1) solution and then add phosphate buffer to make a final volume of 250 µl.
- Incubate the beads overnight at RT, wash 3 times with phosphate buffer, and finally re-suspend into 100 µl of phosphate buffer and store at 4 °C.
- Coating Streptavidin onto Glass Beads
- Mix 5 µl of MPTMS beads with 5 µl of 4 mg/ml SA solution and add 140 µl of phosphate buffer.
- Incubate the beads overnight at RT, wash 3 times with phosphate buffer, and re-suspend into 50 µl of phosphate buffer and store at 4 °C.
- Coating the SA Coated Beads with a Biotinylated Protein
- Mix 5 µl of SA coated beads with the protein (volume depending on the desired coating density) and add phosphate buffer to make the final volume to be 100 µl.
- Incubate the mixture overnight at 4 °C or for 3 hr at RT, wash 3 times with phosphate buffer, and re-suspend into 50 µl phosphate buffer and store at 4 °C.
4. Cell Preparation
Note: To purify the cells, follow standard cell purification protocols corresponding to the type of cells in use, for example T-cells27 or certain cell lines21,29.
- For fBFP experiments, once the cell suspension is prepared, add Fura2-AM (Table 1) dissolved in DMSO into the cell suspension to reach a final concentration of 2 µM, incubate for 30 min at RT and then wash once. Keep this fluorescently loaded cell suspension in dark until use.
5. Preparation for Micropipettes and a Cell Chamber
- Preparing Micropipettes
- Cut long capillary glass tubes (Table 1) with a glass cutter into short pieces of around 3 inches in length. Mount one piece onto the micropipette puller (Table 1), click the “Pull” button so that the middle of the capillary will be heated by the machine and the capillary will be pulled on the two ends to make two capillaries with sharp tips (raw micropipettes).
Note: By following the product guideline, the desired morphology of the raw pipette has 6-8 mm taper and 0.1-0.5 µm tip. - Mount a raw pipette onto the pipette holder of the micropipette forge (Table 1). Heat to melt the glass sphere on the forge. Insert the tip of the raw pipette inside the glass sphere. Cool down the glass sphere and pull the raw pipette to break it from outside and leave its tip inside the sphere. Repeat this procedure until the desired tip orifice is obtained.
Note: Examples of a micropipette tip inner diameter: 2.0-2.4 µm for a RBC, ~1.5 µm for a bead, ~2-4 µm for a T-cell and -7 µm for a hybridoma cell.
- Cut long capillary glass tubes (Table 1) with a glass cutter into short pieces of around 3 inches in length. Mount one piece onto the micropipette puller (Table 1), click the “Pull” button so that the middle of the capillary will be heated by the machine and the capillary will be pulled on the two ends to make two capillaries with sharp tips (raw micropipettes).
- Building a Cell Chamber
Note: the cell chamber is built on the basis of a home-made chamber holder, which consists of two pieces of metal squares (copper/aluminum) and a handle that links them together (Figure 1D). - Cut a 40 mm x 22 mm x 0.2 mm coverslip using a glass cutter into two 40 mm x 11 mm x 0.2 mm pieces (coverslip 1 and 2). Glue coverslip 1 by grease to the top side of the chamber holder in the way that it bridges the two metal squares, and similarly glue coverslip 2 to the bottom side, which will form a parallel-coverslip cell chamber (Figure 1D).
- Use a pipette to inject 200 µl of experimental buffer in between the two coverslips. Make sure the buffer attaches to both coverslips. Gently rotate and shake the chamber to let the buffer touch both ends of the chamber.
- Carefully inject mineral oil into both sides of the chamber flanking the experimental buffer zone thereby sealing the buffer from the open air. Inject suspensions of probe beads (for example, pMHC-coated beads), RBCs and targets (for example, T-cells) in the upper, middle and lower regions of the buffer zone respectively.
6. BFP experiment
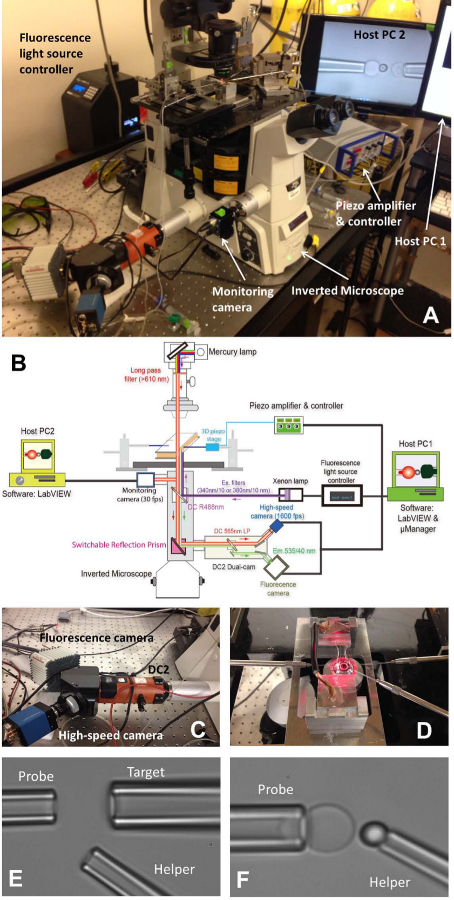
Figure 1: fBFP assembly. (A) An overview picture of the fBFP hardware system. (B) A schematic drawing of the fBFP hardware system. (C) The dual-cam system “DC2” (orange) onto which the high-speed camera (blue) and a fluorescence camera (white) were mounted. (D) The microscope stage that adapts an experiment chamber and three micropipette manipulation systems. (E and F) Micrographs of BFP setting in an experimental chamber. (E) Micropipettes assembly showing the probe pipette (left), target pipette (upper right) and helper pipette (lower right). (F) Probe bead placement. A probe bead was manipulated by a helper pipette and attached to a RBC apex to form a force probe. Please click here to view a larger version of this figure.
- Turn on the microscope (Table 1) and light source. Place the chamber onto the main microscope stage (Figure 1A, D).
- Install all three micropipettes of BFP (Figure 1D. Left: probe, to grab a RBC, right: target, to grab a cell or bead, lower right: helper, to grab a bead).
- Use a micro-injector (Table 1) to backfill a micropipette with experimental buffer. Take off the pipette holder (Table 1) and hold it at a lower place to allow water dripping from the tip. Quickly insert the micropipette into the holder tip and make sure no air bubble gets into the micropipette during the insertion. Tighten the holder screw.
- Mount each pipette holder onto its corresponding micro-manipulator. Push the micropipette towards the chamber so that their tips enter the chamber buffer area. Adjust the position of the micropipette and find them under the microscope field of view.
- Move around the chamber holder stage to find the colonies of three elements (the RBCs, the targets and the probe beads) one-by-one. Adjust the position of the corresponding micropipette by turning the knobs of the manipulators to let the tip of the micropipette approach one cell/bead. Aspirate the cell/bead by adjusting the pressure inside the corresponding micropipette. All three micropipettes will capture their corresponding elements.
- Move around the chamber holder stage to find an open space away from the colonies of the injected elements where the experiment will be performed. Switch the microscope visual mode to visualize the image on the computer program on the computer screen. Move all three elements on pipette tips into the program’s vision field.
- Align the probe bead and RBC, and carefully maneuver the probe bead to the apex of the RBC, briefly impinge the bead onto the RBC and gently retract. Adjust the pressure of the helper micropipette to gently blow the bead away, so that it will be left glued onto the RBC apex (Figure 1F). Move away the helper micropipette and align the target and probe bead (Figure 2A).
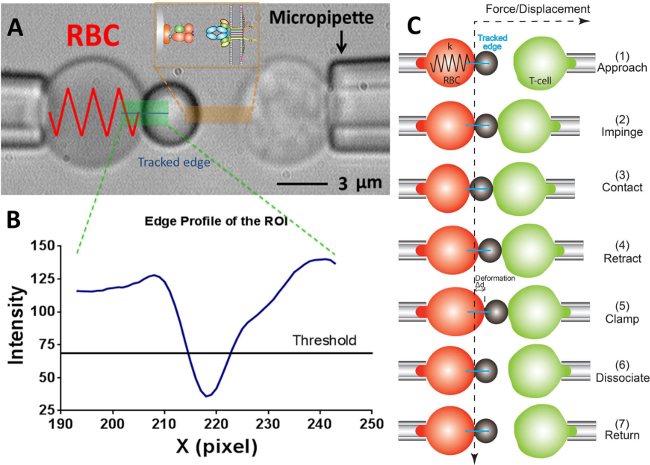
Figure 2: BFP scheme and its test cycle. (A) Video-micrograph depicting a force probe (left) and a target T-cell (right) aspirated by their respective pipettes.The stationary force probe consists of a swollen RBC and an attached ligand-bearing bead. The receptor-bearing T-cell (target) is mounted to a piezotranslator aligned opposite to the probe. The ROI is indicated in green. The edge tracker is indicated in a blue line. The insert depicts the ligand (pMHC, bead side) and receptor (TCR, T-cell side) pair on the two opposing surfaces in the area marked in orange. (B) The intensity profile of the bead edge in (A). The ROI region in the x-direction is plotted as x-axis (in pixel number) and the light intensity (in gray scale value) averaged by binning 30 pixels along the y-direction. (C) The deflection of the RBC and the position of the bead and the target (T-cell) in a test cycle of force clamp assay. The vertical and horizontal dashed lines indicate the zero-force position of the RBC apex and the time course, respectively. The line edge tracker of the RBC deformation is shown in blue in each panel. The same yet less steps are adopted in adhesion frequency assay (which lacks the steps of “clamp” and “dissociate”) and thermal fluctuation assay (which lacks the step of “dissociate”).
- On the program, in the vision field window use the tools in the program to measure the respective radii of the probe micropipette (Rp), the RBC (R0), the circular contact area between the RBC and probe bead (Rc), which allows the estimation of the spring constant of the RBC (k) by the following equation17,30,
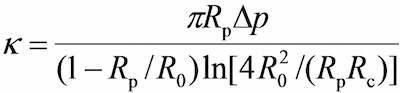
where Δp is the aspiration pressure at probe pipette tip.
Note: It follows from the Hooke's law that the binding force, F, can be quantified by the product of spring constant and displacement of the probe bead (d), i.e., F = d (Figure 2C). - Enter the desired RBC spring constant into the program (Please refer to Protocol section 6.6. The spring constant is typically set at 0.25 or 0.3 pN/nm for the force clamp assay and adhesion frequency assay and 0.1 pN/nm for the thermal fluctuation assay), which will return a required aspiration pressure in the unit of centimeter of water. Adjust the height of the water tank that links to the probe’s pipette until the required aspirating pressure is reached.
- Draw a horizontal line across the RBC apex, which will yield a curve in the adjacent window indicating the brightness (gray scale value) of each pixel along this line. Drag the threshold line to be at around half the depth of the curve (Figure 2A, B).
Note: The minimum point on the brightness curve below the threshold line indicates the position of the bead boundary, thus only one local minimum is allowed. If two or more local minima are at present, it indicates the image is not optimal (likely due to the image being out of focus, or a poor alignment between the probe bead and the RBC). - Select the desired experiment mode: thermal fluctuation assay, adhesion frequency assay or force clamp assay. Set the parameters as desired (e.g., impingement force = 15 pN, loading rate = 1,000 pN/s, contact time = 1 sec, clamping force = 20 pN (for force clamp assay), etc).
- Click “Start”, which allows the program to move the target pipette and drive the target in and out of contact with the probe (see Representative Results section for details). Data collection will be performed in parallel, which records the position of the probe bead in real-time. Stop the program by clicking on the button “Stop experiment”, at which time a window will pop out to allow saving the acquired data.
7. Fluorescence BFP (fBFP) experiment
- To use the fluorescence function of the BFP system, turn on the excitation light source (Table 1) and the fluorescence camera (Table 1), which are controlled by a separate program (Table 1). On the program, select the parameters for the fluorescence imaging, including gain, exposure, excitation channels (in this case, 340 nm and 380 nm light), etc. Follow all preparations in the BFP experiment protocol, including aligning the probe and the target, which will allow for visualization of the target cell live fluorescent image excited by 340 nm or 380 nm excitation light.
- Use the sectioning tool to roughly section the area within which the cell will stay during the entire recording period.
Note: Due to the use of the approach-contact-retraction cycle, the cell will be moving forward and backward repetitively, thus the sectioned area is much larger than the cell itself. - Click on “Record” to allow the 340 nm and 380 nm light to alternately excite the intracellular fluorescence dye (Fura2), and a pair of corresponding fluorescence images will be alternately recorded about once every second. Simultaneously click on “Start” in the program to begin the BFP experiment for analysis molecular interaction and the fluorescence imaging experiment to monitor intracellular calcium signaling. The system will produce a raw data file for the receptor-ligand binding (see Figure 6A below) and a series of fluorescent images in .tiff format for the calcium signals.
8. Data Analysis
- BFP Data Analysis
- Data analysis for adhesion frequency assay
- Sequentially inspect each cycle’s “force vs. time” signal and simply record which cycles contain an adhesion event and which do not, and summarize to yield an average adhesion frequency.
- Collect the rupture force of each adhesion event, which is the peak value of the linearly ramped force before bond rupture. After collecting a sufficient amount of rupture forces in a range of ramp rates, derive the rupture force distribution at each ramp rate from which the force-dependent off-rate of receptor-ligand dissociation is derived using dynamic force spectroscopy analysis18,31.
- Data analysis for thermal fluctuation assay
- Sequentially inspect the clamping phase signal of each cycle, which likely contains multiple bond association and dissociation events. Use the clamping phase thermal fluctuation level (the average standard deviation of a sliding interval of 70 sequential time points of the bead position) in the “force vs. time” signal as a guide to distinguish the bond association and dissociation events, since a bond formation corresponds to a decrease in the thermal fluctuation.
- Designate the interval from the instant of bond dissociation (when the thermal fluctuation resumes to normal level) to the instant of the next bond formation as waiting time, and designate the duration of the bond from its association to dissociation as bond lifetime, which are both collected during the data inspection. Calculate the average waiting time and average bond lifetime, which respectively reflect the reciprocal of on-rate and that of off-rate under zero-force16,30.
- Data analysis for force clamp assay
- Record parameters of all lifetime events including the average force and bond lifetime with the sequence number as well as the starting time and the ending time, which will allow one to draw a cumulative lifetime curve (for example, Figure 6C, yellow curve).
- Collect a sufficient amount of lifetime events under a range of forces. Group them into different force bins, which will produce an average lifetime in each force bin, and altogether yield an “average lifetime vs. force” curve (Figure 4).
- Data analysis for adhesion frequency assay
- Calcium fluorescence Imaging Data Analysis
- Adjust the intensity threshold until the fluorescence images show a clear contour of the cell in both 340 nm and 380 nm channels without background noise (Figure 5A, B). Then review the intracellular Ca2+ signal frame by frame with a pseudo-color indicating the intensity level (Figure 6B), which is derived based on the intensity ratio of 340 nm/380 nm, to generate the “normalized Ca2+ intensity vs. time” curve (Figure 6C). Use the pseudo-color fluorescence images to produce a movie that displays the fluorescence level second by second.
The BFP technique was pioneered by the Evans laboratory in 1995 17. This picoforce tool has been extensively used to measure interactions of proteins immobilized on surfaces, so as to analyze two-dimensional kinetics of adhesion molecules interacting with their ligands16,19,20,30, to measure molecular elasticity21,29, and to determine protein conformational changes21. For an fBFP, an additional set of epi-fluorescence-related devices with the corresponding software system (Table 1) is added (Figure 1A–C).
The fBFP system consists of a hardware system (optical, mechanical and electrical components) and a software system (Table 1 and Figure 1A, B). An inverted microscope (Figure 1A, middle) with optical components enabling bright-field and epi-fluorescence microscopy makes up the main body of the fBFP system, onto which the experiment stage and pipette manipulators are mounted. A fluorescence light source controller (Figure 1A, upper left corner) is used to deliver alternating excitation lights. A dual-cam system “DC2” splits the light into two and transmits them to a high-speed camera (blue) and a fluorescence camera (white) (Figure 1A, lower left corner). The former collects the probe image for position determination and the latter collects fluorescence images emitted from the target cell at two wave lengths. The experiment is monitored and controlled by two computers of which Host PC 1 (Figure 1A, upper right corner, cropped in the picture due to space limitation) is connected to both the high-speed camera and the fluorescence camera and is responsible for experiment execution and data acquisition, and Host PC 2 is connected to the monitoring camera and responsible for presenting a full view of the BFP experiment (Figure 1A, B).
During an experiment, the experimentalist uses three micropipettes to grab and manipulate cells and microspheres respectively (Figure 1E, F). A typical image of a BFP experiment consists of a force probe, which is assembled by attaching a probe bead onto the apex of an aspirated RBC, and a target cell/bead (Figure 2A). A region of interest (ROI), which contains the edge area of the bead on the RBC apex, is tracked by a fast-speed camera (2,000 fps) to monitor the deformation of the RBC in real-time. The tracked displacement of the bead then can be used to calculate the external force exerted on the force probe (see the note in Protocol section 6.6), given the spring constant of the BFP (Figure 2A, B).
Adhesion frequency assay, thermal fluctuation assay, and force clamp assay are the three commonly used experimental modes on a BFP system. By adopting any of these three modes, a BFP experiment is composed of repeated testing cycles that are performed sequentially.
In adhesion frequency assay, the target approaches and contacts the probe bead at a given contact time (for example, 1 sec) and retracts directly back to the original position and start the next cycle. An adhesion event is reflected by a tensile force signal during the retraction phase. This approach-contact-retraction cycle is repeated 50 times for at least 3 target-probe pairs to calculate a mean SEM of adhesion frequency, Pa.
Thermal fluctuation assay is used for lifetime measurements under zero-force. In each cycle, after touching the probe bead, the target is retracted to the zero-force position and clamped in contact with the bead without either compression or tension for 20 sec, and then returns to the original position to start the next cycle. Bond association/dissociation under zero-force is manifested as a sudden drop/increase in the thermal fluctuations of the bead16,30.
Force clamp assay is used for lifetime measurements under forces. A desired clamping force (for example, 20 pN) is set prior to the experiment. The target is driven repeatedly to contact the probe bead for a given contact time (for example, 1 sec) to allow the formation of a receptor/ligand bond (Figure 2C, Panels 2 and 3) and then retract (Figure 2C, Panel 4). If no bond is formed, reflected by no tensile force signal on the RBC, or if the bond ruptures before reaching the preset clamping force, the target will return to the original position and start the next cycle. In the binding events that survive the retraction phase, the target is held at the clamping force with an corresponding elongation of the RBC by d until the bond dissociates (Figure 2C, Panels 5 and 6), and then returns to the original position to start the next cycle (Figure 2C, Panel 7). Lifetime is defined as the time interval from the instant when the force reached the desired level to the instant of bond dissociation20.
For all these three BFP experimental modes, the experimentalist should be able to see the approach-impinge-contact-retract-(clamp-)(dissociate-)return testing cycle (Figure 2C), which will be repeated for multiple times16,20,21.
Data collected from each experimental mode of BFP could be analyzed in various ways to derive desired results. The average lifetime curve is one representative result from the force clamp assay (Figure 4). It reflects the reciprocal off-rates of the receptor-ligand dissociation under forces. Thermal fluctuation assay allows for the characterization of 2D on-rate and off-rate of a receptor-ligand pair under zero-force16; while adhesion frequency assay renders the 2D on-rate, off-rate and affinity under zero-force13.
The add-in of the fluorescence imaging function allows for monitoring the intracellular Ca2+ level of a single cell, which is used as the readout of cell signaling in this system. To use this function during an fBFP experiment, one needs to pre-load the cells with a Ca2+ indicator. In the case of Fura2-AM being the fluorescent dye, the fluorescence images of the same cell under 340 nm and 380 nm excitation channels were recorded alternately in the experiment and inspected pair-by-pair in the analysis. An intensity threshold was assigned to each channel’s fluorescent image to remove background noise and recognize the cell contour (Figure 5). Comparison of each pair of the fluorescence images allows the calculation of the intracellular Ca2+ level. Clear fluorescent images of the cell under both 340 nm and 380 nm excitation channels are necessary for accurate measurement of the Ca2+ level (Figure 5A, B), while poor images with non-negligible background noise will result in biased results and should be avoided (Figure 5C).
By introducing controllable mechanical stimulations onto the cell and record cell Ca2+ level simultaneously, the fBFP provides a powerful single-molecule tool to study mechano-transduction on a living cell. It is worth noting that, the platform described here is quite versatile; in principle, one can design numerous ways of applying force to the cell to suit particular purposes and concurrently monitoring various signaling events of interest. The force-dependent kinetic details are then analyzed in the context of the chosen signaling readout to extract characteristics of force-regulated receptor-ligand kinetics, the induced signaling, and their correlation. In the example of TCR signaling, an agonist-specific TCR-pMHC catch bond was first discovered and then its relevance to T-cell Ca2+ flux was investigated27. The strategy was to take the peak value of Ca2+ flux as the signaling readout to seek its best predictor among various kinetic parameters, including the number of adhesions, the force amplitude of the binding, the average lifetime, the longest lifetime and the cumulative lifetime of the sequentially formed bindings. Shown in Figure 6 is an example of simultaneously recorded individual bond lifetimes (where a clamping force of 10 pN was applied) of a T-cell and their accumulation together with the corresponding Ca2+ signal curve. In this case, four lifetime events occurred prior to the time when Ca2+ level began to elevate at 55 sec, accumulating a sum of 10-second bond lifetime. This level of lifetime accumulation triggered a Ca2+ signal with a peak of normalized Fura2 ratio of 1.8 that occurred at 65 sec. A systematic mathematical analysis of such data collected from many individual cells revealed that the best correlate of Ca2+ signaling strength is lifetimes cumulated in the 1st minute of repeated TCR-pMHC interactions (refer to Reference 27 for technical details).
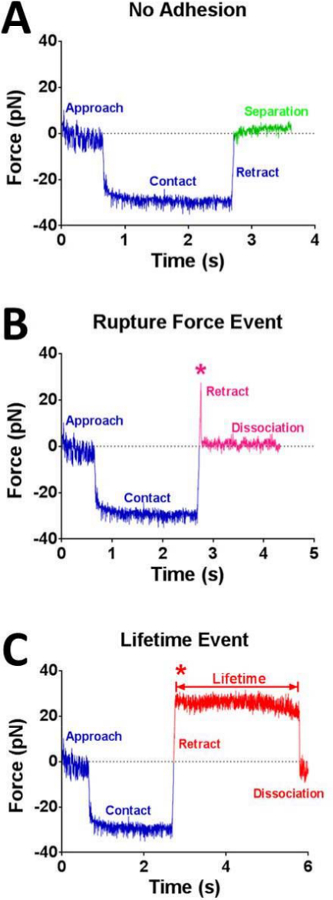
Figure 3: Exemplary time-force raw data curves of a no-adhesion event (A), a rupture force event (B) and a lifetime event (C). Various phases of the cycle and the corresponding curve segments are respectively marked in each panel. The force (y-axis) is derived from tracking the position change of the probe bead, as shown in Figure 2C. (A) No adhesion: the compressive (negative) force in the contact phase returns to zero upon retraction. (B) A rupture force event: a tensile (positive) force pulls via the receptor-ligand bond to elongate the RBC, which ruptures during the retraction phase. (C) A lifetime event: the bond persists until the clamping force is reached and dissociates thereafter. The duration of the lifetime event is indicated. The rupture force event (B) and the beginning of the lifetime event (C) are highlighted by an asterisk.
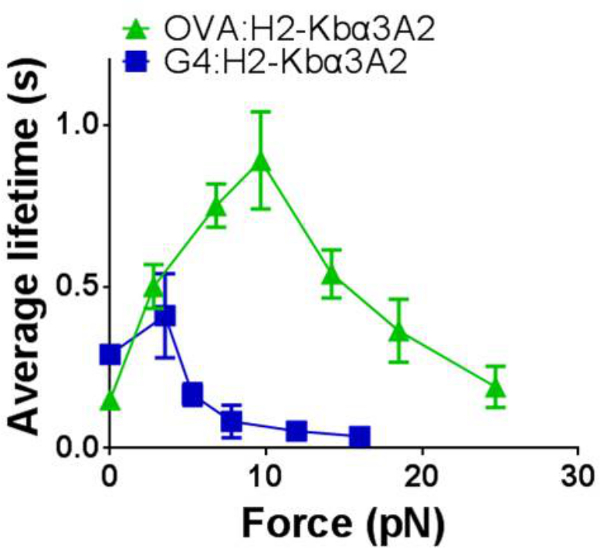
Figure 4: “Average lifetime vs. force” curve of OT1 T-cell interacting with its agonist OVA (green) and antagonist G4 (blue). The pooled data are grouped into different force bins, and the mean ± SEM of bond lifetimes is plotted versus force.
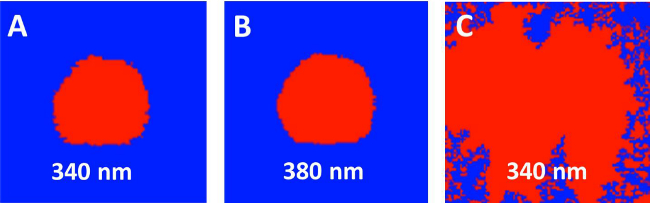
Figure 5: Representative Ca2+ images excited at two wavelengths. (A, B) Correct image recognition of a T-cell (indicated in red) in 340 nm (A) and 380 nm (B) channels based on point-to-point screening using a properly assigned intensity threshold. (C) Inability to recognize the fluorescence image of a T-cell (indicated in red) in the 340 nm excitation channel, due to poor Fura2 loading.
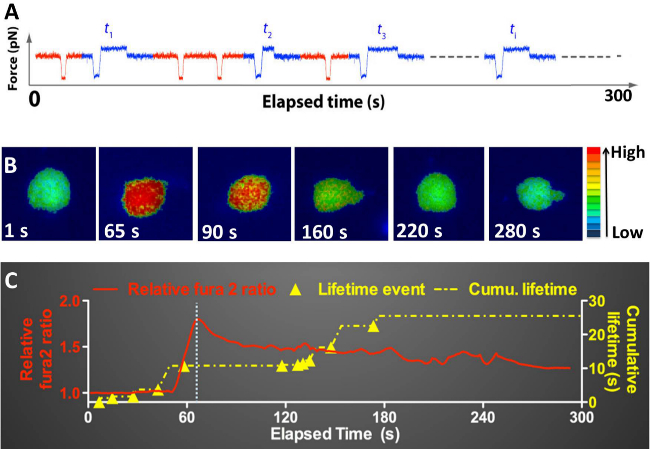
Figure 6: Superimposition of the “intracellular Ca2+ level (relative Fura2 ratio) vs. time” and the “cumulative lifetime vs. time” curves of an OT1 T-cell, generated by repeatedly touching the T-cell with an OVA-coated bead over 300 seconds. (A) A force curve showing a sequence of non-adhesion, rupture force, and lifetime events generated by repeated contacts over time. (B) Epi-fluorescence pseudo-color images of intracellular Ca2+ signals in the T-cell at different time points. The normalized Ca2+ level is indicated by the pseudo-color scale on the right. (C) Superimposition of the Ca2+ signal curve (red) and the cumulative lifetime curve (yellow) on the same time course. The Ca2+ curve was plotted based on the Ca2+ imaging. A Ca2+ flux is signified by a sharp elevation in the normalized Fura2 ratio. The time when Ca2+ reaches the peak is indicated by a dashed line. The onset time of each lifetime event is marked on the cumulative lifetime curve (solid triangle).
