Functionalized nanoparticles are becoming increasingly popular as biosensors in both medical and environmental fields. The ability to alter a nanoparticle's surface chemistry, with DNA, for example, is proving useful for targeted drug delivery systems1 and monitoring DNA-protein interactions2-4. An increasingly common nanoparticle property being utilized in bioassays and in the delivery of therapeutics is superparamagnetism5. Superparamagnetic particles (SPPs) are extremely useful in identifying and removing specific analytes from complex mixtures and can do so with the simple use of a single magnet. Once removed, the analyte-bound particles can be characterized and analyzed fit for purpose.
Previous methods used for the detection and characterization of nanoparticles include optical techniques such as dynamic light scattering (DLS), otherwise known as photon correlation spectroscopy. Although a high throughput technique, DLS is limited to being an averaging based technique and when analyzing multimodal samples without the addition of specialist software, the larger particles will produce a much more dominant signal, leaving some of the smaller particles completely unnoticed6,7. Particle-by-particle characterization techniques are therefore much more favorable to analyze nanoparticle and functionalized nanoparticle systems.
RPS based technologies are based around applying an electric field to a sample and monitoring the transportation mechanism of the particles through a synthetic or biological nanopore. A relatively recent nanoparticle detection and characterization technique based on RPS is tunable resistive pulse sensing (TRPS)8-16. TRPS is a two-electrode system separated by an elastomeric, tunable pore membrane. A tunable pore method allows for analytes of a range of shape17 and size to be measured via their transport mechanisms through the pore. Tunable pores have previously been used for the detection of small particles (70-95 nm diameter) producing comparable results to other techniques such as transmission electron spectroscopy (TEM)10. When an electric field is applied, an ionic current is observed and as particles/molecules pass through the pore, they temporarily block the pore, causing a reduction in the current that can be defined as a 'blockade event'. Each blockade event is representative of a single particle so that each particle within a sample can be characterized individually based on the blockade magnitude, Δ , and full width half-maximum, FWHM, as well as other blockade properties. Analyzing individual particles as they pass through a nanopore is advantageous for multimodal samples as TRPS can successfully and effectively distinguish a range of particle sizes amongst a single sample. Tunable resistive pulse sensing completes size10, zeta potential12,18 and concentration15 measurements simultaneously in a single run and can therefore still differentiate samples of similar, if not the same size by their surface charge19; an advantage over alternative sizing techniques.
Zeta potential is defined as the electrostatic potential at the plane of shear20, and is calculated from particle velocities as they traverse a pore19. Zeta potential measurements of individual particles thus gives insight into the translocation mechanisms and behavior of nanoparticle systems in solution, valuable information for the future of nanoparticle assay designs for a range of applications. Particle-by-particle analysis of such nature also allows for the spread and distribution of zeta potential values amongst a sample population to be explored, allowing for more information on reaction kinetics (single-stranded to double-stranded DNA, for example) and particle stabilities in solution to be attained.
Here, we describe a technique that detects and characterizes both unmodified and DNA-modified SPP surfaces. The protocol described herein is applicable to a range of inorganic and biological nanoparticles, but we demonstrate the procedure using DNA-modified surfaces due to their wide range of applications. The technique allows the user to distinguish between single-stranded and double-stranded DNA targets on a nanoparticle surface, based on particle translocation velocities through a pore system and thus their zeta potentials.
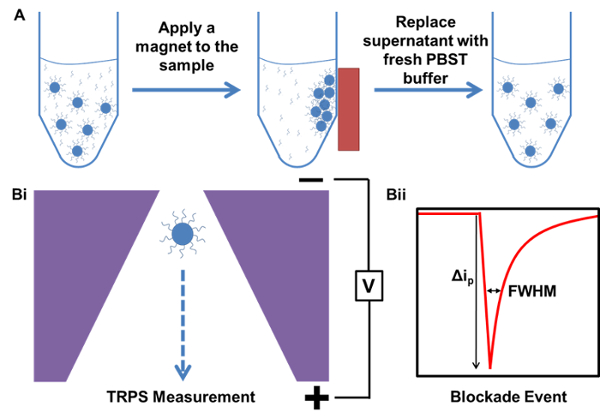
Figure 1. Schematic representation of the processes of magnetic purification and a TRPS measurement. A) Example of magnetic purification of sample starting with a sample containing excess, unbound capture probe DNA. B) TRPS measurement example i) Particle passing through the nanopore and ii) Blockade event produced from particle temporarily occluding ions in the pore causing a temporary decrease in current; Information from which is used to calculate particle translocation velocities. Please click here to view a larger version of this figure.
The removal of any excess DNA that has not bound to the particles surface from the samples is important prior to TRPS analysis, as to not report any 'false-positive' results. The ability to use a magnet to extract and wash the SPPs is a huge benefit for TRPS (Figure 1A). Figure 1B describes a basic example of a TRPS measurement and an example 'blockade event' achieved as a particle traverses the pore. Firstly, we have demonstrated that TRPS is a high throughput technique that can distinguish between samples of a similar size but of a considerably different charge. Its ability to complete both size and charge analysis simultaneously in a single measurement can be seen in Figure 2. Figure 2 is an example of a) size and b) zeta potential analysis of streptavidin coated particles with no modifications (light pink data set) and streptavidin coated particles saturated with single-stranded DNA on the surface (blue data set). Although both samples were of a similar size, the zeta potential was significantly different and much larger when DNA was functionalized onto the particle's surface.
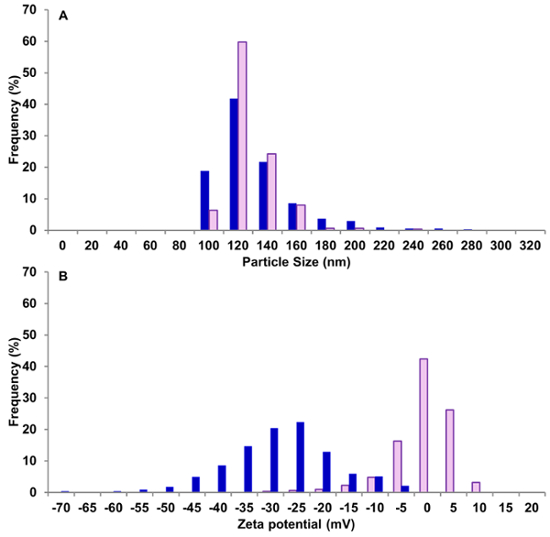
Figure 2. Size and Zeta potential analysis of DNA-modified and unmodified streptavidin coated nanoparticles. The light pink bars represent unmodified streptavidin coated particles and the blue bars represent DNA-modified particles. A) Frequency (%) vs particle diameter (nm). B) Frequency (%) vs zeta potential (mV). Figure adapted from supplementary data in Blundell et al.19. Please click here to view a larger version of this figure.
Not only can the technique differentiate between particles unmodified and modified with DNA, TRPS can also differentiate between samples with different concentrations of DNA hybridized to the particle surface. Figure 3 shows the size and zeta potential data exhibited for samples with the lowest (10 nM, light green data set) and highest (210 nM, blue data set) concentrations of DNA hybridized to the streptavidin coated particles. A larger zeta potential value is recorded for particles hybridized with a higher concentration of DNA.
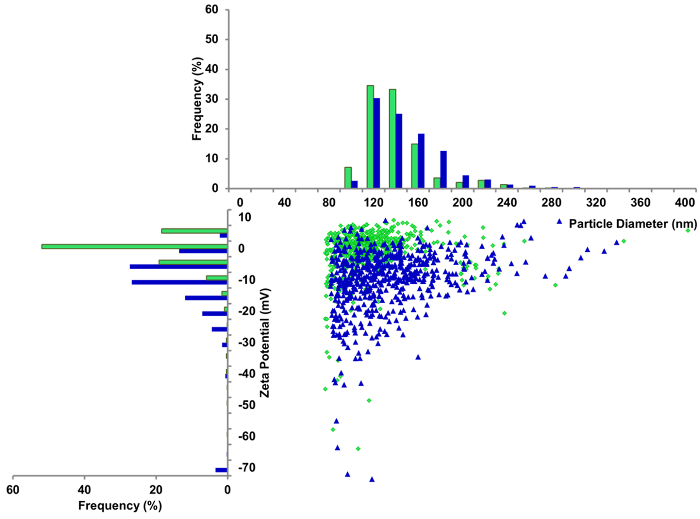
Figure 3. Simultaneous size and zeta potential data captured from a single TRPS measurement. The blue bars/data points are representative of streptavidin coated particles hybridized with 210 nM CP DNA and the light green bars/data points represent streptavidin coated particles hybridized with 10 nM CP DNA. Figure adapted from Blundell et al.19. Please click here to view a larger version of this figure.
It is useful to note that each data point in the scatter plot represents a single particle amongst a sample population, allowing for in depth particle-by-particle analysis with every sample. Figure 4 supports the technique's effectiveness in determining minor changes in DNA structure (single-stranded and double-stranded DNA), as well as identifying differences in samples with target DNA of the same size, but bound to a different area of the capture probe demonstrating high levels of sensitivity (i.e., Middle binding and End binding targets shown in Figure 4). The particles shown in Figure 4 are those with the following surface modifications, from left to right; capture probe (CP) DNA only, CP and a fully complementary DNA target, CP and a middle binding DNA target, CP and an end binding DNA target, CP and an overhanging DNA target.
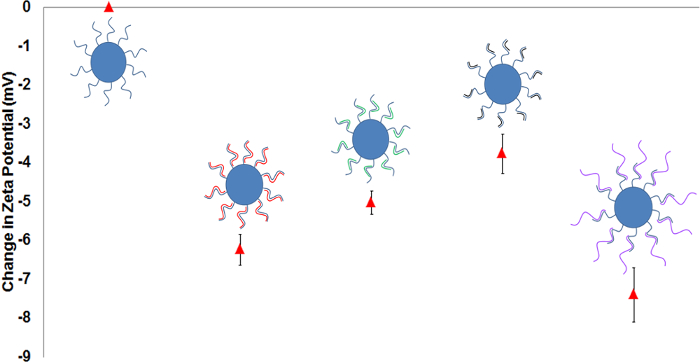
Figure 4. Relative change in zeta potential measured for DNA-modified particles with a range of DNA targets. Change in zeta potential, mV, from i) CP functionalized particle to a range of DNA targets; ii) Fully complementary, iii) Middle binding, iv) End binding, v) Overhanging target. The error bars represent standard deviation where n=3. Figure adapted from Blundell et al.19. Please click here to view a larger version of this figure.
The calculation for the zeta potential used a calibration based method related to work by Arjmandi et al.21. The duration of the translocation of particles as they traverse a nanopore is measured as a function of applied voltage, using an average electric field and particle velocities over the entirety of a regular conical pore. The electrophoretic mobility is the derivative of 1/T (where T is the blockade duration) with respect to voltage, multiplied by the square of the sensing zone length, l. Average velocities at multiple reference points through the sensing zone are measured to allow for minimal errors in calculating zeta potential using this method.
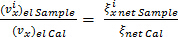
The calibration of the pore is based on the linearity of 1/T vs voltage, V, at each reference point in the sensing zone. The electrokinetic particle velocities of calibration and sample particles,  and
and  respectively, are related to their zeta potentials,
  and
and  , as shown in equation 1, assuming a linear relationship between the two as given in the Smoluchowski approximation12,20. The net zeta potential values for both calibration and sample are the differences in particle zeta potential and the membrane zeta potential,
  . The zeta potential of the polyurethane pore was measured using streaming potential techniques12,18 as -11 mV in PBS for this study.
 (1)
(1)
The zeta potential of each individual particle, i,  , is measured from the respective zeta potentials calculated at various reference points within the pore (equation 2), where
  is the position of the particle within the pore after time, t=Tx, and
  is the particle velocity of single sample particle i at relative positions lx;
  ,
,  , P, and V are electrokinetic velocity per unit voltage, convective velocity per unit pressure, applied pressure and voltage for the sample runs respectively, a full derivation of this equation can be found in work by Blundell et al.19.
 (2)
(2)
When binding the capture probe DNA to the streptavidin coated nanoparticles, it is vital that the researcher removes excess, unbound capture probe DNA left in solution. This is done easily using the SPPs and a simple magnet allowing the rapid and easy replacement of the supernatant with new PBST buffer. If excess capture DNA is left in solution and target DNA added, the target DNA may bind to the free capture DNA in solution, rather than that on the SPP surface. A change in particle velocity and zeta potential will only be observed if the target DNA binds to the capture probe present on the particle's surface.
Analysis and comparison of a large number of samples across many days using TRPS may require the use of more than one pore membrane. Some pores can have some minor differences in their size due to the manufacturing process and in these cases, the user must ensure the baseline current remains identical across all runs. If the same baseline current is observed, the results obtained are comparable between pores. Once the baseline is the same as previous runs, it is imperative that the user keeps the stretch unchanged between calibration and sample runs to allow for accurate determination of particle translocation velocities as they traverse the pore.
The TRPS technology has a relatively simple set up, which can be disassembled easily and quickly during an experiment. If troubleshooting problems, this can make the process a lot easier. For example, it is important not to allow any bubbles in the lower fluid cell or upper fluid cell when undertaking analysis. This will lead to an unstable baseline current. If bubbles are present in the upper fluid cell, the sample may be removed and replaced. If bubbles appear in the lower fluid cell, the buffer should be removed and replaced with fresh buffer. If the bubbles are a persistent problem, then there may be too much surfactant in the solution so this may have to be reduced16 (we only use 0.05% Tween-20). Some samples may block the pore if their size exceeds the pore size or if the concentration of the sample is too high. To rectify this, the pore size can be increased by increasing the stretch or the sample can be diluted to a lower particle concentration16. For single particle analysis, the sample may also block the pore if there are a lot of large aggregates present, it is important to vortex and sonicate the sample before running it through TRPS.
Amongst other methods, TRPS has various advantages including the ability to complete size and charge measurements of individual particles simultaneously; allowing for multimodal samples to be analyzed effectively using this method. One advantage is the signal/blockades produced can be optimized in minutes for a particular sample by simply changing the stretch and voltage to obtain a blockade magnitude, Δ, significantly larger than the background noise (blockades are of nA scale in comparison to the background noise <10 pA). Being able to alter the stretch of the pore makes the method more versatile over solid-state pore techniques as the pore size can be adjusted with respect to the size of the analyte in question; particularly useful when investigating effects such as aggregation and DNA-protein binding that may result in analyte sizes exceeding the original solid-state pore size range. Another advantageous aspect of TRPS is the level of sensitivity from the technique. The ability to detect subtle differences in DNA binding (where the same amount of DNA has been added (same amount of added charge) and the samples are of the same size) based on the position of target DNA binding is quite profound in this area of analysis and will be of great use for future nanoparticle-assay design platforms. Each subtle difference can be detected and isolated using a particle-by-particle nature of TRPS technology. This analysis exceeds that of ensemble techniques such as dynamic light scattering or photon correlation spectroscopy that will merely gage an average of the sample population analyzed and can't differentiate in the cases of multimodal samples6,7.
Small solid-state nanopores (100-200 nm) have also been used to monitor particle dynamics and have found that particle mobility can be affected as the diameter of the particle begins to approach that of the nanopore22,23. Nanopores much larger than the particles being analyzed (as used in this study) have less of an effect on the particle mobility and thus the translocation dynamics within the pore. The pores used in this study are however limited to their analyte size ranges, an NP150 for example has a size range of 60-480 nm so if a multimodal sample consisted of particles within and exceeding this limit, they cannot be analyzed on the same pore as the pore may then become blocked. It is also important to note that measuring a bimodal sample containing 60 and 480 nm particles (those at the absolute lower and higher limits of the pore), for example, will require different stretch and voltage conditions, although both are within the size analysis range of the pore. This is because the stretch required for the larger particles will result in the smaller particles having a particularly small blockade magnitude (based on the reduced resistance) that could be regarded as background noise and thus not necessarily measured during a sample run.
Bubbles can be a problem with the sample measurements as bubbles in the lower or upper fluid cell will create an unstable baseline current, to which sample runs cannot be completed. Electrolytes of an effervescent nature (some highly concentrated biological media, for example) may be difficult to run and thus samples requiring suspension in these specific mediums may prove problematic. Most samples however, can be vastly diluted or suspended into alternative buffers prior to TRPS analysis.
The method is adaptable and can be used to analyze a range of nanoparticle-based analytes, including the analysis of proteins, DNA, small molecules, aggregation assays17,24 and biologically relevant particles. The versatility of TRPS in characterizing a vast range of analytes shows the techniques potential in a range of areas such as drug delivery1,25, biosensing26-28, and environmental testing.
