Characterization of Calcification Events Using Live Optical and Electron Microscopy Techniques in a Marine Tubeworm
Summary
We demonstrate the use of various microscopy methods that are useful in observing the calcification of a tubeworm, Hydroides elegans, as well as locating and characterizing the first calcified material. Live microscopy and electron microscopy are used together to provide functional and material information that are important in studying biomineralization.
Abstract
Characterizing the first event of biological production of calcium carbonate requires a combination of microscopy approaches. First, intracellular pH distribution and calcium ions can be observed using live microscopy over time. This allows identification of the life stage and the tissue with the feature of interest for further electron microscopy studies. Life stage and tissues of interest are typically higher in pH and Ca signals.
Here, using H. elegans, we present a protocol to characterize the presence of calcium carbonate structures in a biological specimen on the scanning electron microscope (SEM), using energy-dispersive X-ray spectroscopy (EDS) to visualize elemental composition, using electron backscatter diffraction (EBSD) to determine the presence of crystalline structures, and using transmission electron microscopy (TEM) to analyze the composition and structure of the material. In this protocol, a focused ion beam (FIB) is used to isolate samples with dimension suitable for TEM analysis. As FIB is a site specific technique, we demonstrate how information from the previous techniques can be used to identify the region of interest, where Ca signals are highest.
Introduction
Biomineralization is a complex series of events, which bridges a suite of cellular activities resulting in the production of exquisitely ordered minerals1. The challenge is to characterize both the dynamic cellular process and the sophisticated mineral structures using a combination of optical and electron microscopy methods. An elevation of intracellular pH favors the formation of CaCO3 crystals, hence, identifying the life stage that has an increased pH reveals the time when calcification is likely to be occurring2,3.
The tubeworms from the family Serpulidae are common calcifiers in the ocean4. It is also a popular invertebrate model for marine research, especially in biofouling5,6. In this study, the process of calcification in mineralizing compartments during biomineralization is observed. The rapid process of metamorphosis includes the emergence of calcium carbonate structures7,8.
We demonstrate how internal pH measurements can be performed on the tubeworm, and how life stages and tissues relevant for calcification can be screened. After the life stage of interest is identified, the tissue responsible for calcification can be characterized at a higher resolution using electron microscopy methods. Using fluorescent microscopy, we determine the time required for calcium carbonate to appear after metamorphic induction. A similar stage of life was subsequently visualized with SEM-EDS for elemental composition distribution, and the deposited mineral was analyzed using two different electron microscopy methods, specifically SEM-EBSD and FIB-TEM.
Protocol
1. Screening for Life Stage and Tissue of Interest with Live Imaging
- Culture the marine larvae to competency according to previously reported methods6,7,9. Incubate the tubeworm larvae at 5 larvae per mL density with filtered seawater with 10 µM SNARF-1 AM overnight. Cover the container with aluminum foil to protect the fluorescent probe from photo-bleaching.
- Observe the larvae using a dissection microscope. Competent tubeworm larvae ready for metamorphosis will swim in a forward direction instead of a circular motion.
- Transfer the competent larvae to a 60 µm mesh. Press the mesh against a Petri dish, providing a good seal to retain liquid. Quickly release the seal to release and discard the seawater containing fluorescent dye, retaining the larvae.
- Wash the larvae with filtered artificial seawater (FASW) twice, taking care not to dry out the larvae in the process.
- Place 10 to 20 larvae in thin glass bottom dishes with 5 mL of FASW containing 10-4 M isobutylmethylxanthine (IBMX) for observation of metamorphosis process.
- Insert the filter cubes to detect SNARF-1 signal (Channel 1: Ex 510/25 Em 580/30; Channel 2: Ex 510/25 Em 640/35), and DIC image of the larvae.
- Position the metamorphosing larvae under the 20X objective, then, optimize shutter time (100-300 ms) fast enough to ensure that a clear image of the live animals is captured.
- Set 1 µm distance to capture a Z-stack of all three channels, when imaging a living animal, imaging each layer for all three channels before moving on to the next layer of the z-direction would enable a better correlation between channels.
- Export grey scale images for all channels and layers as TIF files from the microscope software: File | Export | File type TIF | Start.
- Using ImageJ, import the image sequence for each channel: File | Import | Image sequence.
- To import Channel 1 λ1em, enter starting image 3 and increment: 4.
- To import Channel 2 λ2em, enter starting image 4 and increment: 4.
- Generate a composite image by dividing λ2em by λ1em for each layer pixel by pixel (Process | Image Calculator… | Image file 640 nm "divide" image file 580 nm), i.e. 640/580 nm ratio.
- Select Image | Lookup Tables | 16 Colors.
- Select Analyze | Tools | Calibration bar.
- Inspect the different layers, identifying the layer containing the most heterogeneity. This provides the most useful information regarding internal pH distribution.
- Using the relationship between 640/580 nm ratio and pH, construct a plot profile to visualize the distribution of internal pH.
2. Calibration of Internal pH
- After overnight staining of about 20 larvae with 10 µM SNARF-1 AM, add in stock solutions of nigericin and KCl to make up 50 µM nigericin and 150 mM KCl for calibration.
- Adjust the pH of calibration AFSW with dilute NaOH or HCl, until a pH around 5.9 is achieved. Note the exact pH value. Measure pH with a pH meter with a glass electrode that has been calibrated by seawater based 2-amino-2-hydroxymethyl-1,3-propanediol (Tris) and 2-aminopyridine9.
- Transfer one stained tubeworm larvae together with a liquid with a known pH to a dry and clean dish for measurement of signals intensity at 640 nm and 580 nm.
- Repeat steps 2.2 and 2.3 for four more pH points ranging from 5.9 to 9.9. They represent a range of physiologically relevant values.
- Check to ensure the signals appear homogenous throughout the animal body. This indicates that the intracellular pH has been equilibrated with the environmental seawater.
- Image the tubeworm larvae at the five different seawater pH environments, record the intensities shown as "grey values" at 640 nm and at 580 nm, i.e., λ2exc and λ1exc.
3. Analysis of Ratiometric Imaging Data
- Enter the grey values as measured from five random locations or from an area of interest on a spread sheet.
- Check to see the five points calibration showed a linear relationship to indicate intracellular pH (e.g., equation like y = 0.30x – 1.47; y = grey value; x = pH; R² = 0.934).
- Calculate the intracellular pH values from the equation using the measured 640/580 nm intensity ratio at step 1.13.
4. Sample Preservation, Dehydration and Mounting for electron Microscopy
- Preserve the life stage of interest with 4% paraformaldehyde. In this study, fix the tubeworms 2-4 days after attachment, keep the animals in fixative until analysis.
- Working in a fume hood, post-fix the specimen with 1% osmium tetroxide aqueous solution for 30 min to minimize tissue shrinkage during dehydration process.
- Dehydrate the specimen with a graded ethanol series: 50% ethanol for 5 min, 70% ethanol for 5 min, 85% ethanol for 5 min, 95% ethanol for 5 min, and finally absolute ethanol for 5 min twice.
- Working in a fume hood, add a 1:1 solution of ethanol and hexamethyldisilazane (HMDS) to the specimen, allowing the liquid to evaporate completely.
- In the fume hood, add 100% HMDS to the specimen, allowing the liquid to evaporate completely.
- Using a diamond knife, introduce a few cuts to the culture dish, surrounding a few tubeworms. With the lid on, hold the dish bottom against an aluminum stub to break the dish.
- Under a dissection microscope, find a fractured piece containing an intact tubeworm.
- Apply silver paint to an aluminum stub and secure the fragment to the stub carefully. Paint around the edges of the plastic fragment to reduce charging.
5. Locating a Calcium Rich Region Using SEM-EDS
- Secure the specimen stub onto the sample holder.
- Measure the height of the entire assembly against the gauge provided with the microscope, adjusting the height by loosening the locking washer and rotating the post until the specimen is at standard height, or enter the height as recorded.
- Admit air into the microscope exchange chamber and swing the chamber door open. Slide the sample holder onto the end of the exchange rod. Then close and evacuate the chamber.
- Open the gate valve and slide the exchange rod in towards the microscope chamber. Slide the exchange rod all the way in to fully seat the sample holder into the microscope stage. Remove the exchange rod and close the gate valve.
- Input the sample dimensions and send the stage to the Home position to place the sample underneath the electron column.
- Set the chamber vacuum level to 20-30 Pa in the VP-SEM mode. Set the electron accelerating voltage to 20 kV and turn the high voltage on.
- Raise the stage to a sample working distance of 10 mm. Acquire a live feed and locate the specimen. Optimize the image adjusting the astigmatism and focus as necessary.
- Open the SEM-EDS program and select the EDS-SEM mode option. Select the menu option to run an EDS map.
- Change condenser lens and aperture settings to achieve a dead time of ~30% at a process time of 3 as monitored through the rate meter in the SEM-EDS program. Run beam and aperture alignment procedures after making any changes to beam settings.
- Select a magnification such that a single organism fills the entire field of view. Enable the drift correction option and capture an image in the SEM-EDS program.
- Acquire map data with the organism filling up the entire field of view, using a dwell time of 50-100 ms. Run the map until the data shows distinct localization of Ca within the organism (approximately 15 min).
- To obtain point-quantification data, change the process time to 6 and adjust the electron probe to acquire a dead time of ~30%. Run alignment steps and optimize the image as necessary.
- Select the Point and ID option in the SEM-EDS program and acquire another image. Using the single point tool, click on areas that appeared Ca rich in the EDS map, as well as Ca deficient areas for comparison. Scan each point for a live time of 30 s.
6. Identifying Crystallographic Information of Calcium Rich Regions Using SEM-EBSD
- Remove plastic fragment containing specimen of interest from flat specimen stub and affix to the sloped face of a 45° pre-tilted stub using silver conductive adhesive.
- Screw the stub onto the sample holder and position the angled face of the stub (with specimen) towards the front of the sample holder. Insert the sample holder into the chamber of the microscope using the exchange chamber.
- Set the chamber vacuum to 30 Pa and electron accelerating voltage to 20 kV. Send the sample underneath the electron column and tilt the stage 25° to place the sample surface approximately 70° from normal to the electron beam. Turn the high voltage on.
- Raise the stage to a working distance of ~18 mm. Use the trackball to move the stage and locate a specimen. Increase the magnification to frame specific features of interest. Align the beam and optimize the image as necessary.
- Open the SEM-EDS program in the EBSD mode. Select calcite and aragonite as phases of interest. Insert the EBSD camera at a distance of 154 mm. Set camera conditions to 1 x 1 binning and a 100 ms frame time. Using a fast beam raster, acquire a background.
NOTE: A different frame rate may be required depending on the electron probe; adjust the probe or camera frame rate to achieve a signal of about 90%. - Capture an image in the SEM-EDS program. Use the spot analysis tool and click somewhere on the image to scan the beam on that point. Observe the camera window to see if any Kikuchi patterns are detected.
- Click on different areas of the image to scan potential calcification sites, observing the camera window at each point to see if Kikuchi bands are present. If patterns are present and match any of the selected phases in the database, they will automatically be indexed.
7. TEM Sample Preparation Using FIB-SEM
- Sputter coat the prepared SEM specimen with platinum or similar material to create a conductive layer.
- Place the previously fixed, dehydrated, and mounted specimens into the housing of the sputter coater and turn the power on to begin pumping the chamber down.
- Once the chamber vacuum reads 40 mTorr or less, turn the gas switch on and increase the argon gas flow to reach a chamber pressure of 200 mTorr. Adjust the gas flow to achieve a final chamber pressure of 80 mTorr.
- Turn the voltage switch on and increase the voltage to reach a current of 15 mA. Set the timer and coat for an extended time (~10 min) to create a thick layer (~60 nm) that protects the specimen surface from ion irradiation damage. Regulate the voltage to maintain a stable 15 mA current.
- Once finished, power down the coater to release the vacuum and remove the sample.
- Screw the base of the prepared, sputter coated sample onto the M4 screw post of the instrument sample holder. Tighten until hand tight, loosen the locking nut, and then rotate the sample holder post to change the height of the assembly. Use the laser height gauge and adjust the height to be within 1 mm (= 0.04 inches as displayed in video) of the standard supplied with the instrument.
- Close all gun valves in the FIB-SEM, and then admit air into the eucentric stage airlock. Once the pressure has equalized with the environment, slide the air lock open and affix the sample holder onto the prongs of the exchange rod. Turn the knob on the end of the exchange rod to the "lock" position. Close the air lock and evacuate the air lock chamber.
- Once the eucentric stage air lock has been evacuated and the pressure matches that of the FIB-SEM chamber, open the gate valve and insert the sample by pushing in the exchange rod. Slide the exchange rod all the way in to seat the sample holder in the instrument eucentric stage, then rotate the exchange rod to the "unlock" position. Slide the exchange rod back out and close the gate valve.
- Move the stage to position the sample under the ion beam column. Open the gate valves and acquire a live ion-induced secondary electron image of the FIB. Use low magnification and a fast raster scan to minimize ion damage. Reset the focus of the normal observation beam and raise the Z height of the stage until the sample is in focus. At this point the sample is at the cross-point position where both the ion and electron beams are focused at the same location.
- Using the secondary electron image from the SEM, locate the area of interest in the specimen, using the trackball to move the specimen around. Areas of interest are Ca rich areas as previously determined by EDS mapping. Rotate the stage as necessary to get the features of interest in line with the frame of the window.
- On the FIB window interface, capture a quick snapshot of the specimen at a magnification of 1,000X with an additional 2X digital zoom and draw a ~8 µm x 2 µm deposition template over the area of interest. The magnification size of the deposition box may be adjusted to accommodate features of different sizes. Set the sputter conditions to deposit carbon using a 40 kV, 0.09 nA beam, using a dwell time of 0.5 µs for 5 min.
- After deposition of carbon, modify the deposition conditions to deposit tungsten using a 40 kV, 0.7 nA beam, and deposit for 5 min to generate a ~2-3 µm tungsten cap.
- Capture a FIB snapshot using the observation beam and use the microsampling sputter tool to draw a pattern of four boxes around the tungsten cap. Set the upper and lower boxes to be about 15 µm x 8 µm; the right box 10 µm x 5 µm, and the left box 6 µm x 5 µm, or large enough to surround the area of interest.
- Modify the fabrication conditions to cut using a 40 kV, 19 nA beam, and a dwell time of 50 µs, and 3-4 scan frames for each box. Then fabricate the pattern. After fabrication, the area of interest, with protective C and W layers, will resemble an island, with all adjacent material removed on the top, bottom, and right sides.
- Tilt the stage 58° to put the sample surface normal to the electron column and at a steep angle to the ion column. Locate the backside of the sample "island" using the FIB and capture a snapshot at 1,000X magnification and 2-4X digital zoom.
- Draw a ~15 µm x 2 µm sputter pattern over the bottom of the backside of the sample "island," at the very end of where it is visible. Fabricate the box using a 4 nA beam for 3 min, or until the beam has cut through the bottom of the sample "island."
- Tilt the eucentric stage -58° from the current position (back to zero). Insert the tungsten microsampling probe by clicking "Probe In" in the FIB interface. Select "MS" on the stage control panel and use the trackball to move the probe over top of the specimen.
- Acquire a live feed from the FIB at a magnification of 1 kx and position the probe such that the tip is directly above the right side of the tungsten cap of the microsample. While observing a live SE image from the SEM, use the Z control knob of the stage panel to lower the probe until it contacts the tungsten cap. A buzzer will sound once contact has been made.
- Capture a snapshot using the FIB using a 40 kV, 0.01 nA beam, at a magnification of 1,000X and 2X digital zoom. Use the deposition tool to draw a 2 µm x 2 µm box over the tip of the probe where it has contacted the tungsten cap of the microsample.
- Set the conditions to deposit tungsten using a 40 kV, 0.09 nA beam, for 2 min and a dwell time of 0.5 µs. Then fabricate the pattern.
- Draw a ~2 µm x 5 µm sputter pattern over the left end of the microsample "arm" (where it is still connected to the bulk of the sample). Fabricate the pattern using a 40 kV, 0.7 nA beam, for 2 min, or until the beep indicates that the microsample has been detached from the bulk sample.
- Use the Z control knob to raise the probe with attached microsample until it clears the bulk sample, then retract the probe. Send the eucentric stage to either the Home or Exchange position.
- Place a copper half-grid into a side entry holder and load the holder into the side entry stage purge chamber. Evacuate the chamber and insert the side entry holder. Set the holder to the FIB position.
- Press Side on the stage control panel and use the trackball to bring the half-grid into view on the FIB monitor. Move to clean area of the half grid and use the Z knob to bring the surface into focus.
- Press Probe In to insert the probe, press MS on the stage control panel, and use the trackball and Z knob to position the microsample over the half grid. Lower the probe until the microsample contacts the grid.
- Capture an image on the FIB at 1,000X magnification (2X zoom). Use the deposition tool and draw a ~10 µm x 3 µm pattern over the lower side of the microsample. Deposit tungsten with a 40 kV, 0.7 nA beam, using a dwell time of 0.5 µs for 3 min.
- Use the sputter tool and draw a small 1 µm x 3 µm pattern over the tip of the probe. Fabricate the pattern using a 40 kV, 0.7 nA beam at a dwell time of 3 ms to cut the probe away from the microsample. Retract the probe once free.
- Capture a FIB image at 5,000X magnification and draw two sputter patterns 7 µm x 4 µm at the top and bottom of the microsample, leaving a ~1 µm gap between the boxes. Center the patterns so as to not cut the left and right sides of the microsample. Fabricate both patterns using a 40 kV, 4 nA beam, and a dwell time of 3 µs, for 2 min, setting the raster direction towards the center of the microsample.
- Capture another image using the FIB observation beam at 5,000X. Resize the previous sputter boxes to ~6.5 µm x 1 µm, move closer together to leave a gap of ~0.5 µm, and fabricate using a 40 kV, 0.7 nA beam.
- Tilt the side entry stage 0.5° and capture another FIB image. Resize the sputter boxes to 6 µm wide. Position the top pattern over the top side of the microsample and fabricate using a 40 kV, 0.7 nA beam. Tilt -0.5° and repeat with the lower sputter pattern and bottom side of the microsample.
- Further decrease the pattern width by ~0.5 µm. Tilt 0.5° and sputter the top side of the microsample using a 40 kV, 0.09 nA beam. Repeat with the bottom side at -0.5° tilt.
- Tilt the stage 2.2° and acquire a FIB image at 10,000X. Resize sputter patterns to 5 µm wide and change beam conditions to 5 kV, 0.03 nA. Position the upper pattern over the upper side of the microsample, right up the top edge, and fabricate. Tilt -2.2° and repeat with the lower side and bottom pattern.
- Repeat 5 kV milling steps until the microsample becomes electron transparent (~100 nm thickness). Once finished, close gunvalves and remove side entry holder.
8. Obtaining Selected Area Diffraction Pattern on a TEM
- To prepare the instrument for analysis, fill both Dewar flasks with liquid nitrogen and set the accelerating voltage to 300 kV.
- After sample preparation using the FIB, remove the side entry holder from the FIB-SEM and adjust the pin position such that the holder length matches that of the 300 kV TEM. Rotate the tip of the holder to the correct observation position, once again comparing it to the standard TEM holder to ensure correct sample orientation.
- Alternatively, remove the half-grid with attached lamellae from the FIB-SEM holder and place in the standard TEM holder.
- Load the sample holder into the exchange chamber of the TEM and evacuate the chamber. Ensure that the instrument gun valve is closed whenever air is admitted into the exchange chamber. Once the exchange chamber has pumped down, an audible alarm will sound. Rotate the sample holder clockwise and allow the vacuum to pull the sample holder in to the first stop position.
- Allow the instrument vacuum to recover, and then open the gun valve. Reset the focus and zoom to a magnification of about 10,000X.
- Use the alignment knobs to shift the beam to the center of the phosphor screen. Contract and expand the beam and ensure that all beam movement is concentric. Adjust for condenser stigmatism as necessary.
- Rotate the sample holder counterclockwise and allow the vacuum to pull the holder fully into the column. Use the stage movement knobs to navigate and locate the sample.
- Increase magnification on the sample and adjust the Z-height until the sample is in focus. Use the optical eyepieces as necessary.
- Insert the camera and remove the phosphor screen. Expand the beam as necessary to avoid oversaturating the camera. Adjust focus and camera parameters, then start acquisition to capture an image.
- To acquire a diffraction pattern, first center the feature of interest. Remove the objective aperture and insert the diffraction aperture.
- Change to the diffraction lens mode by pressing the DIFF button on the control panel and use the DIFF control knob to shrink the beam.
- Insert the blanker as necessary to prevent the center of the diffraction pattern from burning the camera or phosphor screen. Start acquisition of the camera to capture an image of the pattern.
Representative Results
The following are some observations of the calcification process during the metamorphosis of the tubeworm. Figure 1 shows that the pH values near the collar region is higher than the other tissues after metamorphosis. Figure 2i shows a tubeworm with homogeneous distribution of Ca, suggesting no major calcification events have begun; Figure 2ii shows a tubeworm that has calcified for a longer period, suggesting calcification has gone beyond the time point of interest; Figure 2iii shows a tubeworm with the calcification stage of interest, which was selected for further analysis to understand the tissue responsible for mineralization. Figure 3 shows the higher pH values are correlated with the higher Ca ion signals from both calcein staining and SEM-EDX mapping. From these observations, the tissue from the life stage of interest was examined at a higher resolution using a more localized technique, SEM-EBSD. Upon the discovery of the mineral phase, Figure 4 shows the application of focused ion beam to lift out the material of interest for TEM and selected area diffraction analysis to confirm the crystallinity of the mineral.
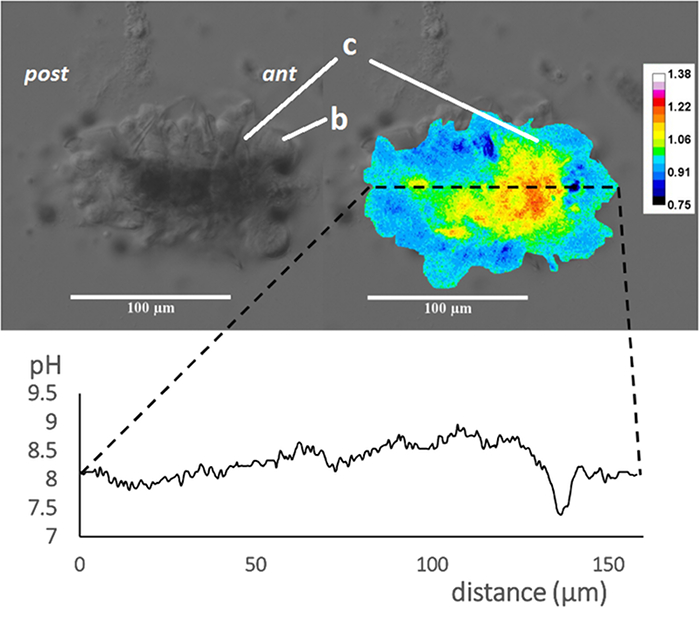
Figure 1: Intracellular pH mapping of the tubeworm (from Chan et al. 2015). At 71 h after IBMX treatment, a tubeworm, Hydroides elegans, which represents a slower rate of metamorphosis demonstrates a great heterogeneity in the intracellular pH distribution. DIC image (top left) and pseudocolorized composite images generated from the grey values at 640 nm divided by grey values at 580 nm (top right) are shown. The calculated grey values from the 640/580 nm ratio is proportional to the intracellular pH. The profiles of the grey values from the composite images, were converted into intracellular pH values over the distance along the longitudinal body axis of the tubeworm (bottom panel). The relationship between intracellular pH and 640/580 nm ratio in emission was established by in vitro calibration (y = 0.30x – 1.47; R2 = 0.934; y, grey value; x, intracellular pH). Regions with intracellular pH above pH 8.5 (in red) are corresponding to the regions where calcified structures were found. Scale bars = 100 µm; c, collar; b, branchial lobes; ant, anteior; post, posterior. Please click here to view a larger version of this figure.
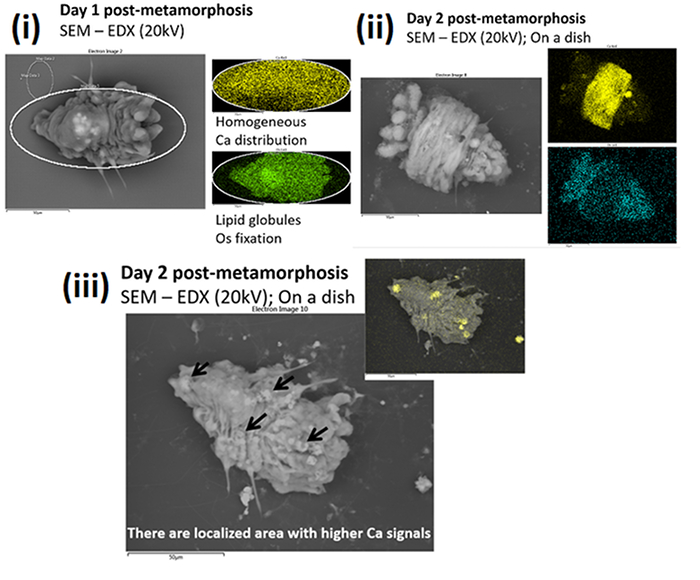
Figure 2: Identifying the life stage of interest using SEM-EDS.
Tubeworms at different time point of metamorphosis were screened to capture the newly calcifying stage for further analysis (i) A day 1 post-metamorphic tubeworm shows homogeneous distribution of Ca signal (ii) A faster growing day 2 post-metamorphic tubeworm shows a short ring of Ca signal (iii) A slower growing day 2 post metamorphic tubeworm shows spots of Ca signal. Please click here to view a larger version of this figure.
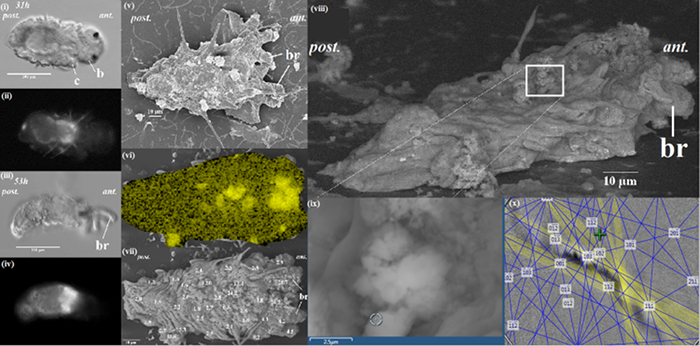
Figure 3: Characterization of Ca signals using live microscopy (from Chan et al. 2015). (i-iv), SEM-EDS (v-vii) and SEM-EBSD (viii-x). The distribution of calcium ion as correlated to calcein signal at 31 h and 53 h after metamorphosis of the Hydroides elegans. The DIC images (left panel, 3i and iii) and the calcein signal (left panel, 2ii and iv) are shown. Correlative electron microscopy on the day 2 post-metamorphic Hydroides elegans detected spots of calcified structures, as shown in a lower-voltage (5 kV) SEM image (middle panel, 3v). SEM-EDS analysis mapping, performed at 20 kV, shows a heterogeneous distribution of calcium (middle panel, 3vi, Ca; in yellow). The Ca contents are presented as numbers overlaying a greater surface detail of lower-voltage (5 kV) image of the tubeworm, the Ca contents (mol wt%, decimal points are aligned to show the location of spot analyses) obtained from spot quantification (with SEM-EDS at 20 kV) (middle panel; 3vii). Regions with a Ca content higher than 15 mol wt% are likely to be calcified structures. SEM-EBSD analysis of the calcium rich regions is illuastrated in the right panel of 2viii-x. The calcium rich regions (white box) as found in SEM-EDS results were further analyzed with EBSD (right panel; 3viii) (ii) The circle (right panel; 3ix) indicates the EBSD analysis site; a Kikuchi pattern (right panel; 2x) suggests the site is aragonitic from the interface of EDS/EBSD microanalysis software. c, collar; b, branchial lobes; ant, anterior; post, posterior. Please click here to view a larger version of this figure.
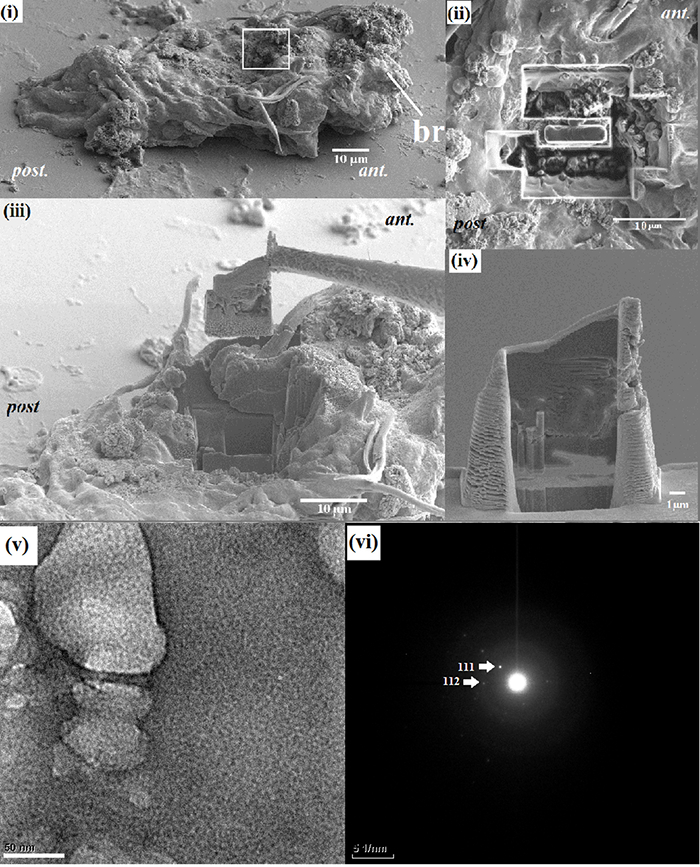
Figure 4: Characterization of crystalline structure using FIB-TEM (from Chan et al. 2015). (i) The region exhibiting a Kikuchi pattern from EBSD was excised to prepare a TEM sample, (ii) the removed surrounding material excised by a focused ion beam (FIB) technique (top view), (iii) the material was lifted using a tungsten probe (side view), (iv) the sample with a final thickness of ~200 nm, which was obtained at a lower voltage. Circled area in (v) were analyzed for the presence of selected-area diffraction pattern in a TEM (vi), showing a single-crystal pattern of aragonite. Please click here to view a larger version of this figure.
Discussion
Live optical imaging is a useful method for observing cellular events in a multicellular organism. Here, internal pH and calcium ion indicators were used to measure the flux of ions at the mineralization sites. In these regions, active ion pumping is required to elevate pH and Ca2+ concentration to enable calcification2,3. When applying fluorescent molecules to study an organism, it is critical to ensure that the concentration used has negligible toxicity and enables the organism to perform in a physiologically relevant way. A lower staining concentration would be less toxic and is usually coupled with a longer staining time10. It is important to keep a low density of larvae during the incubation time, minimizing oxygen deprivation and waste accumulation in the staining period.
Prior to pursuing the FIB/TEM methods, which involves a localized region of interest, it is crucial to screen through the life stage and tissue of interest using lower resolution methods like SEM-EDS and SEM-EBSD. Observing the specimen under backscattered mode enables visualization of relative elemental composition where lighter contrast correlates to heavier atomic weight11. Therefore, SEM-BSE images also provide an estimation of where the heavier elements like calcium ions and osmium stained lipid globules are located. SEM-EDS analysis allows more specific mapping of calcium ions on the samples. However, it does not confirm the presence of crystalline CaCO3. SEM-EBSD allows detection of crystalline structures, although conventional EBSD methods require a polished surface12. This study demonstrates how SEM-EBSD on an unpolished sample can provide useful information. A 20 kV beam current enables greater depth of analysis at the sample surface. Therefore, EBSD is a desirable method to detect the presence of biomineral, especially on small, intact biological samples like marine larvae. Although the unpolished samples would give out false negatives when minerals are not facing the detector at about 70°, seeing a Kikuchi pattern is considered to be unambiguous evidence of a mineral phase at the region of interest13.
Transmission electron microscopy (TEM) allows structural characterization of a wider range of materials14. The focused ion beam (FIB) allows for site specific extraction and preparation of a sample with typical dimensions for TEM analysis15. Therefore, the FIB/TEM technique is a suitable method to analyze newly deposited biomaterials at a localized area. Combined FIB-SEM instruments also allow damage-free observation of a specimen through use of an integrated electron beam column. Tungsten sputter coating of the specimen increases conductivity and limits ion implantation and irradiation damage of the sample16. The use of a finely focused ion beam with a low dwell time enables milling of organic materials. Inside the FIB-SEM, a particular feature of interest can be extracted from a bulk specimen and thinned to electron transparency for TEM analysis17. Due to the high energy of the ion beam, crystalline materials may be rendered amorphous. This may occur when preparing a thin lamella for TEM analysis and can be mitigated using a low accelerating voltage ion beam to remove the amorphous layer.
Declarações
The authors have nothing to disclose.
Acknowledgements
The authors would like to send a big thank you to Clemson Broadcast Productions, audio recording by J. Bright, Narration by A. D. McQuiston, Audio sweetening, K. Murphy, videography by G. Spake, Graphic arts by T. Messervy, Video editing by T. Messervy and E. Rodgers. Technical assistance and scientific advice was inspired by the advice of S. Kawada, S. Kubo, J. Hudson, T. Darroudi, D. Mulwee, H. Qian, Y. W. Lam, M. B. Johnstone, C. Campanati, A. C. Lane, and R. Dineshram. This study was funded by three GRF grants from the HKSAR-RGC (Grant Numbers: 705511P, 705112P, and 17304914).
Materials
| Hexamethyldisilazane | Electron Microscopy Sciences | 16700(EM) | |
| Osmium Tetroxide 2% Aqueous Solution | Electron Microscopy Sciences | 19192 | |
| IBMX 3-Isobutyl-1-methylxanthine | ThermoFisher Scientific | PHZ1124 | |
| Nigericin, Free Acid | ThermoFisher Scientific | N7143-5MG | |
| 35-mm-diam dish, hole size 27 mm, Glass No.0, Non-coat | ThermoFisher Scientific | D110400 | |
| 5-(and-6)-Carboxy SNARF-1, Acetoxymethyl Ester, Acetate | ThermoFisher Scientific | C-1271 | |
| BDH Potassium Chloride, ACS Grade | VWR | BDH0258-500G | |
| Paraformaldehyde reagent grade, crystalline |
Sigma | P6148 | |
| 1 M Hydrochloric Acid for Volumetric Analysis | Wako Pure Chemical Industries, Ltd | 083-01095 | |
| 0.05 M Sodium Hydroxide Solution for Volumetric Analysis | Wako Pure Chemical Industries, Ltd | 199-02185 | |
| Calcein | Sigma | C0875 | |
| FASW | Iwaki Co. Ltd. | Rei-sea Marine | |
| Mixed Cellulose Ester Membranes; 47 mm dia, 0.45 µm | ADVANTEC | A045A047A | |
| ethanol | Wako Pure Chemical Industries, Ltd | 051-00476 | |
| Artificial seawater for buffers | by SOP06 of DOE (1994), cdiac.ornl.gov/ftp/cdiac74/sop06.pdf | ||
| Sodium Chloride | Wako Pure Chemical Industries, Ltd | 191-01665 | |
| Potassium Chloride | Wako Pure Chemical Industries, Ltd | 163-03545 | |
| Magnesium Chloride Hexahydrate | Wako Pure Chemical Industries, Ltd | 135-00165 | |
| Calcium Chloride | Wako Pure Chemical Industries, Ltd | 039-00475 | |
| Sodium Sulfate | Wako Pure Chemical Industries, Ltd | 197-03345 | |
| Hydrochloric Acid | Wako Pure Chemical Industries, Ltd | 089-08415 | |
| 2-amino-2-hydroxymethyl-1,3-propanediol (tris) | Wako Pure Chemical Industries, Ltd | 207-06275 | |
| 2-aminopyridine | Wako Pure Chemical Industries, Ltd | 011-02775 | |
| Orion 5-star Plus pH meter | Thermo Scientific | ||
| PrpHecT ROSS Micro Combination pH Electrode 8220BNWP | Thermo Scientific | ||
| Axiovision, Version 4.6, Axio Observer Z1 | Zeiss | ||
| ImageJ | NIH, Bethesda, MD, USA | ||
| HRTEM H500 | Hitachi | ||
| SU6600 VPSEM | Hitachi | ||
| NB5000 Focused Ion and Electron Beam (FIB-SEM) system | Hitachi |
Referências
- Aizenberg, J., et al. Skeleton of Euplectella sp.: structural hierarchy from the nanoscale to the macroscale. Science. 309 (5732), 275-278 (2005).
- de Nooijer, L. J., Toyofuku, T., Oguri, K., Nomaki, H., Kitazato, H. Intracellular pH distribution in foraminifera determined by the fluorescent probe HPTS. Limnol Oceanogr Methods. 6 (11), 610-618 (2008).
- de Nooijer, L. J., Langer, G., Nehrke, G., Bijma, J. Physiological controls on seawater uptake and calcification in the benthic foraminifer Ammonia tepida. Biogeosciences. 6 (11), 2669-2675 (2009).
- Smith, A. M., Riedi, M. A., Winter, D. J. Temperate reefs in a changing ocean: skeletal carbonate mineralogy of serpulids. Mar Biol. 160 (9), 1-14 (2013).
- Carpizo-Ituarte, E., Hadfield, M. Stimulation of metamorphosis in the polychaete Hydroides elegans Haswell (Serpulidae). Biol. Bull. 194 (1), 14 (1998).
- Bryan, P. J., Kreider, J. L., Qian, P. Y. Settlement of the serpulid polychaete Hydroides elegans (Haswell) on the arborescent bryozoan Bugula neritina (L.): evidence of a chemically mediated relationship. J Exp Mar Biol Ecol. 220, 171-190 (1998).
- Chan, V. B. S., et al. Evidence of compositional and ultrastructural shifts during the development of calcareous tubes in the biofouling tubeworm, Hydroides elegans. J. Struct. Biol. 189 (3), 230-237 (2015).
- Dickson, A. G., Goyet, C. . Handbook of methods for the analysis of the various parameters of the carbon dioxide system in sea water. Version 2. , (1994).
- Chan, V. B. S., et al. Direct deposition of crystalline aragonite in the controlled biomineralization of the calcareous tubeworm. Front Mar Sci. 2, 97 (2015).
- Bond, J., Varley, J. Use of flow cytometry and SNARF to calibrate and measure intracellular pH in NS0 cells. Cytometry A. 64, 43-50 (2005).
- Lloyd, G. E. Atomic number and crystallographic contrast images with the SEM: a review of backscattered electron techniques. Mineral Mag. 51, 3-19 (1987).
- Perez-Huerta, A., Dauphin, Y., Cuif, J. P., Cusack, M. High resolution electron backscatter diffraction (EBSD) data from calcite biominerals in recent gastropod shells. Micron. 42 (3), 246-251 (2011).
- Bandli, B. R., Gunter, M. E. Electron backscatter diffraction from unpolished particulate specimens: examples of particle identification and application to inhalable mineral particulate identification. Am. Mineral. 97, 1269-1273 (2012).
- Hayat, M. A. . Principles and techniques of electron microscopy: biological applications. , (2000).
- Wirth, R. Focused Ion Beam (FIB) combined with SEM and TEM: Advanced analytical tools for studies of chemical composition, microstructure and crystal structure in geomaterials on a nanometre scale. Chem Geo. 261, 217-229 (2009).
- Volkert, C. A., Minor, A. M. Focused ion beam microscopy and micromachining. MRS Bull. 32, 389-399 (2007).
- Kudo, M., et al. Microtexture of larval shell of oyster, Crassostrea nippona: A FIB-TEM study. J. Struct. Biol. 169 (1), 1-5 (2009).
