1. Growth of A. tumefaciens Strains
- Culturing A. tumefaciens strains
- Use a sterile wooden stick or pipet tip to inoculate 1 mL of ATGN growth media (see materials list for the recipe) with a single colony of the desired strain.
NOTE: For A. tumefaciens depletion strains, the ATGN should contain 1 mM IPTG as an inducer to maintain biosynthesis of the essential protein. - Grow the A. tumefaciens strains overnight in ATGN at 28 °C with shaking at 225 rpm.
- Measure the optical density of the cells at 600 nm (OD600) using a spectrophotometer. Dilute the cell culture to an OD600 = ~0.2 and continue to grow until OD600 = ~0.6 is reached. For depletion strains, continue to grow with inducer until OD600 = ~0.6 is reached.
- Use wildtype and mutant strains of A. tumefaciens at OD600 = ~0.6 for target-specific staining and/or time-lapse microscopy (see sections 2 and 3.1). For depletion strains, wash out the inducer (see section 1.2.)
- Use a sterile wooden stick or pipet tip to inoculate 1 mL of ATGN growth media (see materials list for the recipe) with a single colony of the desired strain.
- Removal of inducer for characterization of A. tumefaciens protein depletion strains
- Pellet 1 mL of exponential culture (OD600 = ~0.4-0.6) by centrifugation at 7,000 x g for 5 min in a desktop centrifuge at room temperature.
- To wash, remove supernatant and resuspend the pellet in fresh media without inducer and pellet the cells as described above (1.2.1). Wash the cells a total of 3 times in fresh media.
- Resuspend the final pellet in fresh media and concentrate the cells to an OD600 = ~0.8 for immediate staining with target specific dyes (section 2 and Figure 4B-D) or time-lapse microscopy (section 3.2 and Figure 4A). Alternatively, pre-deplete the cells for the desired amount of time by growing the cells in media without inducer prior to staining and imaging of the cells.
2. Target-specific Staining of A. tumefaciens Cells
- Fluorescent d-amino acid cell wall labeling
NOTE: FDAAs are non-toxic fluorescent d-amino acids which are readily incorporated into the A. tumefaciens peptidoglycan. This simple labeling procedure probes growth patterning in live cells6. Protocols for synthesis of four FDAAs are available38.- Pellet 500 µL of exponential culture (OD600 = ~0.4-0.6) by centrifugation at 7,000 x g for 5 min in a desktop centrifuge. Resuspend the cell pellet in 100 µL of fresh media.
- Add 5 µL of 5 mM FDAA to washed and concentrated cells and incubate for 2 min in the dark.
NOTE: Limit FDAA exposure to light. The time of incubation will vary depending on the growth rate of the strain. Typically, incubation times should be 5-10% of the doubling time6. - Pellet the cells by centrifugation and wash cell pellets with phosphate buffered saline (PBS) three times.
- Resuspend pellet in ~50 µL PBS.
NOTE: The volume of PBS used for resuspension may vary based on pellet size. - Apply 0.8-1 µL of cells to an agarose pad and image using epifluorescence microscopy immediately (See sections 3.1 and 3.2).
- Alternatively, stop further label incorporation by fixing the cells with ice-cold 70% ethanol. Resuspend the cell pellet in 1 mL of ice-cold 70% ethanol and incubate on ice for 15 minutes.
- Collect cells by centrifugation and resuspend in a small volume of PBS for imaging at a later time. Store cell suspensions at 4 °C and image within 48 hours.
- DNA staining with DAPI or Orange stain
NOTE: To observe DNA structure, cells are labeled with either DAPI or Orange (dead cell stain). Although classically described as a "dead-cell stain", Orange is permeant, photostable, and does not affect the growth of bacterial cells, enabling live-cell DNA imaging10. In A. tumefaciens, Orange labeling works well in living cells and is suitable for time-lapse microscopy (Figure 3). In contrast, the ultraviolet (UV) light exposure necessary for imaging DAPI-stained cells is phototoxic (Figure 3) and thus DAPI staining is best suited for staining live cells for immediate imaging or staining fixed cells.- DAPI staining of cells
- Pellet 1 mL of exponential culture (OD600 = ~0.4-0.6) by centrifugation at 7,000 x g for 5 min in a desktop centrifuge.
- Optionally, to fix cells prior to staining, resuspend the cell pellet in 1 mL of 70% ice-cold ethanol. Incubate on ice for 10-15 min. Collect the cells by centrifugation as described in 2.2.1.1.
- Resuspend the cell pellet in 1 mL of PBS containing 1 µL of DAPI stock solution (1 mg/mL; see Materials Table). Mix gently by pipetting and incubate for 5 minutes in the dark.
- Pellet cells by centrifugation at 7,000 x g for 5 min and resuspend in 1 mL of PBS to remove excess DAPI. Wash the cells two more times and resuspend the pellet in 50 µL PBS or media.
- Apply 0.8-1 µL of cells to an agarose pad and image using epifluorescence microscopy immediately. See sections 3.1 and 3.2.
NOTE: This protocol is not optimal for time-lapse microscopy to observe chromosome dynamics (Figure 3). Consider using Orange staining as an alternative (see section 2.2.2).
- Orange staining of live cells
- Pellet 1 mL of exponential culture (OD600 = ~0.4-0.6) by centrifugation at 7,000 x g for 5 min in a desktop centrifuge. Resuspend cell pellet in 1 mL of PBS containing 1 µL of Orange stock solution (see materials list). Mix gently by pipetting and incubate for 5 min in the dark.
- Pellet cells by centrifugation and resuspend in 1 mL of PBS to remove excess Orange. Wash the cells two more times and resuspend the pellet in 50 µL PBS.
- Apply 0.8-1 µL of cells to an agarose pad and image using epifluorescence microscopy immediately. See sections 3.1 and 3.2.
NOTE: This protocol works well with live cells and is suitable for time-lapse microscopy to observe chromosome dynamics (Figure 3). If it is not convenient to image immediately, cells may be fixed in ice-cold 70% ethanol (see section 2.2.1.2).
- DAPI staining of cells
- Membrane labeling
NOTE: The lipophilic styryl fluorescent dye 4-64 has been used extensively to observe the membrane of bacterial cells. In contrast to many bacteria, 4-64 labeled A. tumefaciens cells do not label uniformly, but rather frequently exhibit a "horseshoe" pattern14,15. Remarkably, the growth pole is nearly devoid of stain whereas the old pole is intensely labeled. Thus, 4-64 enables visualization of both cell growth patterns and membrane structure in A. tumefaciens.- Add FM 4-64 to a final concentration of 8 µg/mL in 1 mL of exponential phase cell culture and incubate at room temperature for 5 minutes in the dark.
- Pellet labeled cells by centrifugation at 7,000 x g for 5 minutes in a desktop centrifuge and resuspend cell pellet in 1 mL of PBS. Wash the cells a total of three times to remove excess dye.
- Resuspend cells in a small volume of PBS and spot on an agarose pad to image immediately. (See sections 3.1 and 3.2)
CAUTION: Cells must be imaged immediately to observe characteristic labeling patterns.
3. Imaging of A. tumefaciens Cells
- Agarose pad preparation
NOTE: Figure 1 contains an image sequence (panel A) and schematic (panel B) of a typical agarose pad prepared for time-lapse microscopy. Agarose pads are typically prepared as needed.- 3.1.1. Use a coverslip as a guide and cut a 22 mm x 22 mm square of laboratory film (see materials list) by running a scalpel around the edges.
- Cut a square out of the center of the laboratory film leaving a ~2-5 mm border to serve as a gasket for the agarose pad. Discard the center cutout.
- Place the film gasket onto a glass slide (75 mm x 25 mm) cleaned with an ammonia and alcohol-free cleaner (see materials list) and heat until the film is slightly melted onto glass (top image in Figure 1A). To melt laboratory film, use the edge of a heat block set to 70 °C or melt lightly over a flame.
- Prepare agarose solution by mixing ~0.075 g agarose (see materials list) in 5 mL of media in a small flask. Heat the solution in a microwave with periodic swirling to mix until the agarose is dissolved and the solution is clear. Keep the agarose solution at 55-70 °C and use for construction of multiple agarose pads within 48 hours.
- Pipette media containing 1.2-1.5% agarose into the center of the gasket.
NOTE: The volume of media is typically 50 – 60 µL but will vary based on gasket size. Adding media to a cold slide can cause the agarose to solidify too quickly, thus the slide should be kept on a warm surface. The edge of a heat block set to 70 °C works well. Water agarose or buffered agarose solutions such as phosphate buffered saline (PBS) can be used instead of media containing agarose for applications in which continued cell growth is not required. For imaging depletion strains, inducer can be present or absent in the media. Presence of inducer can be used as a control whereas the absence of inducer will reveal the depletion phenotype. - Place a coverslip over the gasket to evenly distribute the agarose.
- Place slide on a cool, level surface to solidify for ~2 min. Avoid overdrying of the agarose pad as this will result in a wrinkled surface on the agarose pad and pooling of the cell suspension when applied to the surface.
- Carefully slide the coverslip off the agarose pad.
Caution: Do not rush this step. The agarose pad can easily tear and an uneven agarose pad can make imaging difficult. - Allow the agarose pad to air dry for 1-2 min at room temperature until the surface of the pad appears dry. Using a scalpel, remove a small strip of agarose to create an air pocket (middle image, Figure 1A); the air pocket is typically ~2 mm x 7-10 mm and A. tumefaciens cells tend to grow best near the air pocket (Figure 1C).
NOTE: For imaging of fixed cells or under conditions where growth is not monitored, an air pocket is not necessary. - Spot 0.8-1 µL of cells on the agarose pad and cover with a new coverslip. Gently place the coverslip over the top of the agarose pad to distribute the cells across the surface of the agarose pad.
- Seal the edges of the coverslip using melted VALAP (see Materials Table for recipe; Figure 1A, bottom image). Failure to seal along all the edges and corners of the coverslip can cause drying of the agarose pad, which will lead to the drifting of cells during imaging. NOTE: Sealing of the coverslip is only needed for long-term time-lapse imaging.
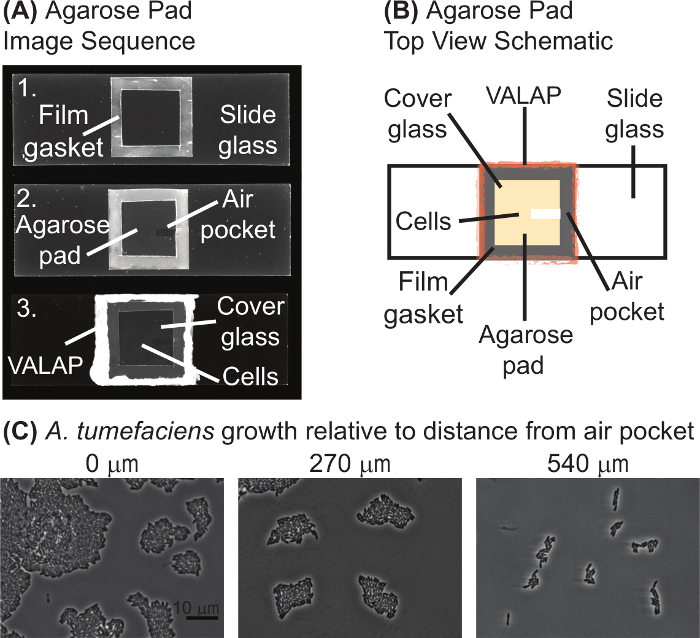
Figure 1: Agarose pad preparation. (A) Image sequence of the agarose pad preparation protocol. Image 1 is a slide with the laboratory film gasket. In image 2, the agarose pad and air pocket are visualized. Finally, image 3 shows the complete agarose pad with the cells under a coverglass and sealed with VALAP. (B) A schematic of an agarose pad for time-lapse microscopy is provided. Key features of the agarose pad are labeled on the schematic. (C) The air pocket promoted growth of A. tumefaciens on agarose pads. Images of wildtype A. tumefaciens cells grown on an agarose pad for 20 hours are shown. Images were taken at positions increasingly distant from the air pocket. The distance from the closest edge of the image to the air pocket is shown above each image. Scale bar = 10 µm. Please click here to view a larger version of this figure.
- Imaging
NOTE: Differential interference contrast, phase contrast, and epifluorescence imaging is performed with an inverted microscope equipped with hardware-based autofocusing, an automated stage, standard filters, an LED light source, 60X oil immersion objectives (1.4 NA) for phase contrast or differential interference contrast (DIC), and a 1K electron-multiplying charge-coupled-device (EMCCD) camera. The microscope should be placed in a temperature controlled room. Alternatively, a stage warmer or chamber can be used to maintain consistent temperatures during imaging.- Epifluorescence microscopy
NOTE: For fluorescence imaging of live cells, it is necessary to limit the number of image acquisitions and optimize the exposure time to minimize photobleaching and phototoxicity. For imaging of each dye, it is recommended to find an optimal exposure time which provides sufficient fluorescence detection but does not lead to photobleaching or phototoxicity. In Figures 2-4, exposure times of 200 ms were used for all fluorescence images. For the time-lapse sequences shown in Figure 3, images were acquired every 10 min for 3 h.- Place immersion oil on the desired objective and place the inverted slide into the slide holder on the stage. Use the focusing knobs to bring the cells into focus.
- Acquire images in phase (or DIC) and the desired fluorescence filter.
NOTE: The maximal excitation and emission wavelengths for the stains used in Figure 2, Figure 3, and Figure 4 are as follows: HADA (405/460), NADA (450/555), TADA (555/570), 4-64 (515/640), DAPI (360/460), Orange (547/570).
- Time-lapse microscopy
NOTE: During time-lapse microscopy the following features are computer controlled: x, y, and z position, shutters, and fluorescence filters. A hardware-based auto-focus system is optimal to maintain focus during time-lapse imaging. Alternatively, a software-based auto-focusing loop can be used.- Place immersion oil on the desired objective and place the inverted slide into the slide holder on the stage. Use the focusing knobs to bring the cells into focus.
- Optionally: Acquire multiple (x,y) positions. Randomly select 10 fields of cells in close proximity to the air pocket of the agarose pads.
- Set-up the time sequence acquisition to image in phase or DIC at the desired time interval.
NOTE: For the time-lapse sequence shown in Figure 4, DIC images were acquired with 30 ms exposure every 10 min for 14 h. When using fluorescence imaging during time-lapse microscopy, adjust the acquisition interval and exposure time to minimize photobleaching and phototoxicity.
- Epifluorescence microscopy
Target-specific labeling of wildtype A. tumefaciens cells
In order to illustrate that cell morphology is not impacted by the wash steps or treatment with 1% DMSO (which is used to dilute the fluorescent dyes), cells were imaged directly from culture (Figure 2A, far left panel), after washing the cells by centrifugation as described in 1.2 (Figure 2A, left panel), or after incubating the cells with 1% DMSO for 10 min and washing the cells (Figure 2A, right panel). These images illustrate that morphology is not impacted by washing or the presence of DMSO. In addition, cell growth is not impacted by washing or DMSO treatment based on growth curve analysis (data not shown). In addition, fixing A. tumefaciens with ice-cold ethanol does not cause gross changes in morphology (Figure 2A, far right panel).
Next, target specific dyes were used to observe cell wall biogenesis, membrane domains, and DNA within wildtype A. tumefaciens cells. The patterns of new peptidoglycan insertion were observed following labeling with three fluorescent-d-amino acids: HADA (Figure 2B, left panel), NADA (Figure 2B, center panel), and TADA (Figure 2C, right panel). In all three labeling experiments, new peptidoglycan labeling was enriched at the growth pole or septum of the cells. These growth patterns were consistently observed with all three FDAAs, indicating that the FDAA selection can be modified to enable dual labeling with other stains or cells expressing fluorescently labeled proteins. The lipophilic dye 4-64 preferentially labels the old pole region of A. tumefaciens cells resulting in a characteristic horseshoe pattern (Figure 2C). Both Orange (Figure 2D, left panel) and DAPI (Figure 2D, right panel) label DNA within live A. tumefaciens cells. In late pre-divisional cells, two distinct nucleoids are observed with Orange staining, whereas DNA labeling appears more diffuse with DAPI staining (Figure 2D) consistent with experiments results observed in E. coli10.
Suitability of DNA dyes for time-lapse microscopy
In order to determine if either DAPI or Orange are suitable for time-lapse imaging of nucleoid morphology during cell growth, an equal proportion of unlabeled, DAPI-labeled, and Orange-labeled wildtype A. tumefaciens cells were mixed and spotted on agarose pads. At time 0, initial images were taken using phase contrast, DAPI, and TRITC filters to determine if each cell was labeled. The cell mixtures were then imaged under three different conditions: (1) phase contrast microscopy only, (2) phase contrast and epifluorescence microscopy using the TRITC filter and (3) phase contrast and epifluorescence microscopy using the DAPI filter. Images were acquired every 10 minutes for 3 hours. All cells grew well irrespective of the fluorescent stain used when imaged with phase contrast microscopy indicating that neither Orange or DAPI staining impair cell growth (Figure 3, top panel). All cells also grew well when imaged by phase microscopy and epifluorescence microscopy using the TRITC filter (Figure 3, center panel). The Orange label is subject to photobleaching but can be observed for at least 2 h (13 total exposures of 200 ms), indicating the suitability of this dye for short-term microscopy of live cells. Irrespective of labeling, all cells stop growing within an hour when imaged by phase microscopy and epifluorescence microscopy using the DAPI filter (Figure 3, bottom panel). This observation demonstrates that A. tumefaciens is sensitive to UV exposure and indicates that dyes requiring a UV filter for imaging should be avoided for time-lapse microscopy experiments.
Time-lapse imaging and target-specific labeling of an A. tumefaciens depletion strain
Both saturating transposon mutagenesis39 and failing to construct a deletion strain18,40 indicate that the master regulator protein, CtrA, is essential in A. tumefaciens. To demonstrate the value of microscopic analysis of depletion strains, a previously described ctrA depletion strain18 was subjected to characterization by microscopy. In Figure 4A, time-lapse microscopy was used to compare the growth of ctrA depletion cells in which ctrA expression was induced (top) and uninduced (bottom). In the presence of CtrA, a single cell gave rise to a microcolony within 14 h. In contrast, when CtrA was depleted, cells either lysed or failed to divide. Cells that failed to divide exhibited gross morphological changes including rounding from mid-cell and at the cell poles. These observations suggest that CtrA has an important function in the regulation of cell division.
In Figure 4B-D, fluorescent dyes were used to characterize the ctrA depletion strain after induction or depletion of ctrA for 10 h. Cells were pulse labeled with NADA for 2 min (Figure 4B). When CtrA was present (top panel), polar peptidoglycan biosynthesis was observed. In contrast, extensive NADA labelling occurred in the poles and large mid-cell swellings occurred when CtrA was depleted. This observation is consistent with continued peptidoglycan synthesis despite a failure of the cells to divide. The cyanine DNA dye Orange was used to characterize DNA distribution in the ctrA depletion strain (Figure 4C). When CtrA was present, growing cells had an even distribution of DNA and segregation of nucleoids was apparent in a late pre-divisional cell; in contrast, when CtrA was depleted, DNA was unevenly distributed throughout the cells. These observations suggest that CtrA contributes to proper DNA replication or segregation. Finally, ctrA depletion cells were labeled with 4-64 (Figure 4D). In the presence of CtrA, the cell membrane was labeled with a characteristic horseshoe pattern in which the growth pole was devoid of stain. In cells depleted of CtrA, 4-64 appeared to label the entire membrane, although one pole was more intensely stained. This observation suggests that membranes remain intact although the lipid microdomain organization may be disrupted when CtrA is depleted.
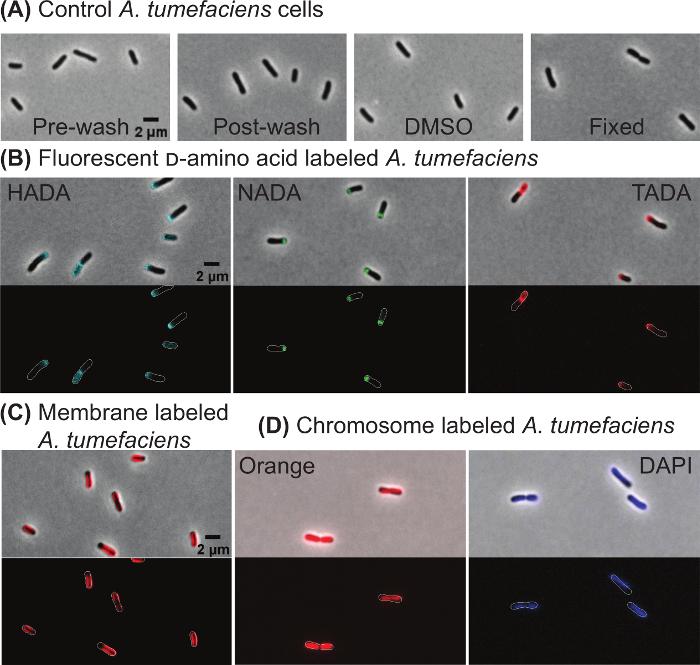
Figure 2: Representative images of wildtype Agrobacterium tumefaciens cells labeled with target specific dyes. (A) Phase contrast images of A. tumefaciens cells before and after the washing protocol, when treated with 1% DMSO, or after fixation with ice-cold ethanol. (B) Polar growth of A. tumefaciens cells is shown by labeling with the fluorescent d-amino acids HADA, NADA, and TADA. (C) Staining of A. tumefaciens with the lipophilic 4-64 stain. (D) Staining of A. tumefaciens cells with the DNA-specific dyes Orange and DAPI. For panels B-D, phase contrast (top) and epifluorescence (bottom) images are shown. Cell outlines are provided in fluorescence images for reference. Scale bar = 2 µm. Please click here to view a larger version of this figure.
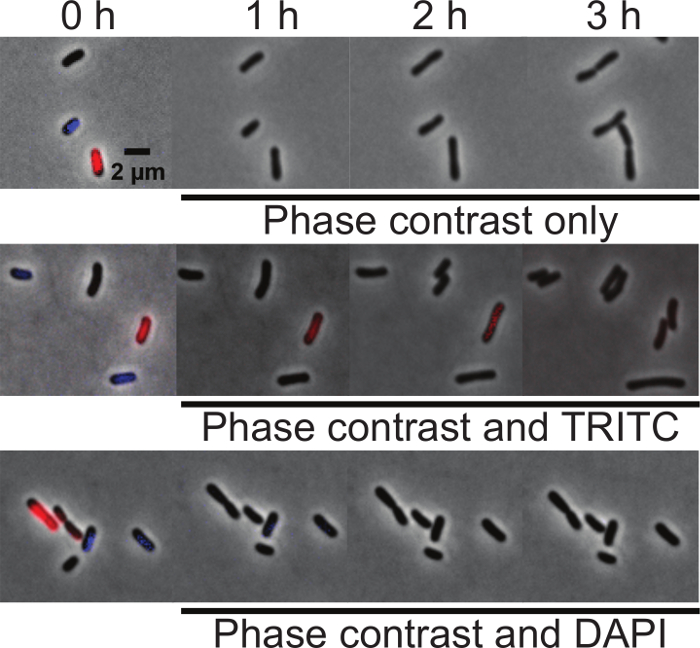
Figure 3: Comparison of DAPI and Orange labeling of DNA in live A. tumefaciens cells. Equal proportions of unlabeled, DAPI-labeled, and Orange-labeled wildtype A. tumefaciens cells were mixed and spotted on agarose pads. At time 0, initial images were taken using phase contrast, TRITC, and DAPI filters to determine if the cells were labeled. (A) Time-lapse of unlabeled, DAPI-labeled, and Orange-labeled cells imaged by phase contrast microscopy. (B) Time-lapse of unlabeled, DAPI-labeled, and Orange-labeled cells imaged by phase microscopy and epifluorescence microscopy using the TRITC filter. (C) Time-lapse of unlabeled, DAPI-labeled, and Orange-labeled cells imaged by phase microscopy and epifluorescence microscopy using the DAPI filter. Scale bar = 2 µm. Please click here to view a larger version of this figure.
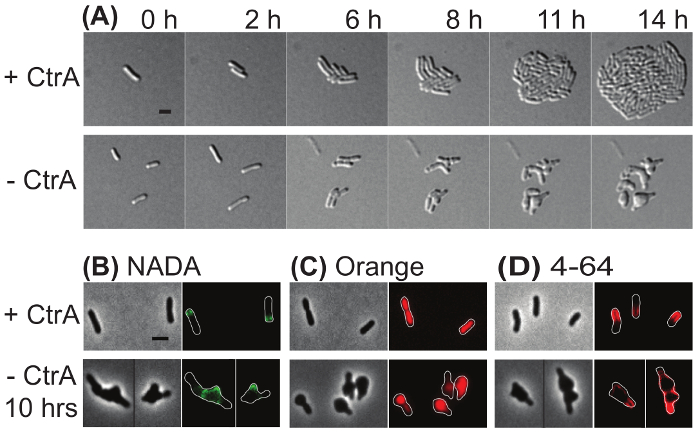
Figure 4: Representative images of the ctrA depletion strain in induced and uninduced conditions. (A) Time-lapse microscopy of the ctrA depletion strain under conditions where ctrA was induced (top) or depleted (bottom). The numbers above each panel indicate the time in hours. (B) Phase contrast (left) and epifluorescence (right) images of cells labeled with NADA. (C) Phase contrast (left) and fluorescence (right) images of cells labeled with Orange. (D) Phase contrast (left) and fluorescence (right) images of cells labeled with 4-64. Cell outlines were provided in fluorescence images for reference. Scale bar = 2 µm. Please click here to view a larger version of this figure.
