1. Preparation of Cells
NOTE: This procedure describes the lentiviral transduction of an immortalized cell line (BEAS-2B; ATCC, Manassas, VA) to express the desired reporter (roGFP2 or HyPer). Other cell lines/types and/or methods of gene transfer, including transfection, can be utilized as long as they result in a level of reporter expression adequate to visualize a sufficient number of sensor-expressing cells per field of view (typically 5 – 10 cells). If using transfection methods, the procedure should be performed in the dish that will ultimately be used for the method of analysis (e.g., transfect the cells in the same dish that will be presented to the microscope). The steps described below provide details for preparing cell transductions to be performed in a 6-well cell culture plate. If this format is not an appropriate size for the desired application, other vessels can be substituted.
- Grow cells to approximately 40 – 60% confluence in normal growth media.
NOTE: This study utilized the human bronchial epithelial cell line, BEAS-2B, grown in keratinocyte growth medium (KGM). - Just prior to transduction, replace the growth media on the cells with 500 µL of serum-free media containing the appropriate amount of virus, as calculated by the formula:

- For transduction of BEAS-2B cells, use serum-free keratinocyte basal medium (KBM) to replace the KGM growth media during viral incubations.
NOTE: The above calculation is for a single transduction of one well of cells in a 6-well format. If needed, perform transductions of several wells can be performed by adjusting the formula with a multiplication by the number of wells to be transduced. For lentiviral transductions, use a multiplicity of infection (MOI) between 5 and 20. For adenoviral transductions, use an MOI between 100 and 500.
- For transduction of BEAS-2B cells, use serum-free keratinocyte basal medium (KBM) to replace the KGM growth media during viral incubations.
- Incubate cells with the viral mixture at 37 °C for 4 h, redistributing the viral particles in the dish every 30 to 60 min with a brief rocking or swirling motion.
- Add 1 mL of complete growth media to the dish and incubate at 37 °C for an additional 4 – 16 h.
- Remove all media and replace with fresh complete growth media.
- Continue to grow and passage cells, expand as needed.
NOTE: Cells should begin appreciably expressing the sensor within 12 – 48 h. If a lentiviral vector was used for the transduction, stable expression of the desired sensor should continue across passages. - For microscopy-based assessments, seed cells into glass bottomed microscope dishes and grow to desired confluence (≥70 – 80%) prior to imaging.
NOTE: Seeding density will depend on the size of the dish, growth rate of the cell-line being used, and the time of the assessment following seeding. For example, seed 300,000 BEAS-2B cells into a 35-mm dish to yield approximately 70 – 80% confluence after 1 day of growth.
2. Microscopy Set-up
NOTE: The protocol described below is performed using a confocal microscope equipped with laser lines at 404 and 488 nm. Other means of making fluorometric assessments of the sensors described within this protocol at their prescribed excitations/emission should also yield viable data. Importantly, equipment settings can vary greatly depending on the type, age, and condition of the instrument being used; thus, any instrument values mentioned may not be specific to the equipment used in other laboratories.
- Perform all imaging analysis using environmental controls to maintain an appropriate temperature (e.g., 37 °C), humidity (typically >95% relative humidity), and/or gas concentration (e.g., 5% CO2) suitable for the cells throughout the duration of the experiment.
- If using high values of relative humidity, keep any surfaces that may come in contact with the humidified atmosphere (e.g., the microscope objective) at or slightly above the temperature at which the humidity is generated in order to prevent condensation. This can be accomplished with the use of an objective heater and/or heating tape and an appropriate heater control.
- Turn on all microscope components and set up all equipment required for sequential excitation at 488 and 404 nm with emission at 510 nm. Ensure all components of the optical configuration are set appropriately for real-time acquisition.
- Set up a stage-top environmental chamber to maintain constant temperature at 37 °C, 5% CO2 atmosphere, and >95% humidity. Prior to starting image acquisition, equilibrate the environmental chamber for at least 10 min after the initial set-up of all environmental controls.
NOTE: Environmental conditions may be eliminated or adjusted depending on the experiment length, cell type, and exposure being used. - Place the dish of cells (Step 1.7) on the stage-top within the environmental chamber.
- With the desired objective lens, find the focal plane of cells using the eyepiece and white light, and ensure normal morphology.
NOTE: A 1.4 NA 60X violet-corrected, oil-immersed objective lens is commonly used, which permits identification of intracellular compartments while maximizing the optical resolution of the confocal system. - Check the fluorescence expression of the cells in the field of view. Do it while visualizing the cells under wide-field fluorescence illumination with an appropriate filter set, such as fluorescein isothiocyanate (FITC). At this point, using wide-field illumination while looking through the eyepiece is more convenient because it is easier to move the dish to select a field of cells to study. In general, choose a field of view that contains at least 5 to 10 cells that are expressing the sensor, as indicated by green fluorescence.
- Alternatively, perform this assessment confocally using laser excitation at a wavelength that is most compatible with the sensor being expressed (488 nm typically works best).
NOTE: Due to their intrinsic fluorescent properties, it will be more difficult to visualize cells expressing HyPer than those expressing roGFP2 using either FITC or at 488 nm. However, it should still be possible to see faint cells.
- Alternatively, perform this assessment confocally using laser excitation at a wavelength that is most compatible with the sensor being expressed (488 nm typically works best).
- Once a desired field of view is found, close the environmental chamber.
NOTE: Use the focus-maintaining feature, often available on advanced microscope stands, to facilitate maintenance of a stable focal plane throughout the study. - Set up acquisition parameters to ensure optimal assessment of the sensor of interest across the desired exposure period. Below are recommendations and approaches for confocal imaging of sensor responses:
- Adjust the laser power for excitation at 488 nm and emission at 510 nm. Choose a laser power level that allows visualization of the cells, and keep this constant between samples or replicate dishes.
NOTE: For this study, 12% and 1.5% laser power were used for the 488 and 404 nm laser lines, respectively. - Use the confocal controls of the acquisition software to ensure that the selected focal plane has been optimized for maximal fluorescence emission intensity in the center of the cells (z-axis) by scanning at 488 nm while adjusting the z-plane. This is made easier by using a high gain setting while searching for the z-plane that results in the most over-exposed cells. Once the appropriate focal plane has been found, return the gain to a setting that is most optimal for the fluorescence of the reporter being used without oversaturating the pixels being observed.
NOTE: The laser and gain settings that are appropriate for finding and observing cells during experimentation is completely dependent on the confocal system being utilized. In general, once the cells have been found in the field of view, it is recommended that a minimal amount of laser power be used (typically ≤20%), as excessive scanning of cells using high-powered laser light may induce oxidative changes detectable by the sensor. - Use the gain to fine-tune the baseline fluorescence. With roGFP2, establish the baseline near the upper limit (≈ 90% relative intensity) of the instrument without over-saturation, as these cells will lose 510 nm fluorescence induced by 488 nm excitation when EGSH increases. In contrast, the fluorescence intensity with 488 nm excitation should be low (≈ 10% relative intensity) at baseline for HyPer expressing cells, as these cells will gain 510 nm fluorescence intensity when H2O2 is detected.
- Repeat steps 2.9.2 and 2.9.3 with excitation at 404 nm and emission at 510 nm. Gain settings for the 404 nm excitation wavelength are opposite to those used with 488 nm excitation for each sensor (i.e., low baseline fluorescence (≈ 10% relative intensity) at 404 nm for roGFP2, high baseline fluorescence (≈ 90% relative intensity) for the H2O2 sensor).
NOTE: In general, the fluorescence (510 emission) at 404 nm excitation will be considerably lower than that obtainable with 488 nm excitation in cells expressing both roGFP2 and HyPer, as the 404 nm peak is a relatively minor excitation maximum for both of these sensors.
- Adjust the laser power for excitation at 488 nm and emission at 510 nm. Choose a laser power level that allows visualization of the cells, and keep this constant between samples or replicate dishes.
3. Data Acquisition
- Set up the acquisition software to sequentially excite the two excitation wavelengths (first 488 nm and then 404 nm) and collect emissions for both at 510 nm at a predetermined time interval throughout the desired length of the experiment (e.g. capture images every 60 s for 60 min).
- Alternatively, acquire images manually before and after exposures if the approximate timing of changes in EGSH or H2O2 are known for the xenobiotic being tested. However, this may lead to loss of temporal resolution.
- For real-time assessment of experimental parameters, choose at least 5 – 10 sensor-expressing cells in the field and establish them as regions of interest ("ROIs") to monitor their fluorescence changes during the experiment.
NOTE: This step is optional, and can be performed after the experiment if direct observation in real-time is undesirable or software limitations prevent continuous monitoring. Depending on the cell population, the selection of sensor expressing cells as ROIs might represent a range of expression levels across cells.- For these studies, add the environmental toxicant 9,10-phenanthrenequinone (9,10-PQ) or hydrogen peroxide (H2O2) after a 5-min baseline period.
- Prepare all reagents for later use in this protocol. Dissolve 9,10-PQ in dimethyl sulfoxide (DMSO) to a concentration of 15 mM, and dilute in basal cell media to yield a 250 µM working solution. Additionally, prepare a working solution of hydrogen peroxide in water that will yield a final concentration of 1mM upon injection.
- Once the experimental parameters have been defined, begin the time course acquisition. Establish a baseline period of at least 5 min (or 5 data points) prior to starting xenobiotic exposures.
- Expose the cells to the toxicant being investigated using conventional approaches for in vitro dosing. Prepare soluble compounds in either water or other appropriate solvent and inject directly into the media.
- If organic solvents (e.g. dimethyl sulfoxide or ethanol) are required, keep the final solvent concentration at or below 0.1%. Verify that the solvent does not produce an effect on EGSH or H2O2 production with a vehicle control in a separate dish of cells.
- For compounds with lower solubility, add a mixing step using a micropipette to the protocol after the injection is made. Pump gaseous exposures directly into the environmental chamber using the appropriate carrier gas mixture.
- Monitor changes in fluorescence during the exposure period. Perform subsequent injections as needed. Take great care not to shift the dish during injections, so that the same cells are followed throughout the entire time course while imaged in the same focal plane.
- At the end of the experiment, expose the cells to appropriate controls. For both genetically-encoded fluorogenic sensors, add specific concentrations of compounds known to oxidize and reduce these sensors in a pointed demonstration of their ratiometric responsiveness. H2O2 and dithiothreitol (DTT) serve as appropriate controls to oxidize and reduce both sensors. Typically, a final concentration of 100 – 1,000 µM H2O2, followed by 1-5 mM dithiothreitol (DTT), allows the user to fully oxidize and reduce these sensors.
- For these studies, use 1 mM H2O2 followed by 5 mM DTT to determine the maximum sensor response.
- Wait at least 5 min to allow the sensor to respond, and then inject a reducing agent, such as DTT, to reduce the senor and return it to a level of fluorescence at or near its established baseline.
NOTE: The use of controls in this step is crucial for normalization, and should be performed at the end of every experiment to determine the dynamic range of the sensor in each cell. For roGFP2, aldrithiol can also be added at the end of the experiment. Aldrithiol bypasses the roGFP2 redox relay to oxidize the sensor directly. This is useful to assess sensor function following xenobiotic exposure.
4. Data Analysis
- If not already established, draw ROIs around the cells to be analyzed. Use the appropriate software to measure the fluorescence intensity of each ROI at each wavelength throughout the time course. Ensure that the cells did not move or the plate did not shift during the run.
NOTE: The establishment of ROIs is most easily accomplished by drawing an enclosed region that follows the fluorescent expression pattern of each cell. To further assist with this process, a transmitted light (or brightfield) image of the cells within the established field of view can be overlaid onto the fluorescent image in efforts to define cell boundaries. However, the use of a transmitted light image requires the user to capture an additional channel (set of images) throughout the course of the experiment. Alternatively, certain manufacturers incorporate algorithms into their imaging software that use specific parameters such as intensity thresholds to establish ROIs in a more quantitative, less subjective, method. - Export the data to desired analysis software (e.g., electronic spreadsheet).
- Calculate the ratiometric sensor response for each ROI at each time point using the formulas:


- For each time point, average the calculated ratiometric values of all ROIs.
- Calculate the baseline value, which will be used to normalize the data, by averaging the previously calculated ratiometric values (step 4.4) collected before addition of the xenobiotic (e.g., the first five-time points).
- Normalize the ratiometric values from step 4.4 by dividing each value by the baseline value calculated in 4.5. Normalized ratios will center around a value of 1 at baseline, while increases in EGSH or H2O2 following injections will cause the ratio to increase. Assessments of xenobiotic that induce oxidative changes tend to yield values in a range of 3 – 6 times the baseline value.
- To aid in comparing responses within and across experiments, express the normalized data as a percentage of maximal sensor response by defining the response to the control oxidant (e.g., 1 mM H2O2) as 100%.
NOTE: If expressing data as a percentage of maximal sensor response, it is critical to ensure that the same concentration of the control oxidant is used consistently across experiments. All data derived from live-cell imaging analysis is amenable to conventional pair-wise and group-wise statistical analysis to be chosen at the discretion of the investigator.
The use of roGFP2 and HyPer in detecting changes in EGSH and intracellular H2O2 has been well described previously25,36,42,43 and is demonstrated here. Confocal images of cells expressing roGFP2 at baseline and following addition of H2O2 and DTT are shown in Figure 2. Data from images collected throughout the experiment were then exported and analyzed as described in section 4 of the protocol. As shown, the addition of exogenous H2O2 as a positive control produces reproducible responses when the data are normalized to their respective baseline and a defined dynamic range is established through addition of known exogenous oxidants/reductants (i.e., H2O2 and DTT) (Figures 3, 4, and 5).
Responses to toxicological stimuli are typically more variable than those induced by controls. This is to be expected, as xenobiotic compounds may have pleiotropic effects on cells, ranging from redox cycling to adduction of intracellular proteins. Examples of roGFP2 and HyPer responses induced by exposure to the toxicant 9,10-PQ, an oxidizing air pollutant formed by atmospheric reactions of phenanthrene44, are presented in Figures 6 and 7. The graphs in these figures depict the progression of each step involved in the data analysis outlined in section 4 of the protocol. As shown, normalization of each cell to its own baseline and positive control (Figure 6B), reduces intercellular variability in the magnitude of the sensor response from the raw data (Figure 6A). In cases where the variance in the cellular response is of interest, normalization of the data can be performed up to this point, with individual cells represented by their own lines on the graph. Variation in the magnitude or kinetics of the responses among cells in the same dish can reveal important mechanistic insights that reflect differences in the cell cycle, for instance. Alternatively, the averaged response of the cells in the dish can be presented along with the standard deviation (Figure 6C). Otherwise, if replicates of separate experiments are being presented, the data may be presented as the normalized relative fluorescence intensity values or a percentage of the maximum response induced by the control oxidant (Figures 3, 4, 5, and 6D), showing the average of all replicates accompanied by the standard error of the mean. The ambient air contaminant 9,10-PQ is known to be a potent redox cycler, which we hypothesize is responsible for the cyclical peaks of hydrogen peroxide production detected by HyPer (Figure 7) and stepwise EGSH increases detected by roGFP2 (Figure 6D).
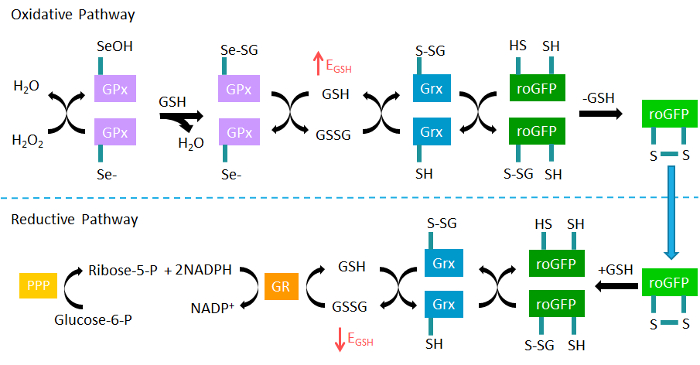
Figure 1. The roGFP2 glutathione redox relay. Glutathione peroxidases (GPx) oxidize reduced glutathione (GSH) to GSSG in response to hydrogen peroxide (H2O2), thus increasing the glutathione redox potential (EGSH). The fluorogenic sensor roGFP2 equilibrates with intracellular EGSH when oxidized by glutaredoxin (Grx). In the reductive pathway, Grx catalyzes the reduction of roGFP2 through deglutathionylation as GSSG levels decrease and normal levels of GSH are reestablished by glutathione reductase (GR) at the expense of NADPH. NADPH is supplied by glucose through the pentose phosphate pathway (PPP). Adapted from Gibbs-Flournoy et al35. Please click here to view a larger version of this figure.
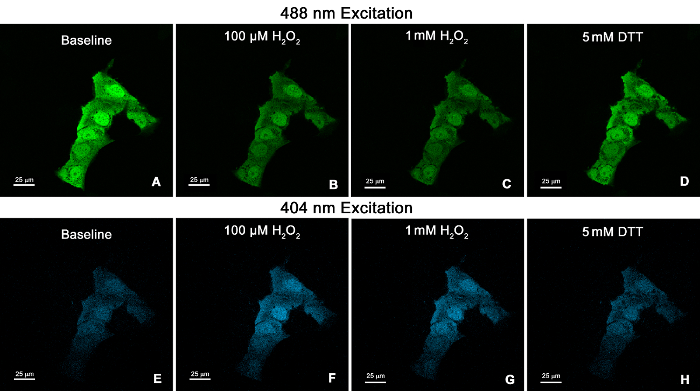
Figure 2. Confocal microscopy images of the human bronchial epithelial cell line BEAS-2B expressing cytosolic roGFP2. Cells were illuminated at 488 nm (A-D), followed by 404 nm (E-H). Images show fluorescence emitted at 510 nm for the following conditions: baseline (A, E), 100 µM H2O2(B, F), 1 mM H2O2 (C, G), and 5 mM DTT (D, H). 60X Plan Apo VC objective. Scale bars represent 25 µm. Please click here to view a larger version of this figure.
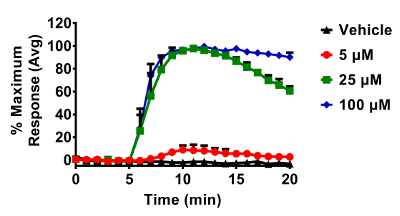
Figure 3. Dose dependent changes in roGFP2 induced by H2O2 in BEAS-2B cells. Cells were equilibrated for 30 min in phenol-red free keratinocyte basal media (KBM) prior to exposures. All additions of H2O2 occurred after a baseline period of 5 min. roGFP2 fluorescence emitted at 510 nm was collected using a 525/30 nm band pass filter following laser excitation at 404 and 488 nm. Cellular responses were normalized to their respective baseline and maximum sensor response following the addition of 1 mM H2O2. Values are presented as mean ± standard error, n=3, where n consists of an average of 5 – 10 independent cells. Please click here to view a larger version of this figure.
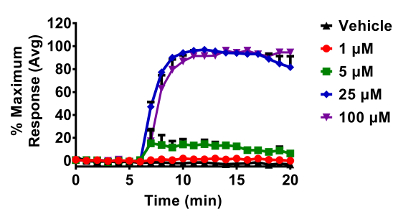
Figure 4. Response of glucose starved BEAS-2B cells expressing roGFP2 to various doses of H2O2. Cells were equilibrated for 2 hours in a minimal salt medium that does not contain glucose prior to exposures. All additions of H2O2 occurred after a baseline period of 5 min. roGFP2 fluorescence emitted at 510 nm was collected using a 525/30 nm band pass filter following laser excitation at 404 and 488 nm. Cellular responses were normalized to their respective baseline and maximum sensor response following the addition of 1 mM H2O2. Values are presented as the mean ± standard error, n = 3, where n consists of an average of 5 – 10 distinct cells. Please click here to view a larger version of this figure.
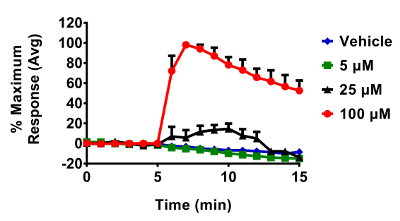
Figure 5. Response of BEAS-2B cells expressing HyPer to various doses of H2O2. Cells were equilibrated for 30 min in phenol-red free KBM prior to exposures. All additions of H2O2 occurred after a baseline period of 5 min. Fluorescence emitted at 510 nm was collected using a 525/30 nm band pass filter following laser excitation at 404 and 488 nm. Cellular responses were normalized to their respective baseline and maximum sensor response following the addition of 1 mM H2O2. Values are presented as the mean ± standard error, n = 3, where n consists of an average of 5 – 10 distinct cells. Please click here to view a larger version of this figure.
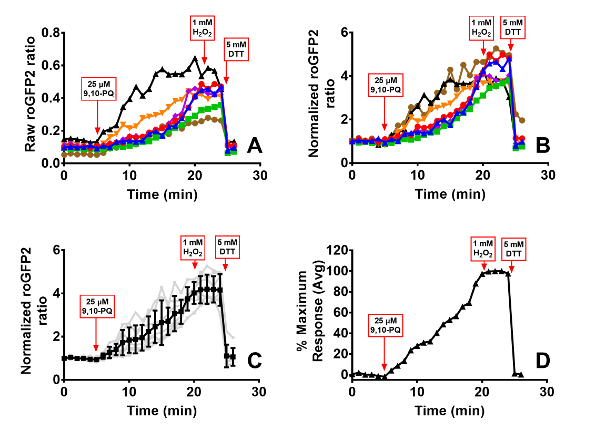
Figure 6. 9,10-PQ-induced responses of BEAS-2B cells expressing roGFP2. Cells were equilibrated for 30 min in phenol-red free KBM prior to exposure. Addition of 25 µM 9,10-PQ with mixing occurred at 5 min, followed by addition of 1 mM H2O2 at 20 min and 5 mM DTT at 24 min. Panel A depicts the raw roGFP2 ratio of individual cells in the dish, each cell represented by a separate line. Panel B shows normalization of values from each individual cell to its baseline sensor fluorescence, and the average and standard deviation of this data is superimposed on the individual normalized ratios in Panel C. The percentage of maximal sensor response averaged across all cells is depicted in Panel D. Please click here to view a larger version of this figure.
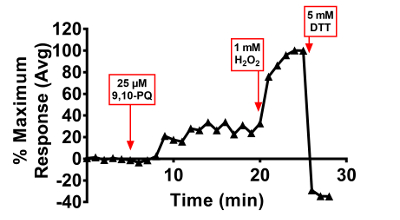
Figure 7. 9,10-PQ-induced responses of BEAS-2B cells expressing HyPer. Cells were equilibrated for 30 min in phenol-red free KBM prior to exposure. Addition of 25 µM 9,10-PQ with mixing occurred at 5 min, followed by addition of 1 mM H2O2 at 20 min and 5 mM DTT at 25 min. Fluorescence emitted at 510 nm was collected using a 525/30 nm band pass filter following laser excitation at 404 and 488 nm. Cellular responses were normalized to their respective baseline and maximum sensor response following the addition of 1 mM H2O2. Values are presented as the mean of 5 – 10 distinct cells. Please click here to view a larger version of this figure.
