Assessment of Resistance to Tyrosine Kinase Inhibitors by an Interrogation of Signal Transduction Pathways by Antibody Arrays
Summary
Here, we present a protocol for antibody arrays to identify alterations in signaling pathways in various cellular models. These changes, caused by drugs/hypoxia/ultra-violet light/radiation, or by overexpression/downregulation/knockouts, are important for various disease models and can indicate whether a therapy will be effective or can identify mechanisms of drugs resistance.
Abstract
Cancer patients with an aberrant regulation of the protein phosphorylation networks are often treated with the tyrosine kinase inhibitors. Response rates approaching 85% are common. Unfortunately, patients often become refractory to the treatment by altering their signal transduction pathways. An implementation of the expression profiling with microarrays can identify the overall mRNA-level changes, and proteomics can identify the overall changes in protein levels or can identify the proteins involved, but the activity of the signal transduction pathways can only be established by interrogating post-translational modifications of the proteins. As a result, the ability to identify whether a drug treatment is successful or whether resistance arose, or the ability to characterize any alterations in the signaling pathways, is an important clinical challenge. Here, we provide a detailed explanation of antibody arrays as a tool which can identify system-wide alterations in various post-translational modifications (e.g., phosphorylation). One of the advantages of using antibody arrays includes their accessibility (an array does not require either an expert in proteomics or costly equipment) and speed. The availability of arrays targeting a combination of post-translational modifications is the primary limitation. In addition, unbiased approaches (phosphoproteomics) may be more suitable for the novel discovery, whereas antibody arrays are ideal for the most widely characterized targets.
Introduction
The clinical implementation of the targeted tyrosine kinase inhibitors (TKI) has transformed cancer treatment by providing physicians with effective tools to target the specific proteins that drive neoplastic transformation. These compounds inhibit or block the phosphorylation of proteins targeted by tyrosine kinases1,2. TKIs were developed in part because genetic alterations in various key signaling genes are sufficient to drive cancer initiation and progression [e.g.,epidermal growth factor receptor (EGFR), proto-oncogene tyrosine-protein kinase Src (SRC), BCR-ABL, and human epidermal growth factor receptor 2 (HER2)]3,4. The impact of TKIs on the cell cycle5 and the molecular signaling pathways6 represents a transformation from the untargeted to the molecularly guided cancer treatment. The key advantage of TKIs versus chemotherapy is the increased response rates and the lower risk of toxicity to healthy cells7. As a result, there has been increasing attention on the research and development of novel TKIs.
Access to the genomic sequencing results started with the Human Genome Project8,9,10 and continues today with various next-generation (NextGen) cancer sequencing efforts [e.g., The Cancer Genome Atlas (TCGA)11,12]. This has inspired many experimental methodologies that provide simultaneous information on thousands of genes and/or provide unbiased snapshots of genes or proteins modulated by biological perturbations13. Since the regulation of the cellular function occurs at multiple levels, from the transcription of genes to the post-translational modification of proteins and their activity, a complete understanding of the events controlling the cellular function will ultimately require an integration of data from various biological readouts. The ability to monitor the messenger RNA (mRNA) levels of thousands of genes with a single-cell gene resolution has increased the ability to make inferences about the gene function and interactions on a whole-genome scale. However, the interpretation of gene expression arrays will always be inherently incomplete without the integration of other levels of regulation: namely, the protein expression levels, the protein modification states, and the protein post-translational modifications (phosphorylation, ubiquitylation, methylation, etc.). Here, we describe the utility of antibody arrays as means to interrogate post-translational modifications of important signaling components as a function of various conditions in a single experiment14,15,16.
Phospho-antibody arrays can be employed to distinguish and analyze changes in the signal transduction pathways16. These can arise from a genetic modification or treatments of cell lines with kinase inhibitors, chemotherapeutics, stress caused by glucose deprivation, hypoxia, or serum starvation. Of note, drug resistance or a specific gene up- or downregulation can also cause changes in the signal transduction pathways17.
Drug resistance, for example, can arise from mutations of the drug target to avoid sensitivity. In lung cancer, known EGFR mutations render the cancer insusceptible to certain TKIs, but more susceptible to others. Alternative signaling pathways can be activated upon mutation17. As a broader application for the identification of the signal transduction pathways involved in resistance and hypoxia, etc., phospho-antibody arrays provide more insight into, and consequently understanding of, the mechanisms involved.
Technologies that permit an assessment of protein modifications represent an important component of systems biology because they often serve a regulatory function, such as modulating the activity of an enzyme or the physical interactions between proteins. The importance of post-translational modifications is illustrated by the role of protein phosphorylation in nearly all extracellular-triggered signal transduction pathways18. Traditionally, the identification of kinases or of the phosphorylation status of proteins could also be determined by Western blot analysis, especially if the researcher is interested in only 1–5 targets. However, Western blots are very selective and can be biased toward prior knowledge and might miss important targets as a result. Antibody array(s) provide a medium-throughput readout of multiple targets by embedding various capture antibodies [pan-specific phosphorylated tyrosine(s), anti-ubiquitin, etc.] on a solid matrix (e.g., glass or nitrocellulose). Secondary antibodies provide information on specific proteins in a sandwich-based ELISA format (Figure 1). This assay becomes more powerful and pertinent as more targets are of interest or the prior knowledge is restricted15. The phospho-arrays are more broadly employable as they can compare phosphorylation as well as general amounts of protein of a wider variety of targets in one experiment and provide a significantly improved quantification over mass spectrometry. This technique is not applicable for the identification of new or previously unknown phosphorylation sites.
Large-scale mass spectrometry-based proteomics could be employed to identify specific phosphorylation sites of proteins19. Although this technique can enumerate thousands of post-translational events, it requires expensive instrumentation, dedicated experimental pipelines, and a computational expertise that are beyond the reach of most researchers.
Antibody arrays provide a simultaneous readout on various protein readouts16. These may be changes in protein ubiquitylation (ubiquitin array) or phosphorylation. The key advantage of this array technology is that it provides important feedback on the biological state of various biological pathways associated with important cell parameters (protein of 53 kDa, p53, receptor tyrosine kinases, and intracellular pathways) simultaneously. In addition, it is possible to combine various array types to increase the penetration of an assay (e.g., apoptosis and ubiquitin and phosphorylation). This ability to combine multiple arrays to assess various post-translational alterations in several samples simultaneously in a time- and cost-effective manner that does not require specific instrumentation or expertise is of a significant advantage in the case of antibody arrays.
Protocol
1. Protein Extraction
- Plate 5 x 10⁶ cells on a 10 mm tissue culture plate (or flask) in a tissue culture hood. Count the cells at the time of plating with an automatic cell counter or hemocytometer. Alternatively, estimate the cell count.
- Rinse the cells grown on the 10 mm plate (or flask) thoroughly 3x with 10 mL of phosphate-buffered saline (PBS) (pH = 7.4). Make sure to remove all PBS before adding the lysis buffer.
NOTE: The lysis buffer is usually provided with the kit. If not, then use a radioimmunoprecipitation assay buffer (RIPA) or any other cell lysis buffer containing a cocktail of protease and phosphatase inhibitors. - Lyse 1 x 10⁷ cells/mL of cells in the lysis buffer by adding the correct amount of buffer to the cells and scraping the cells with a cell scraper into the lysis buffer. (e.g., for HeLa cells and MiaPaCa-2, use 600 µL per 10 cm plate).
- Pipette the lysate up and down (approximately 10x) and transfer it to a new 1.5 mL tube.
- Incubate the lysates for 30 min at 4 °C, preferably on a rocker/shaker. Press the lysate through a syringe with a 27 G needle for 10x to ensure a proper disruption of the cell membrane(s). Alternatively, sonicate the lysate. Store the lysates at -20 °C or use them immediately.
- Centrifuge the lysate at 14,000 x g at 4 °C for 15 min and transfer the supernatant to a clean 1.5 mL tube.
- Quantitate the amount of total protein by bicinchoninic acid assay (BCA)20 or an equivalent such as Lowry or Bradford and continue with at least 50–400 μg. Use the proteins immediately or aliquot and freeze/store them at -70 °C (avoid multiple freeze-thaw cycles).
2. Human Phosphokinase Array
- Bring all reagents to room temperature before starting (for approximately 1 h).
NOTE: All reagents and plastic wear are included in the kit. - Prepare all the reagents fresh (array buffers) before starting the procedure following the manufacturer's instructions (depending on the choice of targets/arrays, the instructions might vary slightly).
- Reconstitute the detection antibody cocktails in 100 μL of deionized water or follow the manufacturer's instructions should they differ for the 1.5 mL test tube provided.
- Prepare 1x wash buffer by diluting 40 mL of 25x wash buffer in 960 mL of deionized water and mix them by inverting.
NOTE: Crystals dissolve at room temperature. The buffer may turn yellow over time but will still work. - Pipette 1 mL of array buffer 1 into each well of an 8-well multi-tray (or 2 mL in a 4-well multi-tray).
- With flat-tip tweezers, remove the array membranes between the protective sheets and place them into the wells. Make sure the numbers on the membrane are facing upwards.
NOTE: Upon submersion, the dye on the membrane will disappear. - Cover the tray with a lid and incubate it on a rocking platform shaker for 60 min at room temperature.
NOTE: This is the membrane blocking step. - During the incubation period, prepare the protein samples. Add 50–100 μg of total protein. Dilute the lysate, having a maximum volume of 334 μL, with lysis buffer to a final volume of 1 mL.
NOTE: 50–100 μg of total protein usually suffices. - Aspirate array buffer 1 carefully and incubate the membranes with 1 mL of the samples overnight at 2–8 °C on a rocking platform shaker.
NOTE: Do not touch/scratch the membranes. - The next day, wash the array by carefully removing each array and placing it into individual plastic containers (approximately 8 x 11 cm2) with 20 mL of 1x wash buffer. Wash the membranes 3 x 10 min on a rocking platform in 1x washing buffer at room temperature.
- Pipette 20 μL of the reconstituted antibody cocktail from step 2.3 to 1 mL of 1x array buffer 2. Add 1 mL of this solution to each 8-well to be used.
- Carefully remove the membranes from the wash trays. Blot the lower edge onto the paper towels to remove any excess wash buffer and transfer them back into the tray containing the antibody cocktails. Cover the tray with the lid and incubate it for 2 h at room temperature on a rocking platform. Thoroughly rinse the used trays with dH2O and dry them for later usage.
- Carefully remove each array and place them back into the clean individual plastic containers (approximately 8 x 11 cm2) with 20 mL of 1x wash buffer. Wash them 3 x 10 min with the wash buffer on a rocking platform at room temperature.
- Dilute Streptavidin-HRP (provided with the kit) or streptavidin-fluorescent dye (for a more quantitative detection) 1:1,000 in 1x array buffer 2 in a 15 mL test tube.
- Return the membranes into the 8-well dishes containing the HP solution and incubate them for 30 min at room temperature on a rocking platform (if using fluorescence, wrap the tray in aluminum foil to avoid any light exposure).
- Remove the excess buffer by placing the membrane in between 2 pieces of 5 mm of 3 M paper. For imaging with an X-ray film/chemiluminescent imager, incubate the dried membranes with an HRP detection solution (mix the two chemiluminescent solutions 1:1) for 3 min and place the membrane into a clear plastic sheet protector.
NOTE: Dried membrane(s) may also be placed in a fluorescent imager to detect the fluorescent signal; minimize the light exposure to the membrane before imaging. For a quantification of the X-ray film or imager files, avoid overexposure. Most chemiluminescent/fluorescent imagers have a function to avoid a saturation of the signal.
3. Data Analysis
- Download ImageJ, an image processing program21, and install the software.
- Open ImageJ by double-clicking on the 'ImageJ icon'. Select the image to be analyzed by clicking 'File' in the menu bar, then select 'Open' from the drop-down menu and browse the computer files for the image of interest. Click the file to open it.
- Invert the picture for the analysis (black spots on the white background to white spots on a black background) by clicking 'Edit' in the menu bar and selecting 'Invert' from the drop-down menu.
- Select the 'oval icon' from the toolbar (the second option in the ImageJ toolbar). Draw a circle/oval by clicking on the picture (black cross) and moving the mouse. Adjust the size/shape of the circle/oval to encircle the dots on the dot blot.
- Click 'Analyze' in the menu bar and then select 'Measure' from the drop-down menu to automatically open a new window with the values of the selected area (area, mean, minimum, and maximum).
- Move the circular area by dragging the circle from the center (put the point of the arrow right in the middle) and place it around the next measurement (dot) area. Measure all spots of interest, the positive control, the negative control, and the background for the analysis.
NOTE: The negative control is the PBS, the background is a part of the membrane without any spot (any part will do), and the positive control is a control provided by the manufacturer. - Select the PBS negative control spots and subtract the value from each spot. Average the intensity for each pair of duplicate spots representing each receptor tyrosine kinase (RTK). Each average intensity can be related to the control to calculate the fold change.
Representative Results
To investigate the effect of TKI resistance on signal transduction pathways in cell lines, four samples were analyzed. One control sample (H3255r1) and 3 TKI-resistant cell lines (H3255r2-4) (Figure 2) were related to the spot antibody template (Figure 3). All 4 samples were prepared using this protocol. Six phosphoproteins with differential activity were chosen for the demonstration of the analysis of the antibody arrays (Figure 4). The heat map (Figure 5) provides a semi-quantitative readout on the changes in the protein phosphorylation of important signal transduction proteins. The validation of the array results can be completed by implementing orthogonal approaches, such as Western blotting.
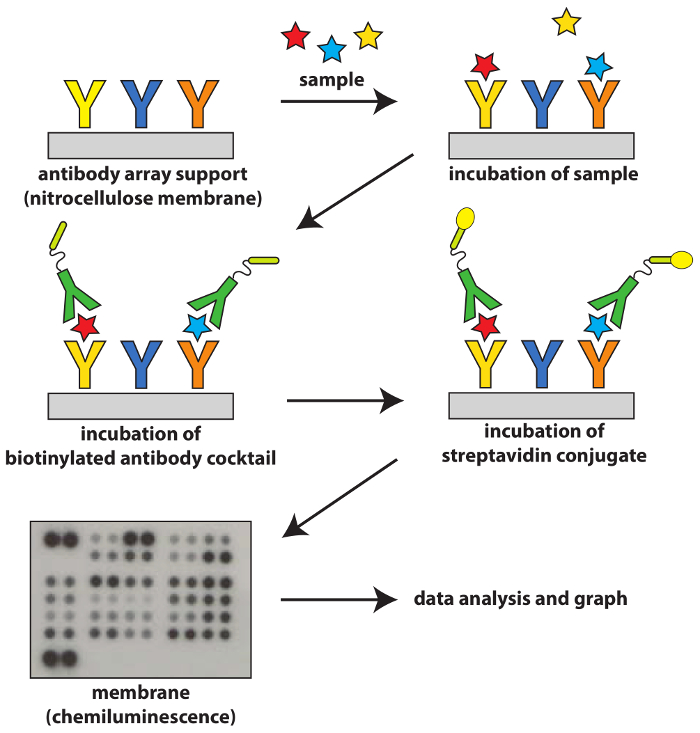
Figure 1: Schematic of semi-quantitative antibody arrays. The antibody arrays are based on the sandwich immunoassay principle, where a collection of capture antibodies is embedded in either the glass or the nitrocellulose support. The cell lysates are incubated with the membrane and the arrays are subjected to secondary antibodies. A semi-quantitative readout may be obtained from chemiluminescent substrates or, for more quantitative information, fluorescent-based imaging. Any signals derived from film or TIF images may be processed by densitometry and a calculation of the fold-changes for each protein. The entire process takes about day. Please click here to view a larger version of this figure.
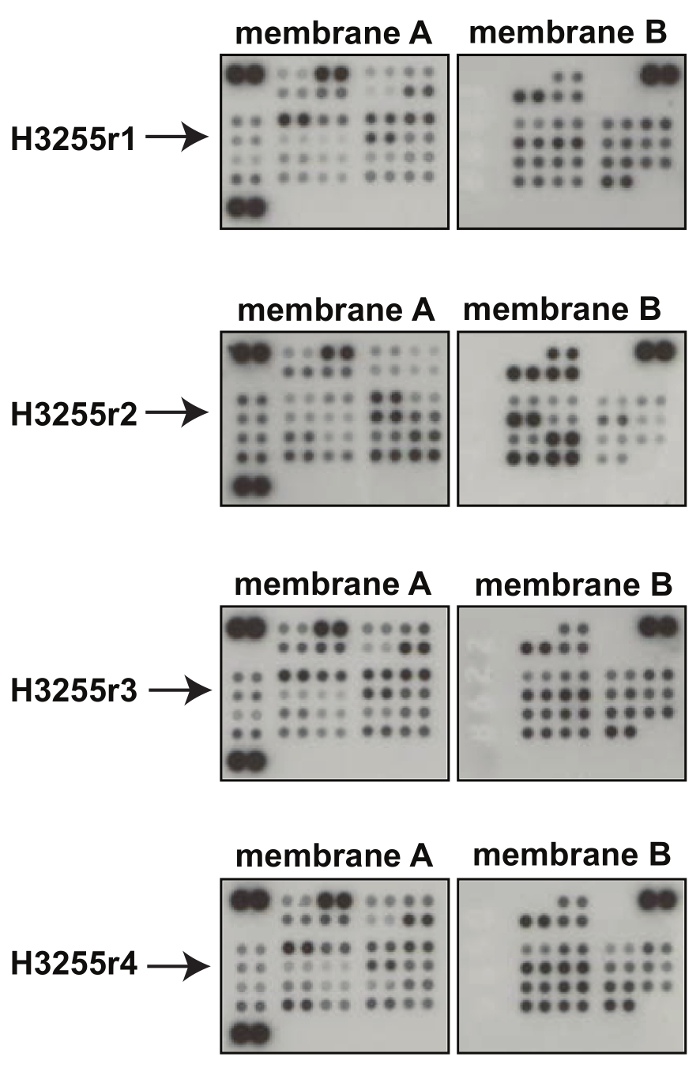
Figure 2: Example phospho-antibody array developed with the imager. The fluorescent spots are detected in duplicate (two spots per target). The samples and positive control spots show varying intensities. Shown here is the comparison of the TKI-sensitive H3255r1 and 3 resistant (H3255r2-4) sample arrays, each split in membrane A and B. Please click here to view a larger version of this figure.
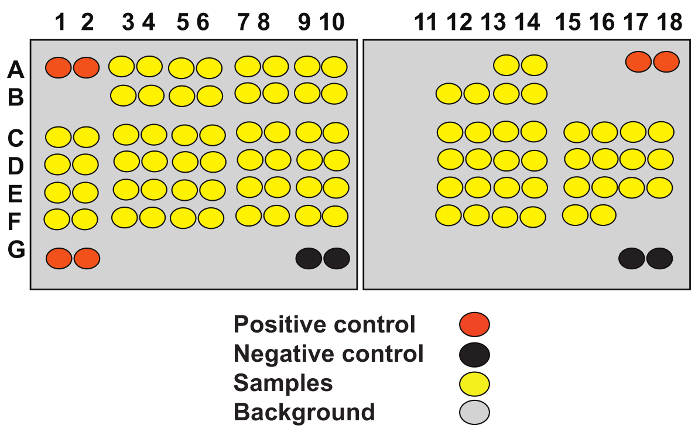
Figure 3: Map of the array spots. The map links the spots to the antibody targets. The spots are labeled A – G vertically and 1 – 10 horizontally. The positive control (orange) is present on all membranes and usually found in the corners. The negative PBS control is highlighted in black while the sample spots are highlighted in yellow. For every array, a list of antibodies is also provided for identification. Please click here to view a larger version of this figure.
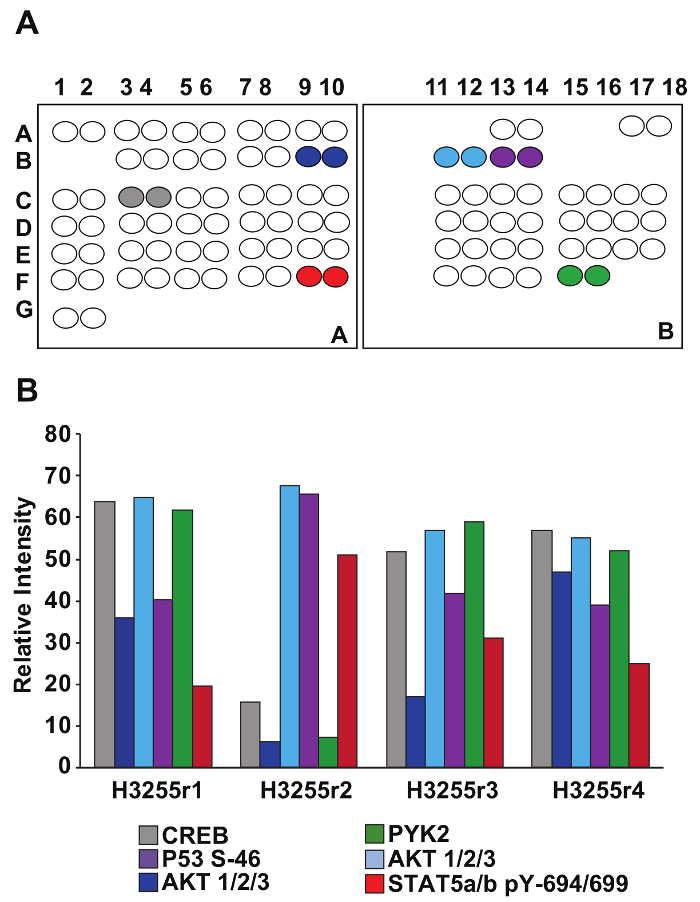
Figure 4: Data analysis example. (A) The intensity of the spots of interest, the positive control, and the background were identified on the map and measured for all samples. (B) The relative intensity (the spot intensity with the background intensity removed and normalized to a positive control intensity) is displayed in a bar chart for a few chosen candidates. Please click here to view a larger version of this figure.
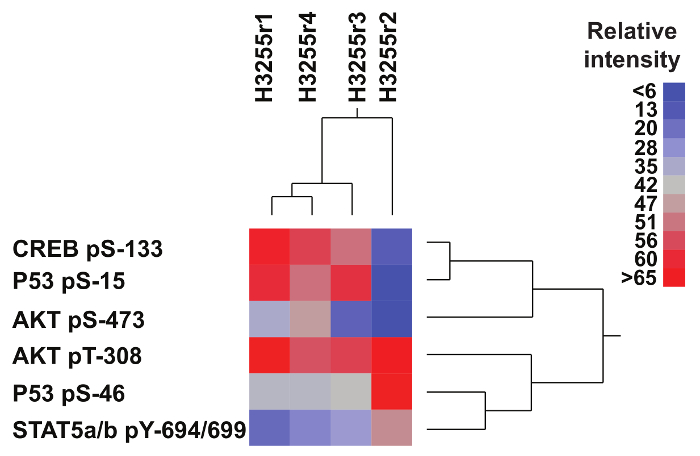
Figure 5: Heat map of differential signaling in H3255 sensitive (r1) and resistant (r2-4) cell lines. A relative spot intensity was used to generate a heat map for a comparison of changes in CREB, P53, AKT, and STAT5 in all 4 samples. Any high levels are displayed in various shades of red while any lower levels are displayed in blue22. Please click here to view a larger version of this figure.
Discussion
Approaches that combine many biological readouts are inherently more accurate representations of the cellular machinery in an experiment performed. The advent of phospho-antibody arrays enables a rapid characterization of the pattern of modifications which may be more informative than the modification status of any single protein. The general workflow for the application of phospho-antibody arrays is based on a modification in serine, threonine, or tyrosine. This example focused on characterizing the changes associated with the resistance to therapy in lung cancer. The main rationale for this application is that protein phosphorylation plays a central role in the signal transduction in many human cancers18, and this method will be transferable to other systems. A dysregulation of phosphorylation in cancer usually involves the hyperactivation of a tyrosine kinase, and consequently, the phosphorylated substrates (often including the auto-phosphorylated kinase itself) are present at levels higher than in the normal physiological settings and, accordingly, can make up a significant fraction of the phosphoproteins in a cancer cell. These higher levels of phosphorylation will make detection easier. Moreover, protein phosphorylation has a medical significance since aberrant tyrosine phosphorylation is a hallmark of many types of cancer23. In addition, since this technique is transferable to the investigation of other biological systems that utilize phosphorylation, many of the features described here could easily be adjusted to focus on other types of protein arrays (ubiquitin, apoptosis, etc.).
Phospho-antibody arrays are widely used for the identification of any signal pathways involved, either as an exploratory method or as verification of one particular pathway. Various companies make kits for both the phosphorylation status and for the overall levels of proteins. While the real-time polymerase chain reaction (PCR) analysis or microarrays are much more quantitative, they take only mRNA levels into consideration, and a translation as well as post-translational modifications cannot be addressed. Apart from phosphorylation, other post-translational modifications such as glycosylation or ubiquitylation can also be addressed by arrays24,25.
One of the important factors to consider before starting antibody arrays is to start with healthy and actively dividing cells. Hypoxia, oxidative stress, and inflammation may produce changes in the signal transduction pathways26 that can skew the results and render a misinterpretation if treated improperly. This stress can be attributed to the formulation of media or to plating too little or too many cells, or to exposing the cells to poorly regulated environments, or to treating the control versus the sample(s) slightly differently. We have also noted large differences in the passage number or the time in the culture post-thawing. The key to avoiding these artificially introduced variables is to keep everything between the samples as consistent as possible. Do not change the FBS percentage or the media volume, etc., during the experiment.
The data analysis should also be considered before starting an array experiment. A chemiluminescent array analysis is only semi-quantitative, and its dynamic range is approximately one order of magnitude, while a fluorescent approach increases the dynamic range to approximately two orders of magnitude. The scale on which arrays are performed depends on the specific biological question(s). It is possible to analyze one specific resistant cell line of interest for all changes in the post-translational modifications compared to the original cell line or to focus on one particular pathway for a wide variety of resistant cell lines. The scalability of this approach should be considered at the early planning stages. Furthermore, the results of an antibody array should always be confirmed by a secondary method on fresh samples and/or the same lysates. A western blot analysis can be employed to verify the changes to specific targets.
Declarações
The authors have nothing to disclose.
Acknowledgements
We are grateful for the generous financial support of the Lawrence J. Ellison Institute of Transformative Medicine of USC (a gift to David Agus). We appreciate the support of Autumn Beemer and Lisa Flashner which lead to the generation and publication of this manuscript. We thank Laura Ng for her administrative support.
Materials
| Odysee SA Imager | Li-Cor Biosciences | Fluorescent Imager | |
| 1.5 ml tube | Eppendorf | 22363212 | |
| Cell Scraper | Falkon (Corning) | 353085 | |
| Dulbeco's Phosphate buffered Saline (PBS) | Corning | 21-031-CV | wash buffer for protein extraction |
| Tissue Culture dish 100mm | TRP | 93100 | |
| ICC Insulin syringe U100 | Becton Dickinson | 329412 | 27G5/8, 1ml for needle treatment of protein samples |
| Protein Profiler ARRAY | R&D | ARY003B | Human phospho MAPK array |
| Protein Profiler ARRAY | R&D | ARY002B | Human phospho kinase array |
| Centrifuge Eppendorf 5430R | Eppendorf | Table top centrifuge | |
| Pierce BCA protein assay kit | Thermo Fisher | 23225 | |
| SpectraMAX M2 | Molecular Devices | Absorbance reader for protein quantification | |
| IRDye 800CW Streptavidin | Li-Cor Biosciences | 925-32230 | Streptavidin conjugate for fluorescent detection |
| LabGard ES Class II, Type A2 biosafety cabinet | NuAire | NU-425-400 | Tissue culture hood |
| TC20 automated cell counter | Bio-Rad | 1450102 | Cell counter |
| Halt Protease & Phosphatase Inhibitor Cocktail (100X) | Thermo Fisher | 78446 | |
| RIPA buffer | Sigma | R0278 | |
| Sonic Dismembrator | Fisher Scientific | F60 | sonicator |
| Rocking platform shaker | VWR | 10860-780 | |
| ImageJ | NIH open source | https://imagej.net/Welcome | |
| SAS Institutie JMP® 12.1.0 (64-bit) | Microsoft |
Referências
- Knauer, D. J., Smith, G. L. Inhibition of biological activity of multiplication-stimulating activity by binding to its carrier protein. Proceedings of the National Academy of Sciences of the United States of America. 77 (12), 7252-7256 (1980).
- Glossmann, H., Presek, P., Eigenbrodt, E. Quercetin inhibits tyrosine phosphorylation by the cyclic nucleotide-independent, transforming protein kinase, pp60src. Naunyn-Schmiedebergs Archives of Pharmacology. 317 (1), 100-102 (1981).
- Di Fiore, P. P., et al. Overexpression of the human EGF receptor confers an EGF-dependent transformed phenotype to NIH 3T3 cells. Cell. 51 (6), 1063-1070 (1987).
- Maguire, H. C., Greene, M. I. The neu (c-erbB-2) oncogene. Seminars in Oncology. 16 (2), 148-155 (1989).
- Busse, D., et al. Reversible G(1) arrest induced by inhibition of the epidermal growth factor receptor tyrosine kinase requires up-regulation of p27(KIP1) independent of MAPK activity. Journal of Biological Chemistry. 275 (10), 6987-6995 (2000).
- Kondapaka, B. S., Reddy, K. B. Tyrosine kinase inhibitor as a novel signal transduction and antiproliferative agent: prostate cancer. Molecular and Cellular Endocrinology. 117 (1), 53-58 (1996).
- Cao, F., Zhang, L., Wang, S., Zhong, D., Wang, Y. [Effectiveness of EGFR-TKIs versus chemotherapy as first-line treatment for advanced non-small cell lung cancer: a meta-analysis]. Zhongguo Fei Ai Za Zhi. 18 (3), 146-154 (2015).
- Dulbecco, R. A turning point in cancer research: sequencing the human genome. Science. 231 (4742), 1055-1056 (1986).
- Barinaga, M. DoE provides funds for human genome sequencing. Nature. 331 (6152), 103 (1988).
- Lander, E. S., et al. Initial sequencing and analysis of the human genome. Nature. 409 (6822), 860-921 (2001).
- McCain, J. The cancer genome atlas: new weapon in old war?. Biotechnology Healthcare. 3 (2), 46-51 (2006).
- Weinstein, J. N., et al. The Cancer Genome Atlas Pan-Cancer analysis project. Nature Genetics. 45 (10), 1113-1120 (2013).
- Carlson, B. Next Generation Sequencing: The Next Iteration of Personalized Medicine: Next generation sequencing, along with expanding databases like The Cancer Genome Atlas, has the potential to aid rational drug discovery and streamline clinical trials. Biotechnology Healthcare. 9 (2), 21-25 (2012).
- Huang, R. P. Cytokine antibody arrays: a promising tool to identify molecular targets for drug discovery. Combinatorial Chemistry & High Throughput Screening. 6 (8), 769-775 (2003).
- Kopf, E., Zharhary, D. Antibody arrays–an emerging tool in cancer proteomics. International Journal of Biochemistry and Cell Biology. 39 (7-8), 1305-1317 (2007).
- Rani, S., O’Driscoll, L. Analysis of changes in phosphorylation of receptor tyrosine kinases: antibody arrays. Methods in Molecular Biology. 1233, 15-23 (2015).
- Kani, K., et al. JUN-Mediated Downregulation of EGFR Signaling Is Associated with Resistance to Gefitinib in EGFR-mutant NSCLC Cell Lines. Molecular Cancer Therapeutics. 16 (8), 1645-1657 (2017).
- Brivanlou, A. H., Darnell, J. E. Signal transduction and the control of gene expression. Science. 295 (5556), 813-818 (2002).
- Rikova, K., et al. Global survey of phosphotyrosine signaling identifies oncogenic kinases in lung cancer. Cell. 131 (6), 1190-1203 (2007).
- Chen, V. W., et al. Analysis of stage and clinical/prognostic factors for colon and rectal cancer from SEER registries: AJCC and collaborative stage data collection system. Cancer. 120, 3793-3806 (2014).
- Rueden, C. T., et al. ImageJ2: ImageJ for the next generation of scientific image data. BMC Bioinformatics. 18 (1), 529 (2017).
- Ward, J. H. Hierarchical Grouping to Optimize an Objective Function. Journal of the American Statistical Association. 58 (301), 236-244 (1963).
- Hanahan, D., Weinberg, R. A. Hallmarks of cancer: the next generation. Cell. 144 (5), 646-674 (2011).
- Griffin, J., et al. Array-based quantitative, automated analysis of protein glycosylation. Glycobiology. 14 (11), 1205-1206 (2004).
- Zhou, T., et al. Identification of ubiquitin target proteins using cell-based arrays. Journal of Proteome Research. 6 (11), 4397-4406 (2007).
- McGarry, T., Biniecka, M., Veale, D. J., Fearon, U. Hypoxia, oxidative stress and inflammation. Free Radical Biology and Medicine. , (2018).
