Summary

Modified Experimental Conditions for Noise-Induced Hearing Loss in Mice and Assessment of Hearing Function and Outer Hair Cell Damage

Published: February 10, 2023
doi:

Summary

Here, we present a protocol for a mouse model of noise-induced hearing loss (NIHL). To induce NIHL, we developed a new and simple device using corrugated plastic, a rat trap cage, and a speaker. Auditory brainstem response and immunofluorescence imaging were employed to assess the hearing function and outer hair cell damage, respectively.

Abstract

An animal model of noise-induced hearing loss (NIHL) is useful for pathologists, therapists, pharmacologists, and hearing researchers to thoroughly understand the mechanism of NIHL, and subsequently optimize the corresponding treatment strategies. This study aims to create an improved protocol for developing a mouse model of NIHL. Male C57BL/6J mice were used in this study. Unanesthetized mice were exposed to loud noises (1 and 6 kHz, presented simultaneously at 115-125 dB SPL-A) continuously for 6 h per day for 5 consecutive days. Auditory function was assessed 1 day and 1 week after noise exposure, using auditory brainstem response (ABR). After the ABR measurement, the mice were sacrificed, and their organs of Corti were collected for immunofluorescence staining. From the auditory brainstem response (ABR) measurements, significant hearing loss was observed 1 day after noise exposure. After 1 week, the hearing thresholds of the experimental mice decreased to ~80 dB SPL, which was still a significantly higher level than the control mice (~40 dB SPL). From the results of immunofluorescence imaging, outer hair cells (OHCs) were shown to be damaged. In summary, we created a model of NIHL using male C57BL/6J mice. A new and simple device for generating and delivering pure-tone noise was developed and then employed. Quantitative measurements of hearing thresholds and morphological confirmation of OHC damage both demonstrated that the applied noise successfully induced an expected hearing loss.

Introduction

About 1.3 billion people worldwide suffer from hearing loss due to noise exposure1. In this study, we aimed to establish a clear step-by-step process for inducing and confirming noise-induced hearing loss (NIHL). NIHL results from a degeneration/destruction of the hair cells (HCs) and spiral ganglion neurons (SGNs), damage in the HC stereocilia, and/or loss of synapses between the cochlear inner HCs and SGNs. Such abnormalities may also cause tinnitus and impaired speech perception (especially in a complex acoustic environment) besides NIHL. Social, psychological, and cognitive functions may be sequentially affected by these physiological deficiencies2,3,4,5,6.

In NIHL-related preclinical studies based on mice, the most popular mouse strains are CBA/CaJ2,3,6,7 and C57BL/64,5,8. The male3,4,7 mice, furthermore, are more commonly used than the female ones, as estrogen has a protective effect on hearing. Therefore, we only used male mice in this study9. After referring to the literature, we chose 1 kHz and 6 kHz as the frequencies of the applied noise. The intensity of the applied noise was 115 dB SPL-A (surrounding the cage) to 125 dB SPL-A (in the center of the cage). After exposing the experimental mice to the noise continuously for 6 h per day, for 5 consecutive days, an optimum increase in hearing threshold indicated an optimum extent of NIHL was generated in the experimental mice. The operations for handling the animals, building the experimental setup, and inducing noise are all clearly described step-by-step in the provided protocol.

Protocol

Animal experiments in this study were approved by the Animal Care Committee of Mackay Medical College. Eight-week-old Male C57BL/6J mice were purchased from the National Laboratory Animal Center (New Taipei City, Taiwan). All mice were bred and housed in accordance with the standard animal protocol.

1. Induction of NIHL in mice

  1. Prepare the cage for the experimental mice
    1. To do so, use a rat trap cage with dimensions of 14 cm × 17 cm × 24 cm. Cut four pieces of corrugated plastic boards into appropriate sizes, making them fit into the cage (13 cm × 23 cm and 13 cm × 16 cm).
    2. To prevent the mice from getting their feet cut by the mesh grid, place two of the pieces at the bottom and on the back side, respectively. Place the other two pieces perpendicularly interlocked with each other, to divide the space within the cage into quarters.
  2. Carry out this study in a soundproof box. Place a speaker 8.5 cm in front of the cage, and place both the speaker and the cage in a soundproof box.
  3. Open the CLIO application software
  4. Move the cursor to the speaker icon, then click on TwoSin. Enter and change the value of Freq 1 para 1000 Hz, Freq 2 para 6000 Hz, and click on OK to start playing the sound.
  5. Under the Leq tab, change dBV to dBSPL. After setting the time on the software interface, click the green triangle button to play the sound.
  6. Place a microphone in front of the speaker at a distance of 8.5 cm to calibrate the noise level (see Supplementary File 1). Adjust the noise level to 125 dB SPL-A and continuously monitor for no less than 3 min to ensure that the noise level is sufficiently stable. Use a generator, an analyzer, and an amplifier to create and control the noise. (Figure 1)
    NOTE: Do this step in a soundproof box to avoid damage to the operator's hearing.
  7. Place four male C57BL/6J mice into the cage (one for each quarter) for noise exposure. Randomly assign the mice in each quarter during the noise exposure. Place a microphone onto the top of the cage to monitor the noise level during the noise exposure (Figure 2).
    NOTE: Do this step in a soundproof box to avoid damage to the operator's hearing.
  8. Expose the mice to the noise at frequencies of 1 kHz and 6 kHz continuously for 6 h per day, for 5 consecutive days.
  9. Measure the hearing thresholds of the mice 1 day after the noise exposure (i.e., on the 6th day) by measuring the ABR. Repeat these ABR measurements again 1 week after the noise exposure (i.e., on the 13th day). After the ABR measurements, sacrifice all the involved mice and harvest their cochleae (Figure 3).

2. Auditory brainstem response (ABR)-based assessment of hearing threshold

  1. Use a commercial ABR testing system specifically designed for small animals10.
  2. Intraperitoneally inject a mixture of tiletamine and zolazepam (40 mg/kg) and xylazine (9.3 mg/kg) into the mice for general anesthesia.
    NOTE: ABR assessment takes ~2 h. Make sure to provide thermal support via a heating pad and apply eye ointment to prevent dryness while the mouse is under anesthesia.
  3. Measure the ABR in the mouse under general anesthesia. Place subdermal needle electrodes (12 mm) at the vertex, behind the pinna of the left ear, and back near the tail to measure the hearing threshold.
  4. Present acoustic stimuli using a speaker placed 1 cm from the animal's left ear.
  5. Use an oscilloscope to control the acoustic stimuli. Choose Sine Wave for the stimuli and 10 k for the window scale. Turn the Frequency knob to obtain the desired frequency of the acoustic stimuli.
  6. Adjust the stimulus intensity by turning the AMLP knob on the function generator. Obtain the desired stimulus intensity by turning the AMLP knob to a suitable voltage, calculated from calibration.
  7. Collect the ABR measurements under a series of stimulus intensities, from 10 dB SPL to 100 dB SPL, with a 10 dB step size.
    NOTE: Measure the hearing threshold in a soundproof box. The minimum stimulus intensity level that could give rise to a discernable Wave V in the collected signal was assumed to be the ABR threshold10,11 (Figure 4). Post-ABR assessment, monitor the animal until it recovers from anesthesia (~1 h).

3. Microscopic examination

  1. Fixing the harvested tissue
    1. After the ABR measurements, sacrifice the mouse by intraperitoneally injecting a mixture of tiletamine and zolazepam (100 mg/kg) and xylazine (23.25 mg/kg) for the microscopic examination.
    2. Harvest the cochleae from the mouse and immediately immerse them in 10% formaldehyde (FA) for fixation (two cochlea/mL) for at least 8 h at 4 °C.
    3. Following fixation, replace the FA solution with a 10% ethylenediaminetetraacetic acid (EDTA) solution for decalcification for 3-4 days at 4 °C. Then, check each cochlea with tweezers to confirm that the cochleae are sufficiently softened.
    4. Place the cochleae in a Petri dish filled with phosphate-buffered saline (PBS), and cut the spiral-shaped organ of Corti (OC) (each decalcified cochlea) into three sections-the basal turn, middle turn, and apical turn-for tissue staining.
    5. Under a dissecting microscope (magnification: 8x-35x), remove the bony structures (scala vestibuli, scala tympani, and modiolus) of the decalcified cochleae and obtain the soft tissue, including the OC (thickness: about 40 µm).
  2. Cochlea immunofluorescence staining
    1. Preparation of the blocking buffer: Prepare 2% bovine serum albumin (BSA) and 0.2% Triton X-100 solutions in PBS.
    2. Transfer the tissue to be stained from the Petri dish to a microcentrifuge tube, and immerse the tissue in 0.1 mL of the blocking buffer for 2 h at room temperature (RT).
    3. Preparation of the Myo7A primary antibody buffer: Dilute the Myo7A primary antibody in the blocking buffer at a volume ratio of 1:200.
    4. Treat the tissue in the microcentrifuge tube with 100 µL of Myo7A primary antibody buffer for 2 h at RT.
    5. Rinse the tissue three times in PBS for 5 min each.
    6. Preparation of the Myo7A secondary antibody (Myo7A-Rb-488) and phalloidin antibody (phalloidin-594) buffer: Dilute Myo7A secondary antibody (1:400) and phalloidin antibody (1:200) in the blocking buffer.
    7. Treat the tissue with 100 µL of Myo7A secondary antibody and phalloidin antibody buffer for 2 h at RT.
    8. After antibody + phalloidin antibody treatment, rinse the tissue in PBS three times, for 5 min each.
    9. Transfer the rinsed tissue from the microcentrifuge tube to a Petri dish filled with PBS using a 1 mL plastic transfer pipette with a cut tip.
    10. To prepare for the microscopic examination, unfold the tissue, place it onto a glass slide, and add 15 µL of 4',6-diamidino-2-phenylindole (DAPI) fluoromount medium onto the tissue to fully cover it. Place a glass coverslip gently over the tissue. Leave the slide overnight at RT before sealing it with nail polish.
  3. Image acquisition
    1. Acquire 2D images using an upright fluorescence microscope and image acquisition software.
    2. Before performing the microscopic examination, center the tissue in the field of view and adjust the sensitivity to ISO 100. Adjust the exposure time initially by clicking on the Automatic Mode button of the software, and then fine-tune manually by clicking on the Adjust button to optimize the signal-to-noise ratio.
    3. Adjust the wavelength of the incident light to excite the fluorophores by rotating the fluorescence cube. Pseudo colors were used to mark the emission from different fluorescent labels (blue light: DAPI; green light: Myo7A; red light: phalloidin).
    4. By scanning the tissue sample, generate and collect the imaging data as .tif and .jpg image files.

Representative Results

A shift in ABR hearing threshold
The hearing threshold of the mice was measured using tone-burst ABR either 1 day or 1 week after the noise exposure. A significant increase in the hearing threshold at all three tested frequencies was observed (12 kHz: 84.29 ± 2.77 dB SPL; 24 kHz: 91.43 ± 0.92 dB SPL; 32 kHz: 98.57 ± 1.43 dB SPL) 1 day after the noise exposure (i.e., the 6th day). Partial hearing recovery occurred 1 week after the noise exposure (i.e., the 13th day), but the hearing thresholds were still elevated by more than 30 dB at all frequencies (12 kHz: 72.86 ± 2.86 dB SPL; 24 kHz: 84.29 ± 2.77 dB SPL; 32 kHz: 87.14 ± 4.21 dB SPL) compared to the control groups (12 kHz: 41 ± 0 dB SPL; 24 kHz: 51 ± 0 dB SPL; 32 kHz: 51 ± 0 dB SPL). In this study, the hearing was more damaged at high frequencies (Figure 5). A two-way ANOVA test was used for analysis, and Bonferroni correction was used for post-tests. A significant difference (p < 0.001) was observed between the control and experimental groups on both the 6th and 13th days. Comparison between the hearing thresholds measured on the 6th and 13th days showed a significant difference (p < 0.05) at the frequencies of 12 kHz and 32 kHz.

Outer hair cell loss
A loss of OHCs was consistently observed in the microscopic images acquired from the NIHL mice, compared to those from the control mice. By contrast, the inner hair cells were observed to be intact in all the images. In addition, the OHCs in the basal and middle turns of the organ of Corti were damaged more severely, while the OHCs in the apical turn were almost intact (Figure 6).

Figure 1
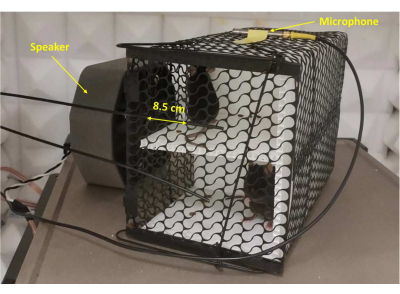
Figure 1: Noise exposure setup. A microphone was placed in front of the speaker at a distance of 8.5 cm to calibrate the noise level. The noise level was adjusted to 125 dB SPL-A, which is similar to the level of a nearby siren. Please click here to view a larger version of this figure.

Figure 2
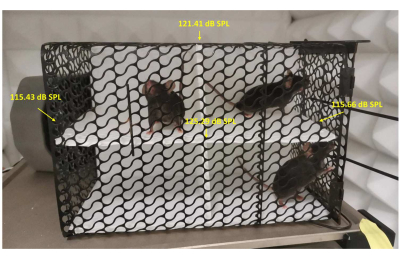
Figure 2: The rat trap cage adapted to this study. Three male C57BL/6J mice were randomly assigned to each quarter during the noise exposure. The microphone was stuck to the top of the cage to monitor noise levels during noise exposure. The sound pressure level was measured several times at multiple positions. These positions are marked in the figure. Please click here to view a larger version of this figure.

Figure 3
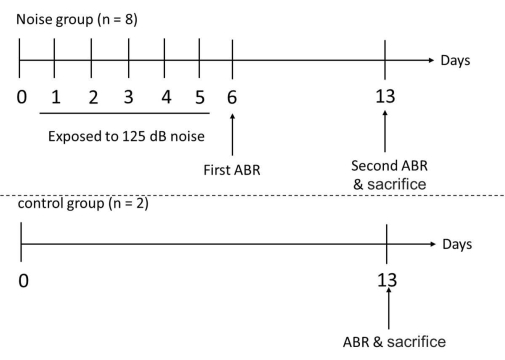
Figure 3: Experimental timeline for the test and control groups. The mice were exposed to the noise at the frequencies of 1 and 6 kHz continuously for 6 h per day, for 5 days. After 5 consecutive days of noise exposure, the hearing thresholds of the experimental mice were measured with ABR on the 6th day. The ABR measurement was performed in the experimental mice again and in the control mice on the 13th day, followed by the sacrifice of all the involved mice to harvest their cochleae. Please click here to view a larger version of this figure.

Figure 4
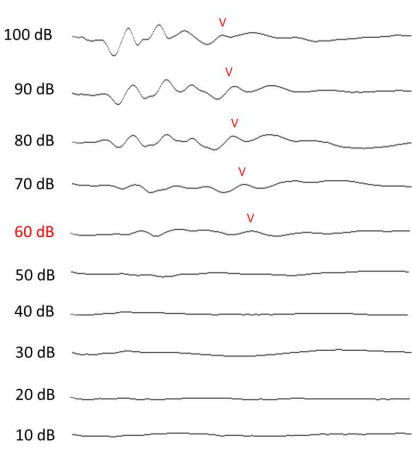
Figure 4: ABR measurement of hearing. Representative ABR results at 12 kHz, collected on the 13th day (1 week after the noise exposure). The Wave V at each intensity is labeled if discernable. Please click here to view a larger version of this figure.

Figure 5
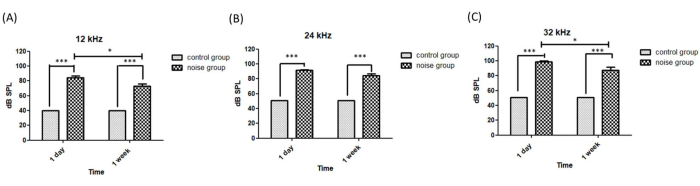
Figure 5: Hearing thresholds measured on the 6th and 13th days. The hearing threshold at frequencies of (A) 12 kHz, (B) 24 kHz, and (C) 32 kHz. A two-way ANOVA test was used for analysis, followed by Bonferroni correction. *p < 0.05, ***p < 0.001. Please click here to view a larger version of this figure.

Figure 6
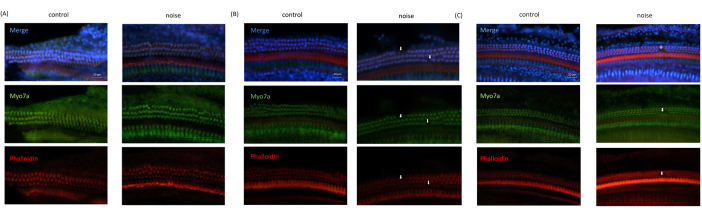
Figure 6: Immunofluorescence imaging results obtained from OC. (A) Image obtained from the apical turn of the cochlea. (B) Image obtained from the middle turn of the cochlea. (C) Image obtained from the base turn of the cochlea. Blue: cell nuclei stained with DAPI; Green: hair cells stained with Myo7A; Red: cytoskeleton stained with phalloidin. Arrows indicate the loss of OHCs. Scale bar= 20 µm. Please click here to view a larger version of this figure.

Supplementary file 1: Voltage calculation from calibration. For each specific frequency, the value of the selected voltage (horizontal axis) will be input into the calibration curve for obtaining the corresponding sound level (vertical axis).  Please click here to download this file.

Discussion

NIHL can be divided into two types: temporary NIHL, which shows a temporal shift of the hearing threshold, and permanent NIHL, which is featured by a permanent hearing-threshold shift. The hearing loss that we observed on the 6th day (1 day after the noise exposure) is believed to be a combination of these two types. In this case, the hearing threshold would show a gradual recovery over time owing to the temporal component of hearing loss. In our preliminary experimental studies, the results acquired with the same setup and animals, the hearing loss generated by 2 day noise exposure completely recovered in 2 weeks, indicating that permanent NIHL was not actually generated. On the contrary, in this study, the hearing loss generated by 5 day noise exposure is suggested to include a permanent component, as the hearing threshold was still significantly higher than the control level on the 13th day (1 week after the noise exposure).

One of the limitations of the current protocol is that we used the hearing threshold detected at 12 kHz to represent the low-frequency hearing threshold of the mice, which corresponds to the apical turn of the cochlea. Strictly speaking, the apical turn of the cochlea is more sensitive to sound at 4 kHz to 8 kHz12. However, this limitation hardly reduces the value of this study and protocol, as the presented protocol provides every detail of the operation steps and employs devices involved in the model creation. Most of the presented parameters, such as noise-exposure durations, noise frequencies, stimulus frequencies for ABR, and when to perform the ABR tests and animal sacrifice, can be altered and further optimized for different purposes in future studies.

Declarações

The authors have nothing to disclose.

Acknowledgements

We thank the grants from the Ministry of Science and Technology (MOST) of the Taiwan Government (MOST 110-2314-B-715-005, MOST 111-2314-B-715-009-MY3), and intramural research grants from Mackay Medical College (MMC-RD-110-1B-P030, MMC-RD-111-CF-G002-03).

Materials

 1/4" CCP Free-field Standard Microphone Set GRAS 428158 For noise exposure
Amplifier Input Module, AMI100D BIOPAC For auditory brainstem response
Bio-amplifier, BIO100C BIOPAC For auditory brainstem response
Bovine Serum Albumin SIGMA A9647 Immunofluorescence staining
Cellsens software Olympus life science Image acquisition
Corrugated plastic
DAPI fluoromount SouthernBiotech 0100-20 Immunofluorescence staining
Ethylenediaminetetraacetic acid SIGMA E5134 Decalcification
Evoked Response Amplifier, ERS100C BIOPAC For auditory brainstem response
Formaldehyde APLHA F030410 Fixation of cochlear
High Performance Data Acquisition System, MP160 BIOPAC For auditory brainstem response
Modular Extension Cable, MEC110C BIOPAC For auditory brainstem response
Myo7A primary antibody Proteus 25-6790 Immunofluorescence staining
Myo7A secondary antibody Jackson immunoresearch 711-545-152 Immunofluorescence staining
Needle Electrode, Unipolar 12 mmTp, EL452 BIOPAC For auditory brainstem response
phalloidin antibody Alexa Fluor A12381 Immunofluorescence staining
phosphate-buffered saline SIGMA P4417
Rat trap cage 14 cm x 17 cm x 24cm
ROMPUN- xylazine injection, solution  Bayer HealthCare, LLC
Sound amplifier, MT-1000 unika For noise exposure
Sound generator/analyzer/miscellaneous, FW-02 CLIO 620300719 For noise exposure
Soundproof chamber IEA Electro-Acoustic Technology For noise exposure and ABR
Speaker  IEA Electro-Acoustic Technology For noise exposure
Stimulator Module, STM100C BIOPAC For auditory brainstem response
Triton X-100 SIGMA T8787 Immunofluorescence staining
Tubephone Set, OUT101 BIOPAC For auditory brainstem response
Upright Microscope, BX53 Olympus Image acquisition
Zoletil Virbac

Referências

  1. World Report on Hearing. World Health Organization Available from: https://www.who.int/publications/i/item/9789240020481 (2021)
  2. Fernandez, K. A., et al. Noise-induced cochlear synaptopathy with and without sensory cell loss. Neurociência. 427, 43-57 (2020).
  3. Kujawa, S. G., Liberman, M. C. Adding insult to injury: cochlear nerve degeneration after "temporary" noise-induced hearing loss. The Journal of Neuroscience. 29 (45), 14077-14085 (2009).
  4. Wang, J., et al. Overexpression of X-linked inhibitor of apoptosis protein protects against noise-induced hearing loss in mice. Gene Therapy. 18 (6), 560-568 (2011).
  5. Takeda, S., Mannström, P., Dash-Wagh, S., Yoshida, T., Ulfendahl, M. Effects of aging and noise exposure on auditory brainstem responses and number of presynaptic ribbons in inner hair cells of C57BL/6J mice. Neurophysiology. 49 (5), 316-326 (2017).
  6. Rouse, S. L., Matthews, I. R., Li, J., Sherr, E. H., Chan, D. K. Integrated stress response inhibition provides sex-dependent protection against noise-induced cochlear synaptopathy. Scientific Reports. 10 (1), 18063 (2020).
  7. Amanipour, R. M., et al. Noise-induced hearing loss in mice: Effects of high and low levels of noise trauma in CBA mice. Annual International Conference of the IEEE Engineering in Medicine and Biology Society. 2018, 1210-1213 (2018).
  8. Edderkaoui, B., Sargsyan, L., Hetrick, A., Li, H. Deficiency of duffy antigen receptor for chemokines ameliorated cochlear damage from noise exposure. Frontiers in Molecular Neuroscience. 11, 173 (2018).
  9. Hultcrantz, M., Simonoska, R., Stenberg, A. E. Estrogen and hearing: a summary of recent investigations. Acta Oto-laryngologica. 126 (1), 10-14 (2006).
  10. Tsai, S. C. -. S., et al. The intravenous administration of skin-derived mesenchymal stem cells ameliorates hearing loss and preserves cochlear hair cells in cisplatin-injected mice: SMSCs ameliorate hearing loss and preserve outer hair cells in mice. Hearing Research. 413, 108254 (2022).
  11. Choi, M. Y., Yeo, S. W., Park, K. H. Hearing restoration in a deaf animal model with intravenous transplantation of mesenchymal stem cells derived from human umbilical cord blood. Biochemical and Biophysical Research Communications. 427 (3), 629-636 (2012).
  12. Yu, S. -. K., et al. Morphological and functional evaluation of ribbon synapses at specific frequency regions of the mouse cochlea. Journal of Visualized Experiments. (147), e59189 (2019).
check_url/pt/64286?article_type=t

Play Video

Citar este artigo
Lee, D., Pan, Y., Hsu, Y. Modified Experimental Conditions for Noise-Induced Hearing Loss in Mice and Assessment of Hearing Function and Outer Hair Cell Damage. J. Vis. Exp. (192), e64286, doi:10.3791/64286 (2023).

View Video