Here, we present a protocol for culturing IDG-SW3 cells in a three-dimensional (3D) extracellular matrix.
Osteocytes are considered to be nonproliferative cells that are terminally differentiated from osteoblasts. Osteoblasts embedded in the bone extracellular matrix (osteoid) express the Pdpn gene to form cellular dendrites and transform into preosteocytes. Later, preosteocytes express the Dmp1 gene to promote matrix mineralization and thereby transform into mature osteocytes.This process is called osteocytogenesis. IDG-SW3 is a well-known cell line for in vitro studies of osteocytogenesis. Many previous methods have used collagen I as the main or the only component of the culturing matrix. However, in addition to collagen I, the osteoid also contains a ground substance, which is an important component in promoting cellular growth, adhesion, and migration. In addition, the matrix substance is transparent, which increases the transparency of the collagen I-formed gel and, thus, aids the exploration of dendrite formation through imaging techniques. Thus, this paper details a protocol to establish a 3D gel using an extracellular matrix along with collagen I for IDG-SW3 survival. In this work, dendrite formation and gene expression were analyzed during osteocytogenesis. After 7 days of osteogenic culture, an extensive dendrite network was clearly observed under a fluorescence confocal microscope. Real-time PCR showed that the mRNA levels of Pdpn and Dmp1 continually increased for 3 weeks. At week 4, the stereomicroscope revealed an opaque gel filled with mineral particles, consistent with the X-ray fluorescence (XRF) assay. These results indicate that this culture matrix successfully facilitates the transition from osteoblasts to mature osteocytes.
Osteocytes are terminally differentiated cells derived from osteoblasts1,2. Once the osteoblast is buried by the osteoid, it undergoes osteocytogenesis and expresses the Pdpn gene to form preosteocytes, the Dmp1gene to mineralize the osteoid, and the Sost and Fgf23 genes to function as a mature osteocyte in bone tissue3. Here, a 3D culturing system is introduced to identify dendrite extension and marker gene expression in the osteocytogenesis process.
IDG-SW3 cells are an immortalized primary cell line derived from transgenic mice and can expand or replicate osteoblast to late osteocyte differentiation when cultured in different media4. Compared with MLO-A5, MLO-Y4, and other cell lines, the expression profile of functional proteins, the ability to perform calcium salt deposition, and the responses to various hormones in IDG-SW3 cells are more likely to be the same as those of primary osteocytes in the bone tissue4.
Compared to 2D systems, 3D culturing systems are more capable of mimicking the in vivo cellular growth environment, including the nutrient gradient, low mechanical stiffness, and surrounding mechanical range (Table 1). Most of the previous methods for culturing osteoblastic cells in a 3D system used collagen I as the unique component in formulations4,5,6, because collagen I fibers serve as the site of calcium and phosphorus deposition. However, an indispensable constituent in the osteoid, the extracellular matrix, contains a large group of cellular factors that promote cellular growth, adhesion, and migration7,8 and is transparent and convenient for imaging observation. Thus, this protocol uses Matrigel (hereafter referred to as basement membrane matrix) as a secondary component for the osteocytogenesis study.
This protocol is suitable for culturing cells in four wells of 24-well plates. If preparing multiple samples or plates, the amounts of the reagents should be increased accordingly.
1. Preparation of the collagen I mixture
NOTE: Collagen I and basement membrane matrix gel quickly at room temperature. Therefore, collagen should be handled on ice (2 °C to 8 °C). All the tips and tubes used must be prechilled unless otherwise indicated. All the procedures should be performed in a safety hood.
2. Preparation of the cell-matrix mixture
3. Plating the cell-gel mixture
4. Identifying the cell viability and cellular dendrites using a confocal microscope
5. Identifying appearance using a stereomicroscope
6. Identifying mineral deposition with an XRF assay
7. Identifying functional gene expression
After live/dead cell staining, the cells were visualized using a confocal laser microscope. All the cells were calcein AM-positive (green color), and there were almost no EthD-1-positive cells (red color) in the field, indicating that the gel system made by this method is highly suitable for osteocytogenesis (Figure 1A, left). To better determine the spatial distribution of the cells, a pseudocolor image was chosen to display the cell dendrites at different depths of the gel; red shows the dendrites at the bottom of the gel, and blue shows the dendrites at the top. The results indicated that the IDG-SW3 cells grew well in this cell-gel matrix, and the cellular dendrites gradually extended into a network in the osteogenic medium on Day 7 (Figure 1A, right, and Figure 1B).
Under a stereomicroscope, the transparency of the gel matrix continued to decline until it became opaque at Day 35, unlike the cell-free gel matrix (Figure 2A). The XRF spectrum of the opaque gel at Day 35 indicated that the gel was completely filled with calcium and phosphorus deposits (Figure 2B).
On Day 1, Day 7, Day 21, Day 28, and Day 35 of the culture, the expression of several marker genes was analyzed by real-time PCR. The results showed that the mRNA levels of Pdpn and Dmp1 continually increased from Day 1 until Day 21, whereas the mRNA level of Pdpn decreased after Day 21 (Figure 3). The mRNA levels of Fgf23 and Sost continually increased during all stages (Figure 3).
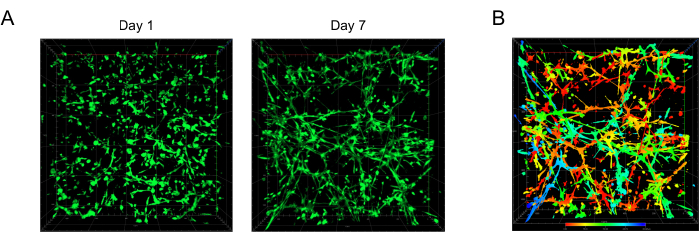
Figure 1: The cellular dendrite network of IDG-SW3 visualized by confocal microscopy. (A) Representative images of a partial area of the extensive dendrite network in the gel. The green color indicates the live cells and the extended cellular dendrite network. (B) Pseudocolor of the image in A (right, Day 7). The red (blue) color indicates the dendrites located at the bottom (top) of the gel. Scale bar = 200 µm. Please click here to view a larger version of this figure.
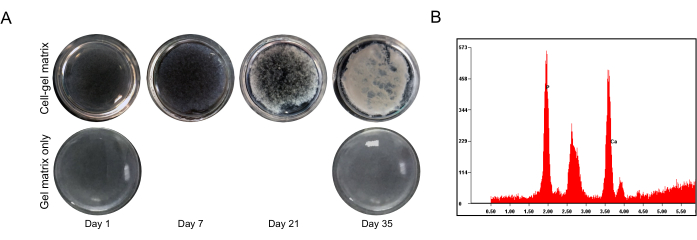
Figure 2: Mineral deposition of the IDG-SW3 cells after osteogenic culturing. (A) Representative full-field images of the gel with (top) and without (bottom) cells in a 24-well plate at the indicated times, as visualized by a stereomicroscope. (B) The calcium and phosphorus content in the cell-gel matrix on Day 35, as analyzed by the XRF assay. Please click here to view a larger version of this figure.
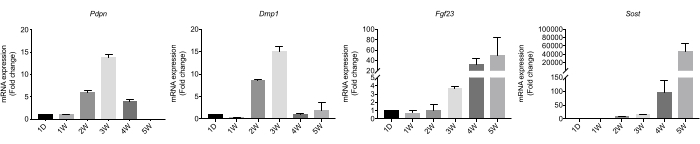
Figure 3: The functional gene expression of the IDG-SW3 cells after osteogenic culturing. Changes in the functional genes in the IDG-SW3 cells cultured with an osteogenic medium at the indicated times. Abbreviations: D = day; W = week. Data are represented as the mean ± SEM. Fold changes were analyzed with the Ct method, referring to the β-actin gene. Please click here to view a larger version of this figure.
2D | 3D | |
Difficulty of preparation | easy | medium |
Gradient of nutrient | absent | present |
Arrangement of collagen | monolayer | multiaxial discrete |
Mechanics stiffness of ECM | high | low |
Mechanical range of ECM | unilateral | surround |
Cell motility | flat surface | free |
Intercellular communication | insufficient | sufficient |
Table 1: Comparison between 2D and 3D culture systems for IDG-SW3 cells.
Names | Sequences (5’- 3’) |
Pdpn-for | GGAGGGCTTAATGAATCTACTGG |
Pdpn-rev | GGTTGTACTCTCGTGTTCTCTG |
Dmp1-for | CCCAGTTGCCAGATACCAC |
Dmp1-rev | CACTATTTGCCTGTCCCTCTG |
Sost-for | ACAACCAGACCATGAACCG |
Sost-rev | CAGGAAGCGGGTGTAGTG |
Fgf23-for | GGTGATAACAGGAGCCATGAC |
Fgf23-rev | TGCTTCTGCGACAAGTAGAC |
β-actin-for | ACCTTCTACAATGAGCTGCG |
β-actin-rev | CTGGATGGCTACGTACATGG |
Table 2: Primers used in the real-time PCR assay.
A critical point in this protocol is that steps 1 and step 2 must be performed on ice to prevent spontaneous coagulation. In this method, the final concentration of collagen I was 1.2 mg/mL. Thus, an optimal ddH2O volume should be calculated to match the different collagens from various manufacturers.
In vivo, osteocytogenesis involves a polar movement of osteoblasts from the surface to the interior of trabecular bone14. This protocol frees cells from growth in the matrix without directional polarity. Of course, seeding IDG-SW3 cells on the cell-free gel matrix surface is optional. However, the collagen concentration provided in this protocol is not enough to form a theoretically flat surface for osteoblast infiltration. Different ratios of collagen I and extracellular matrix should be tested for this purpose.
Compared with that of the osteoid, the stiffness of this gel is far from sufficient. Some articles report increasing the strength of gels by adding several chemical materials to better mimic the stiffness of the osteoid in vivo6,15. The benefit of this method is that the gel formed can provide a medium with good transparency for imaging and tracing cells in situ rather than using histological methods15. Nevertheless, it is difficult to satisfy the transparency of the material for imaging while also ensuring that the in vitro physical and chemical properties can mimic the osteoid. Therefore, more culture models need to be explored to address any specific scientific questions.
Additionally, the physicochemical properties of this IDG-SW3 mineralized gel, including the rheological properties, were introduced in a previous study16. Thus, this biogenic mineralized gel formed by this method could be useful as a biomedical material for future orthopedics research.
The authors have nothing to disclose.
We thank Dr. Lynda F. Bonewald for gifting the IDG-SW3 cell line. This work was supported by the National Natural Science Foundation of China (82070902, 82100935, and 81700778) and the Shanghai "Science and Technology Innovation" Sailing Project (21YF1442000).
0.25% Trypsin-ethylenediaminetetraacetic acid | Hyclone | SH30042.01 | |
15 mL tubes | Corning, NY, USA | 430791 | |
7.5% (w/v) Sodium bicarbonate | Sigma-Aldrich, MO, USA | S8761 | |
ascorbic acid | Sigma-Aldrich, MO, USA | A4544 | |
Collagen I | Thermo Fisher Scientific | A10483-01 | |
fetal bovine serum | Thermo Fisher Scientific | 10099141 | |
homogenizer | BiHeng Biotechnology, Shanghai, China | SKSI | |
laser confocal fluorescence microscopy | Carl Zeiss, Oberkochen, Germany | LSM 800 | |
Live/Dead Cell Imaging kit | Thermo Fisher Scientific | R37601 | |
Matrigel matrix | Corning, NY, USA | 356234 | |
MEM (10X), no glutamine | Thermo Fisher Scientific | 21430079 | |
paraformaldehyde | Sigma-Aldrich, MO, USA | 158127 | |
phosphate buffered saline | Hyclone | SH30256.FS | |
stereo microscope | Carl Zeiss, Oberkochen, Germany | Zeiss Axio ZOOM.V16 | |
Trizol | Thermo Fisher Scientific | 15596026 | |
X-ray fluorescence | EDAX, USA | EAGLE III | |
β-glycerophosphate | Sigma-Aldrich, MO, USA | G9422 |