Monitoring Changes in Human Umbilical Vein Endothelial Cells upon Viral Infection Using Impedance-Based Real-Time Cell Analysis
Summary
The current study describes a protocol to monitor the changes in human umbilical vein endothelial cells (HUVECs) during viral infection using a real-time cell analysis (RTCA) system.
Abstract
Endothelial cells line the inner surface of all blood and lymphatic vessels, creating a semi-permeable barrier regulating fluid and solute exchange between blood or lymph and their surrounding tissues. The ability of a virus to cross the endothelial barrier is an important mechanism that facilitates virus dissemination in the human body. Many viruses are reported to alter endothelial permeability and/or cause endothelial cell barrier disruption during infection, which is able to cause vascular leakage. The current study describes a real-time cell analysis (RTCA) protocol, using a commercial real-time cell analyzer to monitor endothelial integrity and permeability changes during Zika virus (ZIKV) infection of the human umbilical vein endothelial cells (HUVECs). The impedance signals recorded before and after ZIKV infection were translated to cell index (CI) values and analyzed. The RTCA protocol allows the detection of transient effects in the form of cell morphological changes during a viral infection. This assay could also be useful for studying changes in the vascular integrity of HUVECs in other experimental setups.
Introduction
Endothelial cells (ECs) line the inner surface of all blood and lymphatic vessels. They are connected by adherens, tight gap junctions, creating a semi-permeable barrier between blood or lymph and the surrounding tissues1,2. The intact endothelial cell-cell junctions are critical for regulating the transport of macromolecules, solutes, and fluids, crucial for the physiological activities of the corresponding tissues and organs3. The endothelial barrier is dynamic and modulated by specific stimuli4. Disruption or loss of endothelial barrier function is a hallmark of disease pathophysiology in acute and chronic inflammation in the pathogenesis of many diseases5,6,7, including viral infection8,9,10,11. For flaviviruses, it was found that the non-structural protein NS1 can alter endothelial permeability, for example, via disruption of the endothelial glycocalyx-like layer as a result of increased expression and activation of cathepsin L, sialidases, and endoglycosidase heparinase9. In the disease state, the integrity of the endothelial monolayer is affected, and cell-cell junctions are disrupted, which may lead to endothelial injury and dysfunction12 and eventually widespread pathological manifestations across multiple organ systems13,14. Viral infection of ECs results in changes in the cell signaling pathways and cellular gene expression profile, which may affect the fluid barrier functions, cause disruption of the ECs, and induce vascular leakage10,15. Zika virus (ZIKV) infection of ECs has been found to disrupt the junctional integrity that causes changes in vascular permeability and lead to endothelial barrier dysfunction, resulting in vascular leakage10,15. Studies have shown that ZIKV is linked to severe birth defects; however, not much is known about the exact mechanism by which this occurs16,17. Understanding endothelial barrier changes during an infection is therefore critical to understand the disease mechanism.
ECs are currently used as an important experimental in vitro vascular model system for various physiological and pathological processes18,19,20,21. Human umbilical vein endothelial cells (HUVECs) have been extensively used as a primary, non-immortalized cell system to study the vascular endothelium and vascular biology in vitro22,23,24,25. HUVECs were first isolated for in vitro culture in the early 1970s from the umbilical vein of the human umbilical cord26. HUVECs have a cobblestone-like morphology that is easily made to proliferate in the laboratory. Due to shear stress after being maintained for long periods in the confluent state, elongation of the cell shape is observed. HUVECs can be characterized by the presence of Weibel and Palade bodies (WPB), pinocytic vesicles, small amounts of fibrils located near the nucleus, mitochondria with tubular shapes which rarely show ramifications, an ellipsoid nucleus with a fine granular pattern of condensed chromatin, and one to three nucleoli present in each nucleus27. Although HUVECs show numerous morphological characteristics, the identification of HUVECs cannot be achieved by optic examination alone. Assays, such as immunofluorescence staining of vascular endothelial (VE)-cadherin, is commonly used for the monitoring of vascular integrity in HUVECs28,29,30,31.
This study describes the real-time cell analysis (RTCA) protocol of the infection of HUVECs. The RTCA system uses specialized gold-coated plates containing microelectrodes that provide a conductive surface for the cell attachment. When the cells attach to the microelectrode surface, a barrier that impedes electron flow through the microelectrodes is formed. Measurement of the impedance generated by microelectrodes can be used to gain information on some cellular processes, including cell attachments, proliferation, and migration32. The reported assay is an impedance-based cellular assay that, coupled with a real-time cell analyzer, provides continuous measurement of live cell proliferation, morphology changes (such as cell shrinking) and cell attachment quality in a noninvasive and label-free manner. In this study, the real-time cell analyzer is used to monitor the endothelial integrity and morphological changes of HUVECs during ZIKV infection. Briefly, the instrument measures electron flow transmitted in specialized gold-microelectrode-coated microtiter plates in the presence of a culture medium (electrically conductive solution). Cell adherence or changes in cell number and morphology disturb the electron flow and cause impedance variations that can be captured by the instrument (Supplementary Figure 1). The difference between HUVEC growth, proliferation, and adherence before and after ZIKV infection is recorded in real time by an electrical impedance signal and then translated to cell index (CI) value. The CI value from the pre-infection is used as the baseline for CI value normalization. The changes in CI values reflect cellular morphological changes or cell adherence loss upon the infection33. The study results show that the RTCA protocol allows the detection of transient effects or cell morphological changes during viral infection compared to an endpoint assay, such as immunofluorescence staining of VE-cadherin. The RTCA method could be useful for analyzing the HUVEC vascular integrity changes upon infection by other viruses.
Protocol
1. Cell preparation
- Preparation of HUVECs
- Grow 7.5 x 10⁵ HUVEC cells/mL in a 75 cm2 (coated with 20 µg/mL collagen type 1) cell culture flask containing 12 mL of endothelial cell medium (ECM) supplemented with 10% fetal bovine serum (FBS), 0.01% endothelial cell growth supplement (ECGS) that contains growth factors, hormones, and proteins necessary for the culture of HUVECs, and 0.01% penicillin-streptomycin (P/S). Incubate the cells in a cell culture incubator at 37 °C with 5% CO2 (Figure 1).
2. Setup of RTCA experiment
- Resistor verification run on RTCA
- Double-click the RTCA software icon in the desktop to launch the application. A login window will appear, type in the username and password to login.
- Place a 96-well RTCA resistor plate with the A1 well facing inward into the RTCA station located in the cell culture incubator.
- In the Exp Notes tab of the RTCA software, type the experiment name, device SN, and device type (QC plate).
- In the Layout tab under the Cell tab of the RTCA software, highlight all the wells and right-click on the highlighted wells to make sure all the wells are turned on (grayed out).
- In the Schedule tab of the RTCA software, click Step_1. Enter Sweeps: 10, and Interval: 30 s. Click Apply. Click Start/Continue in the top left corner of the software to start the verification run.
NOTE: Make sure the connection of the wells to the RTCA station is okay by observing "Plate Scanned. Connections OK" at the bottom of the page.
- Resistor verification run for data analysis
- In the Cell Index tab, check the data upon completion of the run. All the CI values should be less than 0.063.
- In the lower part of the Cell Index tab, check the raw scan data. The raw scan data should exhibit repeated value patterns of 40.0 ± 2.0 (rows A and H), 67.5 ± 2.5 (rows B and G), 93.6 ± 2.9 (rows C and F), and 117.6 ± 3.2 (rows D and E).
- To stop the verification run, click Plate > Release Plate. The 96-well RTCA resistor plate is now ready to be removed from the RTCA station.
- Obtaining background reading on RTCA
- Wash the collagen type 1-coated specialized gold-microelectrode plate (coated with 20 µg/mL collagen type 1) with 60 µL/well of Hank's balanced salt solution (HBSS; with sodium bicarbonate, without calcium chloride and magnesium sulfate) 2x.
- Discard the remaining HBSS and add 50 µL/well of ECM. Place the specialized gold-microelectrode plate containing ECM with the A1 well facing inward into the RTCA station located in the cell culture incubator.
- In the Exp Notes tab of the RTCA software, type the experiment name, device SN, and device type (96-well format).
- In the Layout tab under the Cell tab of the RTCA software, highlight the wells that will be used and right-click on the highlighted wells to make sure all the wells are turned on (grayed out).
- In the Schedule tab of the RTCA software, click Step_1, and click Start/Continue in the top left corner of the software to obtain a background reading.
NOTE: Make sure the connection of the wells is correct by observing "Plate Scanned. Connections OK" at the bottom of the page. - Once the background reading is obtained, the specialized gold-microelectrode plate is now ready for cell seeding and ready to be removed from the RTCA station.
- HUVEC preparation in the specialized gold-microelectrode plate
- Seed the HUVECs in the specialized gold-microelectrode plate with 50 µL/well of conditioned medium, 1 x 10⁴ cells/well (conditioned medium: ECM supplemented with 10% FBS, 0.01% ECGS, and 0.01% P/S). Place the plate back into the RTCA station with the A1 well facing inward for overnight incubation in a cell culture incubator at 37 °C with 5% CO2.
NOTE: A cell count was performed on the cell suspension with a dilution factor of two using a hemocytometer. - In the Schedule tab, click Add a Step in the top left corner. Click on Step_2 and change the Sweeps: 601, and Interval: 2 min. Click Apply. Click on Step_2 and click Start/Continue in the top left corner of the software.
- After 20 h of incubation and when the CI values in the Well Graph tab show a plateau, the plate is ready for infection. In the Schedule tab of the RTCA software, click Abort Step.
- The specialized gold-microelectrode plate is now ready to be removed from the RTCA station for subsequent steps.
- Seed the HUVECs in the specialized gold-microelectrode plate with 50 µL/well of conditioned medium, 1 x 10⁴ cells/well (conditioned medium: ECM supplemented with 10% FBS, 0.01% ECGS, and 0.01% P/S). Place the plate back into the RTCA station with the A1 well facing inward for overnight incubation in a cell culture incubator at 37 °C with 5% CO2.
3. Viral infection in HUVECs
- Virus dilution
- The ZIKV stock culture is kept at -80 °C. For this study, remove the virus stock kept in the cryogenic vials and dilute the ZIKV stock with serum-free ECM in 1.5 mL centrifuge tubes to achieve multiplicity of infections (MOIs) of 0.1 and 1.
NOTE: The ZIKV stock was previously prepared by performing propagation in Vero cells and harvesting the ZIKV supernatant34.
- The ZIKV stock culture is kept at -80 °C. For this study, remove the virus stock kept in the cryogenic vials and dilute the ZIKV stock with serum-free ECM in 1.5 mL centrifuge tubes to achieve multiplicity of infections (MOIs) of 0.1 and 1.
- Infection of the cell monolayer
- Remove and discard the conditioned medium (ECM supplemented with 10% FBS, 0.01% ECGS, and 0.01% P/S) from each well. Rinse each well with 60 µL of HBSS 2x. Insert the HBSS with the aid of the side of the well; do not shoot the cell monolayer.
- Working from the highest to lowest dilution, add 40 µL of each diluted virus sample in serum-free ECM into the well. Triplicate the well for each dilution and maintain six wells without infection (negative control and positive control thrombin). Do not shoot the cell monolayer; instead, add the diluted virus with the aid of the side of the well. Use a fresh pipet tip for each insertion.
NOTE: Thrombin was chosen as the positive control as it can increase the endothelial permeability of HUVECs rapidly. - Incubate the plate in a cell culture incubator at 37 °C with 5% CO2 to allow virus adsorption. Swish the plate 5x every 15 min to allow virus adsorption throughout the cell monolayer.
- Addition of the overlay cell culture medium
- After 1 h of incubation, remove and discard the virus suspension from the lowest concentration to the highest.
- Wash the infected cells with 60 µL of HBSS 2x. Overlay the well with ECM supplemented with 2% FBS. For the positive control wells, dilute the thrombin to 20 U/mL with ECM supplemented with 2% FBS, and overlay the wells with thrombin-containing ECM medium. Do not shoot the cell monolayer; instead, add overlay media with the aid of the side of the well.
- Placement of the infected specialized gold-microelectrode plate back in RTCA station
- In the Schedule tab, click Add a Step in the top left corner. Click on Step_3 and change the Sweeps: 3,601 and Interval: 2 min. Click Apply.
- Click OK in the pop-up window that appears. Place the infected specialized gold-microelectrode plate with the A1 well facing inward into the RTCA station located in the cell culture incubator.
- Click on Step_3 and click Start/Continue in the top left corner of the software.
4. Data analysis and exporting data
- Addition of experimental information of each well
- In the Layout tab, click the Cell tab (Figure 2A). To enter the target cell information and determine the well type for each well, highlight the well and type in the target cell name, number, and color at the bottom of the software. Click Apply (Figure 2B).
- To select and determine the well type for each well in the Cell tab, highlight the well, select well type (sample, positive control, or negative control), and click Set.
- In the Layout tab, click on the Treatment tab (Figure 2C). To enter treatment information, highlight the well and type in the treatment name, concentration of treatment, unit, and color. Click Apply (Figure 2D).
- To select and determine the well type for each well on the Treatment tab, highlight the well, select well type (sample, positive control, or negative control), and click Set.
NOTE: For each selection, multiple wells can be highlighted at the same time.
- Normalization of CI value
- Right-click on the right of the Data analysis tab and select Normalized Cell Index from the Y Axis drop-down box (Figure 3A). In the X Axis section at the bottom, select the normalized time as the last measured time point where the specialized gold-microelectrode plate was removed for infection (Figure 3B).
NOTE: The normalization process carried out by the software removes most of the variability due to the differences in well seeding and attachment, as long as the chosen normalization point is before addition of the virus and/or treatment. Hence, the optimal normalization time point should be the last time point before virus and/or treatment addition. The time point to normalize can be checked in the Schedule tab under Step_2. The total time indicated is the time point to normalize (Figure 3C).
- Right-click on the right of the Data analysis tab and select Normalized Cell Index from the Y Axis drop-down box (Figure 3A). In the X Axis section at the bottom, select the normalized time as the last measured time point where the specialized gold-microelectrode plate was removed for infection (Figure 3B).
- Plotting obtained data using RTCA software
- In the Data analysis tab, select the wells to be added into the graph by highlighting the wells and clicking << Add. The normalized cell index against the time graph is now ready to be copied and exported. Make sure to tick the Average tick box.
- Exporting data using RTCA software
- In the top left corner of the RTCA software, click Plate > Export Experiment Info…. Check the box to select the data to be exported. Click OK.
NOTE: Raw data (raw CI values) can be exported when Cell index > All is ticked. - Select the folder to save the export file. Click SAVE. A pop-up window will appear indicating the exporting of experimental information. Once exporting is done, another window will appear indicating the exported experiment information is ready to be viewed.
- In the top left corner of the RTCA software, click Plate > Export Experiment Info…. Check the box to select the data to be exported. Click OK.
Representative Results
Before ZIKV infection, the CI recorded for the HUVEC monolayer cultured on a specialized gold-microelectrode coated microtiter plate was above 8, suggesting strong adherence properties. Plates or wells with a CI index less than 8 should be discarded. The HUVECs were then infected with ZIKV at an MOI of 0.1 and 1, and the cell impedance was recorded for 7 days. The CI value of HUVECs infected with ZIKV P6-740 at an MOI of 0.1 (light blue line) started to drop at 15 h post-infection (HPI), compared to the negative infection control (brown line; Figure 4). As for HUVECs infected with a higher dose of ZIKV P6-740 at an MOI of 1 (blue line), the CI value started to drop as early as at 11 HPI. At 24 HPI, there was a 5% and 7% drop in the normalized CI value (0.949, 0.929) when ECs were infected with ZIKV at an MOI of 0.1 and 1, respectively. A 50% reduction in the normalized CI value was recorded at 96 HPI and at 66.75 HPI upon ZIKV infection at an MOI of 0.1 and 1, respectively. The normalized CI value reached its lowest point at 107 HPI, where there was a reduction of 51% and 60% (0.4915, 0.3984) upon ZIKV infection at an MOI of 0.1 and 1, respectively. The normalized CI value was found to have a 4% and 13% increase from 107 HPI onward until the end of the experiment at 168 HPI (0.5128, 0.4571). The black line shows the effects of thrombin used as a positive control, where the CI values remained low throughout the experiment, mimicking the disruption of tight junctions, and induced vascular leakage35.
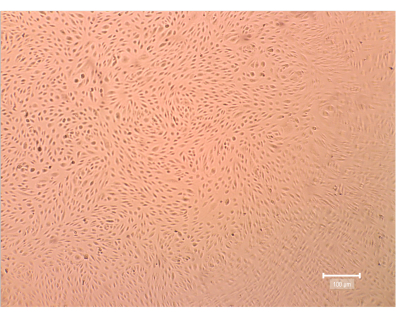
Figure 1: Human umbilical vein endothelial cells (HUVECs). The figure is in 40x magnification to view the rate of confluency. Please click here to view a larger version of this figure.
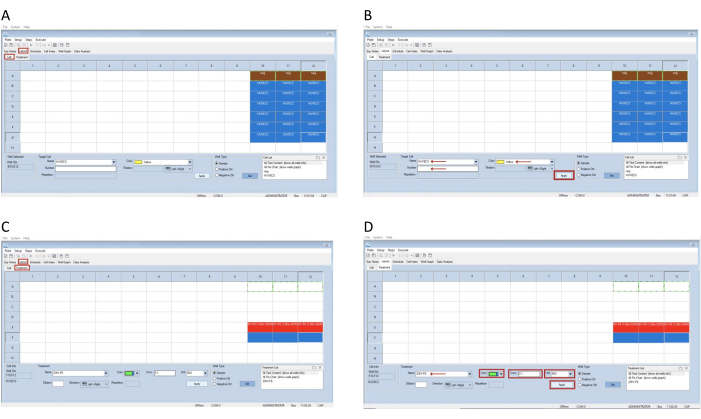
Figure 2: Screenshots of the Cell and Treatment tab under the Layout tab on the RTCA software. (A) In the Layout tab, click the Cell tab. (B) To enter target cell information and determine the well type for each well, highlight the well and type the target cell name, number, and color at the bottom of the software. Click Apply. (C) Click the Layout tab under the Treatment tab. (D) To enter treatment information, highlight the well and type in the treatment name, concentration of treatment, unit, and color. Click Apply. Please click here to view a larger version of this figure.
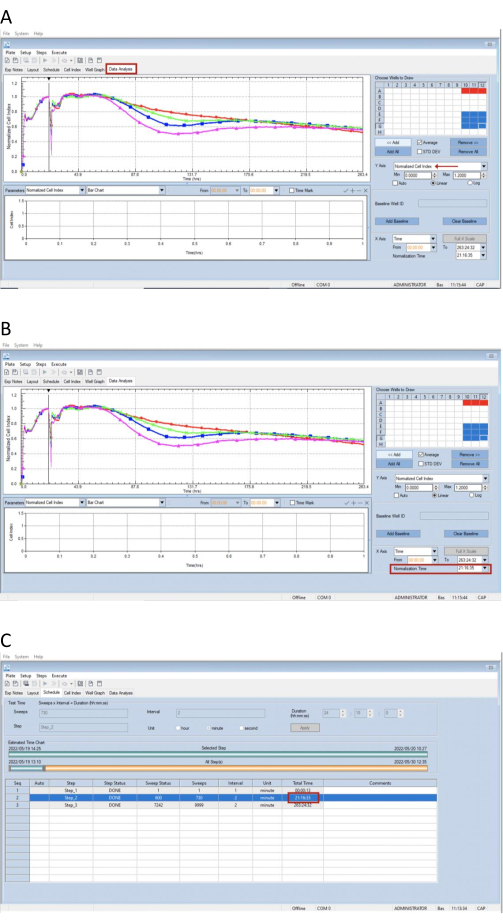
Figure 3: Screenshots of the Data Analysis tab in the RTCA software for cell index normalization. (A) In the Y Axis drop-down box, select Normalized Cell Index. (B) In the X Axis section, select the normalization time. (C) Screenshot of the Schedule tab in the RTCA software. The normalization time is indicated at the Step_2 total time. Please click here to view a larger version of this figure.
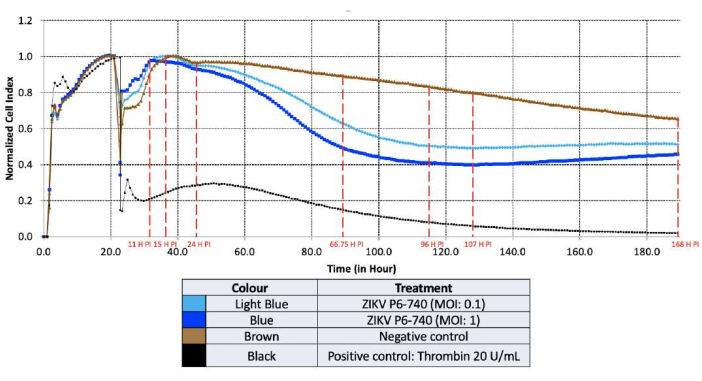
Figure 4: Normalized cell index versus time plot of Zika virus (ZIKV) infection in human umbilical vein endothelial cells (HUVECs). The specialized gold-microelectrode plate was coated with 20 µg/mL collagen type 1. The HUVECs were seeded at a density of 1.0 x 10⁴ cells/well. ZIKV P6-740 (MOI: 0.1, 1) was used for infection. Light blue: ZIKV P6-740 (MOI: 0.1); blue: ZIKV P6-740 (MOI: 1); black: thrombin as the positive control (20 U/mL); brown: negative infection control. Each data point signifies the average and was analyzed in triplicate. Please click here to view a larger version of this figure.
Supplementary Figure 1: Schematic drawing on the technique used in the electrical biosensor impedance based RTCA. A side view of the well plate; at the bottom of the wells there are gold-plated negative and positive terminals. As the instrument measures CI in the microwell that contains culture media that allows to conduct electricity, the electron flows from the negative to the positive terminal. When it is a blank control, electron flow is smooth, hence no impedance is recorded. When the cells are seeded, and as more and more cells attach to bottom of well, impedance in electron flow is present and recorded by the computer. Using this impedance value, the instrument converts it to a CI value, indicating the number of cells attached to bottom of the well (adhesion). Created with BioRender. Please click here to download this File.
Discussion
Cytocidal viral infection in permissive cells is usually associated with substantial changes in cell morphology and biosynthesis36. The virus-induced cellular morphological changes, such as cell shrinking, cell enlargement, and/or syncytia formation, are also known as cytopathic effects (CPEs), characteristic to certain viral infections37. In ECs, the CPE was described as the destruction of cells and breakdown of the tight junctions in between each EC, hence causing the breakdown of the endothelial barrier38,39. CPEs in HUVECs can be described as monolayer cell detachment and floating from the tissue culture vessel. The infected cell morphological changes, such as detachment and floating of adherent cells, can be continuously detected using the RTCA method. This technique is based on electrical impedance, which allows the monitoring of cells in real time up to every few seconds. It allows the quantification of cell proliferation, morphological changes, and in the case of HUVECs, it can be used to monitor changes in endothelial integrity and cell barrier function40 upon stimulation.
In this study, the critical step is the setup of experiment, where the 96-well resistor plate is utilized. This is to ensure that all connections of the analyzer are well connected to the plate. In RTCA, the measured impedance value is converted as a CI value to differentiate the differences in cell number, adhesion degree, cellular morphology, and cell viability41. The drop in the recorded impedance by the RTCA analyzer, which translates into a drop in the CI value, suggests a reduced cell number, weaker adhesion degree, and substantial changes in cellular morphology42. Therefore, it is also important to test the suitability of cell lines and optimum cell numbers to be used in the RTCA experiment. It is critical to determine if the desired CI index can be achieved before the execution of testing on the cells using the RTCA system. Additionally, this also helps to determine if the RTCA system is suitable to monitor cell growth and cell death profiles of selected cell types. In our study, a steep drop in CI values was observed when HUVECs were infected with ZIKV P6-740 at MOI of 0.1 and 1. The steep drop in CI value, hence suggesting that HUVEC cellular morphological changes occurred following infection, and this led to the disruption of tight junctions and the EC vascular integrity.
Conventionally, CPEs caused by the viral infection of cells in vitro are estimated based on microscopic observation of the infected cells. Additionally, some other assays, such as the plaque assay, allow the visualization of CPEs (such as cell detachment) and are used to measure the extent of the CPEs42. However, these methods have limitations in that they only provide information on discrete time points of the cellular morphological changes (endpoint assays). Other assays, such as immunofluorescence staining, rely on combinations of specific antibodies tagged with a fluorophore to visualize the morphological changes43. Although the immunofluorescence assay has a broad capability that permits the visualization of many components in any given tissue or cell type, this technique does not allow real-time monitoring and detection during viral infection. In contrast, the RTCA system records the real-time cell morphological changes during the viral infection, allowing the capture of transient effects, such as transient vascular leakage, that could be missed by endpoint assays. For example, endpoint assays would fail to detect the data and morphological changes as early as 60 HPI, 80 HPI, and 100 HPI. In addition to RTCA, trans-epithelial electrical resistance (TEER) measurement is another commonly used method to monitor cell-to-cell interactions, where the electric resistance across the cell monolayer is measured. However, the TEER requires several repeated measurements over time in order to monitor live cell activities and is often performed on a smaller number of samples or wells at a time. As a result, TEER typically has lower throughput compared to RTCA, which can run up to 96 wells simultaneously44.
Despite its benefits, the RTCA system has several limitations. The main limitation of the RTCA system is the costly equipment and consumables. The specialized gold-microelectrode plates used by the RTCA system are relatively costly, single-use, and disposable45. Additionally, the cell morphological changes cannot be imaged and captured on a recorder (camera), nor can the assay capture the accumulation of the virus antigen or changes in the cell surface protein, such as VE-cadherin in HUVECs46. As a result, the RTCA cannot visualize the cell morphological changes that would provide additional useful information to elucidate the disease pathogenesis. During the assay or model establishment, additional staining verification, such as VE-cadherin staining for HUVECs, would be useful to validate the measurements obtained. Furthermore, the RTCA system is limited to adherent cell lines, as it requires the attachment of cells at the bottom of the wells for the impedance to be recorded. Therefore, the reported assay cannot be used for non-adherent cell lines46.
In conclusion, we have described a real-time cell analyzing protocol using the RTCA instrument to monitor changes in endothelial cells upon ZIKV infection in 96-well format. This method offers several advantages over conventional endpoint assays, in that it allows for a noninvasive and non-label intensive approach for continuously monitoring cellular morphological changes in real time. This assay can also be used to analyze vascular integrity changes of other cell lines in different experimental setups.
Declarações
The authors have nothing to disclose.
Acknowledgements
This research received support from the Ministry of Higher Education Malaysia under the Higher Institution Centre of Excellence (HICoE) program (MO002-2019) and funding under the Long-Term Research Grant Scheme (LRGS MRUN Phase 1: LRGS MRUN/F1/01/2018).
Materials
| 1.5 mL microcentrifuge tube | Nest | 615601 | |
| 37 °C incubator with 5% CO2 | Sanyo | MCO-18AIC | |
| 75 cm2 tissue culture flask | Corning | 430725U | |
| Antibiotic solution penicillin-streptomycin (P/S) | Sciencell | 0503 | |
| Biological safety cabinet, Class II | Holten | HB2448 | |
| Collagen Type 1 | SIgma-Aldrich | C3867 | |
| Endothelial cell growth supplement (ECGS) | Sciencell | 1052 | |
| Endothelial cell medium (ECM) | Sciencell | 1001 | |
| E-plate 96 | Agilent Technologies, Inc. | 05232368001 | |
| Fetal bovine serum (FBS) | Sciencell | 0025 | |
| Hanks' Balanced Salt Solution (HBSS) | Sigma-Aldrich | H9394 | |
| Hemocytometer | Laboroptik LTD | Neubauer improved | |
| Human Umbilical Vein Endothelial Cells (HUVECs) | Sciencell | 8000 | |
| Inverted microscope | ZEISS | TELAVAL 31 | |
| Latitude 3520 Laptop | Dell | – | |
| Multichannel micropipette (10 – 100 µL) | Eppendorf | 3125000036 | |
| Multichannel micropipette (30 – 300 µL) | Eppendorf | 3125000052 | |
| Reagent reservior | Tarsons | T38-524090 | |
| RTCA resistor plate 96 | Agilent Technologies, Inc. | 05232350001 | |
| RTCA Software Pro (Version 2.6.1) | Agilent Technologies, Inc. | 5454433001 | |
| Single channel pipettes (10 – 100 µL) | Eppendorf | 3123000047 | |
| Single channel pipettes (100 – 1000 µL) | Eppendorf | 3123000063 | |
| Single channel pipettes (20 – 200 µL) | Eppendorf | 3123000055 | |
| xCELLigence Real-time cell analyzer SP (Model: W380) | Agilent Technologies, Inc. | 00380601030 | https://www.agilent.com/en/product/cell-analysis/real-time-cell-analysis/rtca-analyzers/xcelligence-rtca-sp-single-plate-741232 |
Referências
- Alberts, B., et al. Cell junctions. Molecular Biology of the Cell. 4th Edition. , (2002).
- Pugsley, M. K., Tabrizchi, R. The vascular system: An overview of structure and function. Journal of Pharmacological and Toxicological Methods. 44 (2), 333-340 (2000).
- Stevens, T., Garcia, J. G., Shasby, D. M., Bhattacharya, J., Malik, A. B. Mechanisms regulating endothelial cell barrier function. American Journal of Physiology. Lung Cellular and Molecular Physiology. 279 (3), L419-L422 (2000).
- Wu, M. H. Endothelial focal adhesions and barrier function. The Journal of Physiology. 569, 359-366 (2005).
- Boueiz, A., Hassoun, P. M. Regulation of endothelial barrier function by reactive oxygen and nitrogen species). Microvascular Research. 77 (1), 26-34 (2009).
- Fosse, J. H., Haraldsen, G., Falk, K., Edelmann, R. Endothelial cells in emerging viral infections. Frontiers in Cardiovascular Medicine. 8, 619690 (2021).
- Rajendran, P., et al. The vascular endothelium and human diseases. International Journal of Biological Sciences. 9 (10), 1057-1069 (2013).
- Iyer, S., Ferreri, D. M., DeCocco, N. C., Minnear, F. L., Vincent, P. A. VE-cadherin-p120 interaction is required for maintenance of endothelial barrier function. American Journal of Physiology. Lung Cellular and Molecular Physiology. 286 (6), L1143-L1153 (2004).
- Puerta-Guardo, H., et al. Flavivirus NS1 triggers tissue-specific vascular endothelial dysfunction reflecting disease tropism. Cell Reports. 26 (6), 1598-1613 (2019).
- Rastogi, M., Singh, S. K. Zika virus NS1 affects the junctional integrity of human brain microvascular endothelial cells. Biochimie. 176, 52-61 (2020).
- Soe, H. J., et al. High dengue virus load differentially modulates human microvascular endothelial barrier function during early infection. Journal of General Virology. 98 (12), 2993-3007 (2017).
- Krouwer, V. J., Hekking, L. H. P., Langelaar-Makkinje, M., Regan-Klapisz, E., Post, J. A. Endothelial cell senescence is associated with disrupted cell-cell junctions and increased monolayer permeability. Vascular Cell. 4 (1), 12 (2012).
- Aird, W. C. The role of the endothelium in severe sepsis and multiple organ dysfunction syndrome. Blood. 101 (10), 3765-3777 (2003).
- Bryce, C., et al. Pathophysiology of SARS-CoV-2: targeting of endothelial cells renders a complex disease with thrombotic microangiopathy and aberrant immune response. The Mount Sinai COVID-19 autopsy experience. MedRxiv. , (2020).
- Khaiboullina, S., et al. Transcriptome profiling reveals pro-inflammatory cytokines and matrix metalloproteinase activation in Zika virus infected human umbilical vein endothelial cells. Frontiers in Pharmacology. 10, 642 (2019).
- Cao-Lormeau, V. -. M., et al. Guillain-Barré Syndrome outbreak associated with Zika virus infection in French Polynesia: a case-control study. The Lancet. 387 (10027), 1531-1539 (2016).
- Sarno, M., et al. Zika virus infection and stillbirths: a case of hydrops fetalis, hydranencephaly and fetal demise. PLoS Neglected Tropical Diseases. 10 (2), e0004517 (2016).
- Dalrymple, N. A., Mackow, E. R. Virus interactions with endothelial cell receptors: implications for viral pathogenesis. Current Opinion in Virology. 7, 134-140 (2014).
- Buchanan, C. F., et al. Three-dimensional microfluidic collagen hydrogels for investigating flow-mediated tumor-endothelial signaling and vascular organization. Tissue Engineering Part C: Methods. 20 (1), 64-75 (2014).
- Daniels, B. P., et al. Immortalized human cerebral microvascular endothelial cells maintain the properties of primary cells in an in vitro model of immune migration across the blood brain barrier. Journal of Neuroscience Methods. 212 (1), 173-179 (2013).
- Vozzi, F., Bianchi, F., Ahluwalia, A., Domenici, C. Hydrostatic pressure and shear stress affect endothelin-1 and nitric oxide release by endothelial cells in bioreactors. Biotechnology Journal. 9 (1), 146-154 (2014).
- Gallinat, A., Badimon, L. DJ-1 interacts with the ectopic ATP-synthase in endothelial cells during acute ischemia and reperfusion. Scientific Reports. 12 (1), 12753 (2022).
- Jiménez, N., Krouwer, V. J. D., Post, J. A. A new, rapid and reproducible method to obtain high quality endothelium in vitro. Cytotechnology. 65 (1), 1-14 (2013).
- Latifi-Navid, H., et al. Network analysis and the impact of Aflibercept on specific mediators of angiogenesis in HUVEC cells. Journal of Cellular and Molecular Medicine. 25 (17), 8285-8299 (2021).
- Poulet, M., et al. PRL-2 phosphatase is required for vascular morphogenesis and angiogenic signaling. Communications Biology. 3 (1), 603 (2020).
- Laurens, N., van Hinsbergh, V. W. Isolation, purification and culture of human micro- and macrovascular endothelial cells. Methods in Endothelial Cell Biology. , 3-13 (2004).
- Haudenschild, C. C., Zahniser, D., Folkman, J., Klagsbrun, M. Human vascular endothelial cells in culture: lack of response to serum growth factors. Experimental Cell Research. 98 (1), 175-183 (1976).
- Cenni, E., Perut, F., Baldini, N. In vitro models for the evaluation of angiogenic potential in bone engineering. Acta Pharmacologica Sinica. 32 (1), 21-30 (2011).
- Lau, S., Gossen, M., Lendlein, A., Jung, F. Venous and arterial endothelial cells from human umbilical cords: potential cell sources for cardiovascular research. International Journal of Molecular Sciences. 22 (2), 978 (2021).
- Marquez-Curtis, L. A., Sultani, A. B., McGann, L. E., Elliott, J. A. W. Beyond membrane integrity: Assessing the functionality of human umbilical vein endothelial cells after cryopreservation. Cryobiology. 72 (3), 183-190 (2016).
- Park, H. -. J., et al. Human umbilical vein endothelial cells and human dermal microvascular endothelial cells offer new insights into the relationship between lipid metabolism and angiogenesis. Stem Cell Reviews. 2 (2), 93-102 (2006).
- Dowling, C. M., Herranz Ors, C., Kiely, P. A. Using real-time impedance-based assays to monitor the effects of fibroblast-derived media on the adhesion, proliferation, migration and invasion of colon cancer cells. Bioscience Reports. 34 (4), e00126 (2014).
- Piret, J., Goyette, N., Boivin, G. Novel method based on real-time cell analysis for drug susceptibility testing of herpes simplex virus and human cytomegalovirus. Journal of Clinical Microbiology. 54 (8), 2120-2127 (2016).
- Tan, J. Y., Wong, J. E., Zainal, N., AbuBakar, S., Tan, K. K. Virus propagation and cell-based colorimetric quantification. Journal of Visualized Experiments. , (2023).
- Kustermann, S., et al. A real-time impedance-based screening assay for drug-induced vascular leakage. Toxicological Sciences. 138 (2), 333-343 (2014).
- Albrecht, T., Fons, M., Boldogh, I., Rabson, A. S. Effects on cells. Medical Microbiology. 4th Edition. , (1996).
- Hematian, A., et al. Traditional and modern cell culture in virus diagnosis. Osong Public Health and Research Perspectives. 7 (2), 77-82 (2016).
- Friedman, H. M. Infection of endothelial cells by common human viruses. Reviews of Infectious Diseases. 11, S700-S704 (1989).
- Friedman, H. M., Macarak, E. J., MacGregor, R. R., Wolfe, J., Kefalides, N. A. Virus infection of endothelial cells. The Journal of Infectious Diseases. 143 (2), 266-273 (1981).
- Xiao, C., Lachance, B., Sunahara, G., Luong, J. H. T. Assessment of cytotoxicity using electric cell-substrate impedance sensing: concentration and time response function approach. Analytical Chemistry. 74 (22), 5748-5753 (2002).
- Marlina, S., Shu, M. -. H., AbuBakar, S., Zandi, K. Development of a Real-Time Cell Analysing (RTCA) method as a fast and accurate screen for the selection of chikungunya virus replication inhibitors. Parasites & Vectors. 8, 579 (2015).
- Liu, S., DeLalio, L. J., Isakson, B. E., Wang, T. T. AXL-mediated productive infection of human endothelial cells by Zika virus. Circulation Research. 119 (11), 1183-1189 (2016).
- Souf, S. Recent advances in diagnostic testing for viral infections. Bioscience Horizons: The International Journal of Student Research. 9, (2016).
- Sun, M., et al. A dynamic real-time method for monitoring epithelial barrier function in vitro. Analytical Biochemistry. 425 (2), 96-103 (2012).
- Stefanowicz-Hajduk, J., Ochocka, J. R. Real-time cell analysis system in cytotoxicity applications: Usefulness and comparison with tetrazolium salt assays. Toxicology Reports. 7, 335-344 (2020).
- Kho, D., et al. Application of xCELLigence RTCA biosensor technology for revealing the profile and window of drug responsiveness in real time. Biosensors. 5 (2), 199-222 (2015).
