This study presents the two-dimensional (2D) scratch wound migration assay and the three-dimensional (3D) spheroid sprouting assay, along with their respective downstream analysis methods, including RNA extraction and immunocytochemistry, as suitable assays to study angiogenesis in vitro.
Angiogenesis plays a crucial role in both physiological and pathological processes within the body including tumor growth or neovascular eye disease. A detailed understanding of the underlying molecular mechanisms and reliable screening models are essential for targeting diseases effectively and developing new therapeutic options. Several in vitro assays have been developed to model angiogenesis, capitalizing on the opportunities a controlled environment provides to elucidate angiogenic drivers at a molecular level and screen for therapeutic targets.
This study presents workflows for investigating angiogenesis in vitro using human umbilical vein endothelial cells (HUVECs). We detail a scratch wound migration assay utilizing a live cell imaging system measuring endothelial cell migration in a 2D setting and the spheroid sprouting assay assessing endothelial cell sprouting in a 3D setting provided by a collagen matrix. Additionally, we outline strategies for sample preparation to enable further molecular analyses such as transcriptomics, particularly in the 3D setting, including RNA extraction as well as immunocytochemistry. Altogether, this framework offers scientists a reliable and versatile toolset to pursue their scientific inquiries in in vitro angiogenesis assays.
Angiogenesis, which refers to the formation of new blood vessels from pre-existing ones1, is a crucial process during physiological development and pathologic conditions. It is indispensable for providing energy to highly metabolically active tissues such as the retina2 or the developing central nervous system3 and during the healing of damaged tissue4. Abnormal angiogenesis, on the other hand, is the basis for numerous diseases. Solid tumors, such as colorectal cancer or non-small cell lung cancer, facilitate their growth and the necessary energy supply by promoting angiogenesis5. Apart from cancer, neovascular diseases of the eye like diabetic retinopathy or age-related macular degeneration, which represent leading causes of blindness in the developed world, result from aberrant vessel growth6,7. A detailed understanding of the underlying pathomechanism is crucial to comprehend how physiological angiogenesis can be enhanced, for instance, in wound healing while better controlling pathological conditions such as vasoproliferative eye diseases.
On a cellular level, vascular endothelial cells are activated by various signaling molecules in angiogenesis, initiating cell proliferation and migration8. The cells subsequently organize into a hierarchy, with non-proliferating tip cells forming filopodia at the leading edge of the developing vessel branch8. Alongside, fast-proliferating stalk cells trail the tip cells, contributing to the formation of the emerging vessel. Subsequently, other cell types, such as pericytes or smooth muscle cells, are recruited to further stabilize the nascent branch9.
To explore molecular processes at the vascular endothelial cell level, numerous in vitro protocols have been developed and recently reviewed10. These assays typically fall into two categories: more simplistic but scalable 2D approaches and more elaborate 3D protocols. In a recent project, we conducted a comprehensive comparative analysis between the 2D scratch wound migration assay and the 3D spheroid sprouting assay11 to assess the extent of their differences and their ability to model various aspects of angiogenesis12.
While both offer the advantages of being reliable and easily implementable, on a molecular level, the 3D spheroid sprouting assay was favorable in addressing key aspects of angiogenesis compared to in vivo data, such as metabolic switches or cell-matrix interactions. Since in vitro angiogenesis assays are used to evaluate the angiomodulatory potential of signaling pathways13 and to screen for therapeutic agents, transferability of in vitro results to in vivo settings is essential. Furthermore, the opportunity for omics-based analyses on the RNA and protein levels to characterize the molecular changes in response to targeted modulation of angiogenic processes under controlled conditions remains an important benefit compared to in vivo settings14,15.
In this publication, we present key assays for exploring angiogenesis-related questions through the utilization of a live-cell imaging migration assay and a spheroid sprouting assay, including subsequent molecular analyses like RNA sequencing for transcriptomic analysis and immunohistochemistry on the protein level.
1. HUVEC cell culture
NOTE: Perform all following steps under sterile working conditions (sterile working bench).
2. Scratch wound migration assay
NOTE: The scratch wound migration assay requires a duration of 3 days for completion (Figure 1). Perform all the following steps under sterile working conditions (sterile working bench).
3. RNA extraction with 2D cultivated cells
NOTE: Perform all the following steps until step 3.3 under sterile working conditions (sterile working bench).
4. Immunocytochemistry with 2D cultivated cells
NOTE: Perform all following steps until step 4.4 under sterile working conditions (sterile working bench).
5. Spheroid sprouting assay
NOTE: The spheroid sprouting assay requires 3 days for completion (Figure 2). Perform all following steps until step 5.7 under sterile working conditions (sterile working bench).
6. RNA extraction with 3D cultivated cells
7. Immunocytochemistry of spheroids in a 3D collagen matrix
8. Human retinal microvascular endothelial cells (HRMVECs)
NOTE: All the described steps can also be performed with microvascular endothelial cells, e.g., human retinal microvascular endothelial cells (HRMVECs). In that case, the medium needs to be switched to a specific microvascular endothelial cell medium containing 10% fetal bovine serum (FBS) for cultivation as well as specific steps in each assay. HRMVEC-specific differences to the assay protocols are outlined below:
For the migration assay, it is crucial to thoroughly examine the images captured at the t = 0 h time point to ensure the presence of a fully formed cell monolayer is accurately detected by the system (Figure 1B). Additionally, the clarity and straightness of the scratch border should be confirmed (Figure 1B). The cell-free area ought to be largely free of debris. At the end of the assay, a group stimulated with, for example, 25 ng/mL VEGF as a positive control should show successful migration in the original scratched area (Figure 1B). An instance of technical issues might manifest as patchy cell growth, double scratching, or waviness in the scratch borders (Figure 1C). Furthermore, it is important to establish a substantial dynamic range between the negative control (EBM-stimulated samples) and the positive control (VEGF samples) (Figure 1D). In our experimental setup, we consider a 25% increase in RWD after 12 h as an optimal range (Figure 1D). In a technical problematic assay, positive and negative controls do not separate correctly, indicating a low dynamic range (Figure 1E).
Immunocytochemical staining of HUVECs on coverslips, visualized under a fluorescence microscope to validate successful staining (Figure 1F). It is important to survey a majority of the cells and identify a characteristic region of the slide. Staining specificity is assessed using a control slide treated only with a secondary antibody to exclude nonspecific binding (Figure 1F). Specific staining signals should be critically examined according to the known subcellular localization of the target protein. We use subcellular localization patterns along with the absence of signal in the control sample as indices of a successful immunostaining protocol.
Similarly, certain aspects must be considered for high-quality spheroid sprouting assays. The quality should, in this case, be assessed at the end of the assay at, for example, t = 24 h. The collagen matrix observed under the microscope should exhibit homogeneity and should not appear friable or rough (Figure 2B). Spheroids stimulated with just basal medium as a negative control and 25 ng/mL VEGF as a positive control should be clearly distinguishable (Figure 2B). Furthermore, spheroids should float in the gel and not drop to the ground, where they disperse, indicating low quality (Figure 2C). This issue often arises from inadequate cooling of the collagen during titration of the mixture or from over- or under-titration of the pH (Figure 2C). A minimum of 10 spheroids per well should be imageable for each well. The negative control (EBM-stimulated samples) should demonstrate a moderate baseline sprouting rate, while VEGF, serving as the positive control, ideally doubles or, preferably, triples the RSL compared to the controls (Figure 2D, left graph). The number of sprouts should also show a similar dynamic range (Figure 2D, right graph). A technical suboptimal assay will not show this dynamic range between controls and could, therefore, lead to a false interpretation of data (Figure 2E).
Analog to 2D stainings, examination of the slides under a fluorescence microscope and critical assessment of the stained structures are of great importance for successful staining (Figure 2F). If the cellular localization of the structures and the signal intensity in comparison to the control is comprehensible, it can be assumed that the staining was successful.
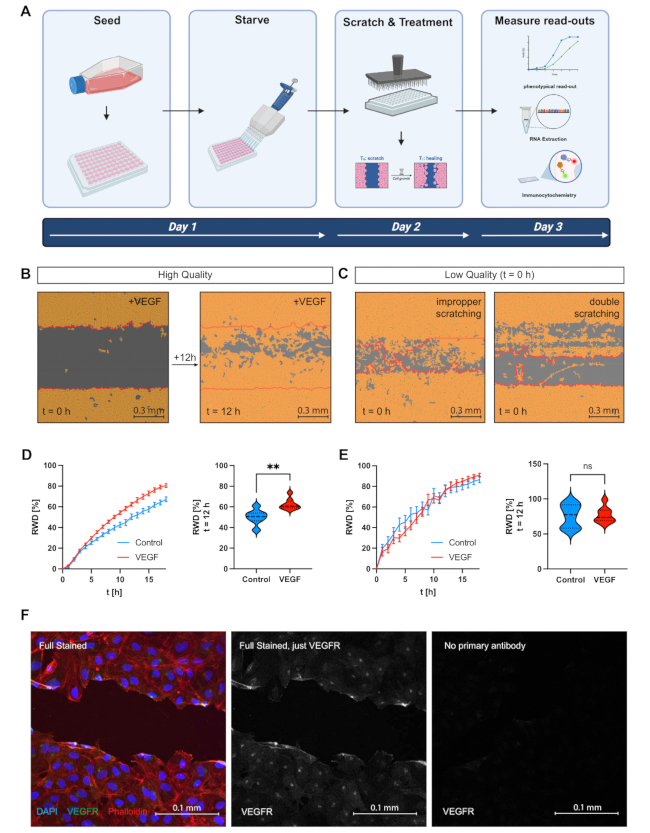
Figure 1: The live-cell imaging scratch wound migration assay. (A) Scheme of the scratch wound migration assay. (B) Images showcasing a high-quality technical replicate at t = 0 h and t = 12 h. Cells have been stimulated with 25 ng/mL VEGF to serve as a positive control. (C) Examples of two low-quality technical replicates at t = 0 h due to improper scratching or double scratching. (D) Results of a successful scratch wound migration assay. The correct separation of positive control stimulated with 25 ng/mL VEGF and negative control just treated with basal medium was further visualized by a violin plot at t = 12 h. Data include 7-8 technical replicates per group. (E) Exemplary results highlighting a failed Scratch Wound Migration Assay. Suboptimal separation of positive control stimulated with 25 ng/mL VEGF and negative control just treated with basal medium was visualized by a violin plot at t = 12 h. Data include 7-8 technical replicates per group. (F) Exemplary images of HUVECs seeded on coverslips and stained for DAPI, phalloidin, and VEGF-R2. Please click here to view a larger version of this figure.
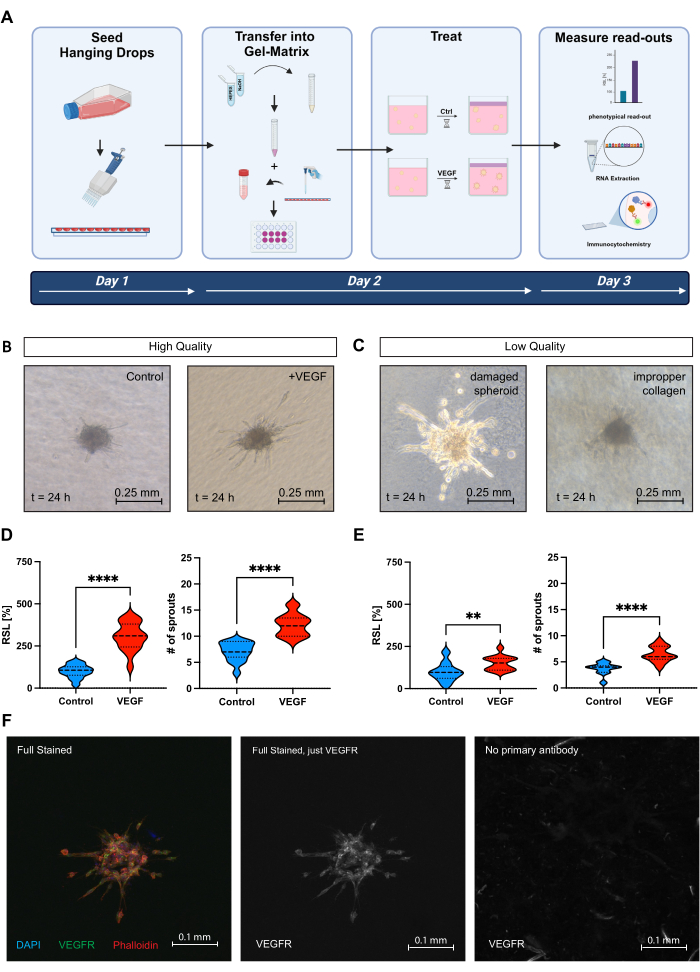
Figure 2: The spheroid sprouting assay. (A) Scheme of the spheroid sprouting assay. (B) Images showcasing the negative control (basal medium stimulated spheroids) and positive control (VEGF 25 ng/mL stimulated spheroids) of an ideal technical assay at the end at t = 24 h. (C) Examples of two low-quality spheroids at t = 24 h. Left images visualize a damaged spheroid that dropped to the bottom of the plate, which results in a loosened spheroid body and an abnormally enhanced sprouting rate. The right image visualizes collagen with noticeable color patches, creating a highly heterogeneous environment that significantly compromises the assay's quality. (D) Analysis of the RSL (left graph) and number of sprouts (right graph) of a successful assay with a good dynamic range between negative and positive control. Data is visualized using a violin plot and includes 10-25 spheroids per group. (E) Analysis of the RSL (left graph) and number of sprouts (right graph) of a technical problematic assay with a suboptimal dynamic range between negative and positive control. Data is visualized using a violin plot and includes 10-25 spheroids per group. (F) Exemplary images of HUVECs from the spheroid sprouting assay stained for DAPI, phalloidin, and VEGF-R2.c
Supplementary File 1: Instructions for preparing the methocel stock solution. Please click here to download this File.
Supplementary File 2: SpheroidCount.ijm plugin. Please click here to download this File.
In this report, we presented a spectrum of techniques with functional and molecular readouts to study angiogenesis in vitro.
The migration assay represents a well-established technique used across all fields of wet laboratory work. We chose the commercially available live-cell imaging approach to take advantage of the 96-well format suitable for screening and dose-response experiments, the standardized and reproducible wound size created by the WoundMaker tool, the opportunity to observe the migration kinetic through time-lapse imaging over up to 24 h as well as the automated image quantification software. However, the presence of a life-cell imaging system equipped with angiogenesis analysis software in the lab or a core facility is needed. Numerous alternative experimental setups have been established that do not necessitate specific live-cell imaging microscopes or other special equipment10.
Based on our experience, it is crucial to optimize the analyzer settings, as HUVECs and other vascular endothelial cell types can tend to provide poor contrast, thereby hindering the automated readout by the microscope software. To address this issue, an additional fluorescence staining step (e.g., live-cell staining) can be introduced. Live-cell imaging systems support such staining and even multi-color staining for tracking a protein of interest. One major limitation of the assay is that differentiation between cell migration and proliferation is not always straightforward and that assay results represent a combination of both processes. The live cell imaging solution used in this study tries to tackle this issue by introducing the relative wound density (RWD). In contrast to traditionally used confluence in the scratched area, the RWD assesses the confluence within the scratched area relative to the outside scratched area. Migration in the scratched area elevates the RWD by increasing confluence within it while concurrently reducing confluence outside the scratched area due to cell migration. Conversely, cell proliferation also increases confluence outside the scratched area, thereby decreasing RWD. It is important to recognize this as a strategic analysis approach to only lessen the impact of proliferation on the final readout. Complementary proliferation assays may be needed to address that issue. Alternatively, cell cycle inhibitors such as mitomycin C can be added to the assay to block proliferation. Implementing protocols with these inhibitors needs to be carefully optimized in each lab to achieve the desired effect without reducing the dynamic range of the assay. Furthermore, by increasing the scanning frequency of each well, this setup offers an easily implementable opportunity to precisely track moving cells on an individual level if such detailed tracking is of particular interest.
While the live-cell imaging migration assay demonstrates the advantage of scalability and automated, unbiased analyses, our previous study highlighted the spheroid sprouting assay’s ability to capture more intricate details of angiogenesis. This includes fundamental aspects like tip and stalk cell formation, cell-matrix interaction, and a glycolytic switch12. To guarantee assay reproducibility, an investigator must be experienced in preparing the collagen matrix, as variations in pH and temperature during this process can impact results. Furthermore, the analysis is conducted manually. Image analysis is hence time consuming and contains the risk for bias. Proper masking of conditions during analysis is essential to prevent the introduction of bias. To address this concern, we recently proposed a neural network-based approach to identify and mitigate potential bias in the analysis of sprouting assays, which can be easily implemented17. In conclusion, the best approach to validate results is to combine both assays. However, it is crucial to acknowledge that differences may arise due to the distinct nature of 2D and 3D settings12.
As there is a wide selection of 2D and 3D in vitro angiogenesis assays, it is important to consider the advantages and disadvantages of the presented assays compared to other methods. The scratch wound assay, for example, focuses on the 2D horizontal migration on a plastic dish, while the Boyden chamber assay characterizes vertical migration through a mesh insert with a chemoattractant in the “outer chamber”. Based on its simple setup and readout, the scratch wound assay allows for high-throughput experiments, particularly in its 96-well format, providing high reproducibility as well as the possibility of visualizing the experiment and conducting a time-lapse. Unfortunately, the disadvantages of the scratch wound assay are the difficulty in differentiating between proliferation and migration, the need for adherent cells, and, in the absence of a wound-maker tool, higher variability due to unequal scratches. The readout of the Boyden Chamber Assay has the advantage of measuring the chemotactic effect of soluble substances on motile cells18 and highlights both invasion and migration. Unfortunately, disadvantages are the poor reproducibility and high variance of the assay, the inability to visualize the movement of the cells, the high number of migrated cells required to obtain a signal, the quite long and elaborate setup and readout, as well as the lack of the opportunity for a time-lapse setting19.
The spheroid sprouting assay quantifies the sprouting of endothelial cells into a 3D gel matrix, while the tube formation assay characterizes the formation of cellular tubes on the surface of a gel matrix20. The sprouting assay has the advantage of characterizing the invasion of cells into a matrix as well as proliferation and migration. Disadvantages are the higher variance of the titrated collagen gel and, based on this, the quality of spheroids. The advantage of the tube formation assay is the formation of vascular tubes after a distinct amount of time (dependent on the cytokine) and an easy approach. Disadvantages are the lack of invasion of cells and the effect of the Matrigel itself on tube formation21.
All of the presented experiments were performed with HUVECs. It is well-known that significant differences in the behavior of vascular endothelial cells from different origins (e.g., macro-vascular vs. micro-vascular) exist22,23. It may thus be necessary to validate experimental results with other vascular endothelial cell lines. The experimental settings were transferrable for human retinal microvascular endothelial (HRMVECS), except for the fact that HRMVECs require higher FBS concentrations. On the other hand, the commonly used bovine aortic endothelial cell line (BAECs) could not be used in the spheroid sprouting assay due to an excessive basal sprouting rate.
Both presented assays share the limitation that they are confined to a single cell type. Given that angiogenesis in vivo is an intricate multicellular process, this crucial aspect is not accurately captured by either assay. Co-culture variations for both assays have been developed, with a particular focus on the spheroid sprouting assay, and recently discussed10,24. Alternatively, validating the data directly in relevant in vivo angiogenesis models represents a viable option. Established assays for this purpose include the mouse model for oxygen-induced retinopathy (OIR)25, the laser-induced choroidal neovascularization (Laser-CNV) model26, and the plug assay27.
Overall, both the 2D live-cell imaging migration assay and the 3D spheroid sprouting assay, in conjunction with the presented molecular analysis tools, offer a robust platform for angiogenesis research and are widely recognized within the angiogenesis community. Combining these assays with subsequent in vivo analyses to validate findings provides a solid foundation for investigating specific angiogenesis-related questions.
The authors have nothing to disclose.
The authors thank Sophie Krüger and Gabriele Prinz for their excellent technical support. We thank Sebastian Maier for developing the ImageJ plugin to quantify spheroid sprouts and the Lighthouse Core Facility, Zentrum für Translationale Zellforschung (ZTZ), Department of Medicine I, University Hospital Freiburg for the use of the IncuCyte system. The graphics were created with biorender.com. This work was supported by the Deutsche Forschungsgemeinschaft [Bu3135/3-1 + Bu3135/3-2 to F.B], the Medizinische Fakultät der Albert-Ludwigs- Universität Freiburg [Berta-Ottenstein-Program for Clinician Scientists and Advanced Clinician Scientists to F.B.], the Else Kröner-Fresenius-Stiftung [2021_EKEA.80 to F.B.] the German Cancer Consortium [CORTEX fellowship for Clinician Scientists to J.R.] and the Volker Homann Stiftung [to J.N.+F.B.] and the "Freunde der Universitäts-Augenklinik Freiburg e.V." [to P.L.]
10x Medium 199 | Sigma-Aldrich | M0650 | |
2-(4-(2-Hydroxyethyl)1-piperazinyl)-ethan-sulfonsäure | PAN-Biotec | P05-01100 | HEPES |
Alexa Fluor 647-conjugated AffiniPure F(ab)‘2-Fragment | Jackson IR | 115-606-072 | |
Axio Vert. A1 | Zeiss | ||
CapturePro 2.10.0.1 | JENOTIK Optical Systems | ||
Collagen Type 1 rat tail | Corning | 354236 | |
Collagenase D | Roche | 11088858001 | |
Endothelial Cell Basal Medium | Lonza | CC-3156 | EBM |
Endothelial Cell Growth Medium | Lonza | CC-3162 | EGM |
Ethylenediaminetetraacetic acid | Serva | 11290.02 | EDTA |
Fetal bovine serum | Bio&SELL | S 0615 | FBS |
Human Umbilical Vein Endothelial Cells, pooled | Lonza | C2519A | HUVEC |
IncuCyte ImageLock 96-well plates | Sartorius | 4379 | |
Incucyte S3 Live-Cell Analysis System | Sartorius | ||
Methocel | Sigma | m-0512 | |
Microvascular Endothelial Cell Medium with 10% FBS | PB-MH-100-4090-GFP | PELOBiotech | |
NaOH | Carl Roth | P031.2 | |
Phalloidin-Fluorescein Isothiocyanate Labeled (0.5 mg/mL Methanol) | Sigma-Aldrich | P5282-.1MG | Phalloidin-FITC |
Phosphate-buffered saline | Thermo Fisher Scientfic | 14190-094 | PBS |
Primary Human Retinal Microvascular Endothelial Cells | Cell Systems | ACBRI 181 | |
ProLong Glass Antifade Mountant with NucBlue | Invitrogen by ThermoFisher Scientific | 2260939 | |
QIAzol Lysis Reagent | QIAGEN | 79306 | |
recombinant human Vascular Endothelial Growth Factor | PeproTech | 100-20 | VEGF |
Squared petri dish | Greiner | 688102 | |
Trizol | Qiagen | 79306 | |
Trypsin | PAN-Biotec | P10-024100 | |
VEGF-R2 (monoclonal) | ThermoFisher Scientific Inc. | B.309.4 | |
WoundMaker | Sartorius | 4493 |
.