A phase diagram combines plots of pressure versus temperature for the liquid-gas, solid-liquid, and solid-gas phase-transition equilibria of a substance. These diagrams indicate the physical states that exist under specific conditions of pressure and temperature and also provide the pressure dependence of the phase-transition temperatures (melting points, sublimation points, boiling points). Regions or areas labeled solid, liquid, and gas represent single phases, while lines or curves represent two phases coexisting in equilibrium (or phase change points). The triple point indicates conditions of pressure and temperature at which all three phases coexist. In contrast, a critical point indicates the temperature and pressure above which a single phase—whose physical properties are intermediate between the gaseous and liquid states—exists.
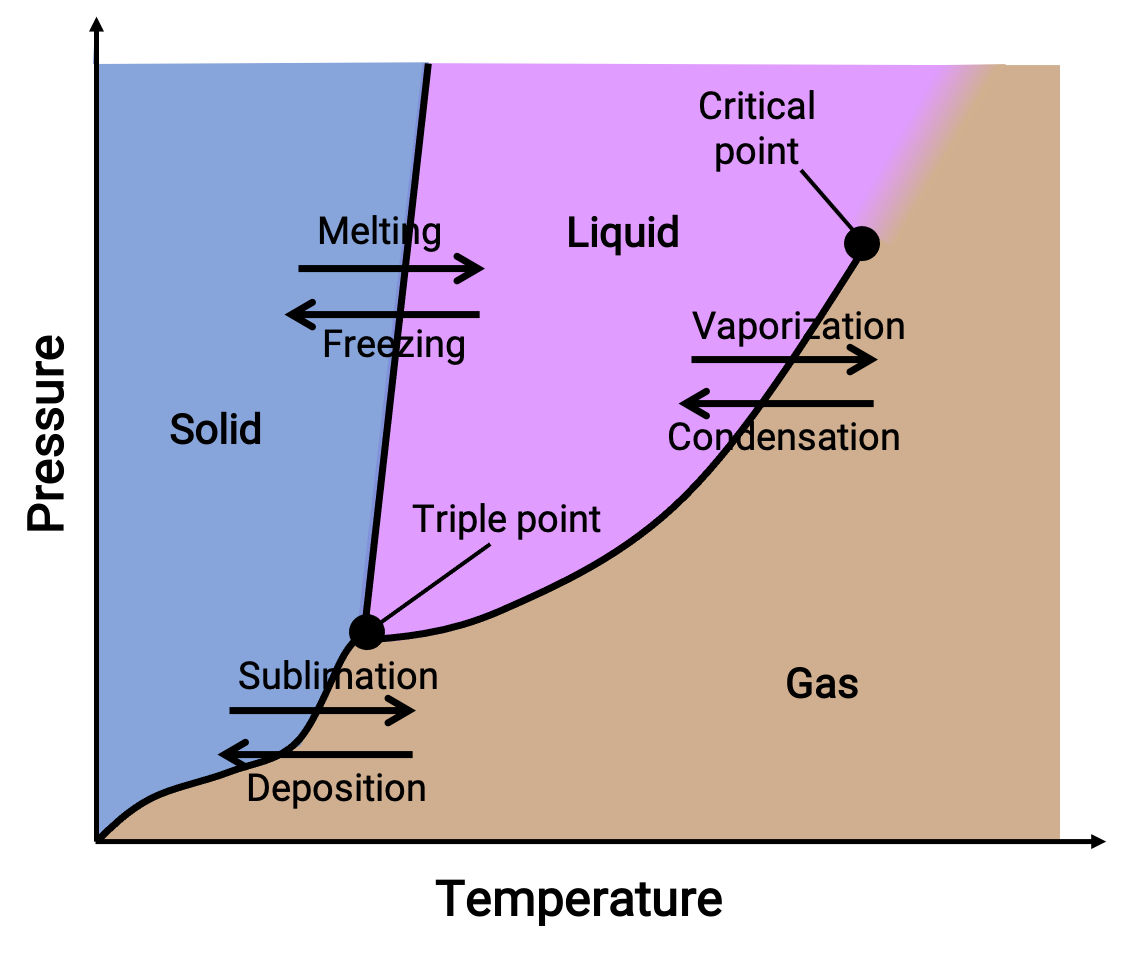
Figure 1. A typical phase diagram.
A phase diagram identifies the physical state of a substance under specified conditions of pressure and temperature. To illustrate the utility of these plots, consider the phase diagram of water, shown below.
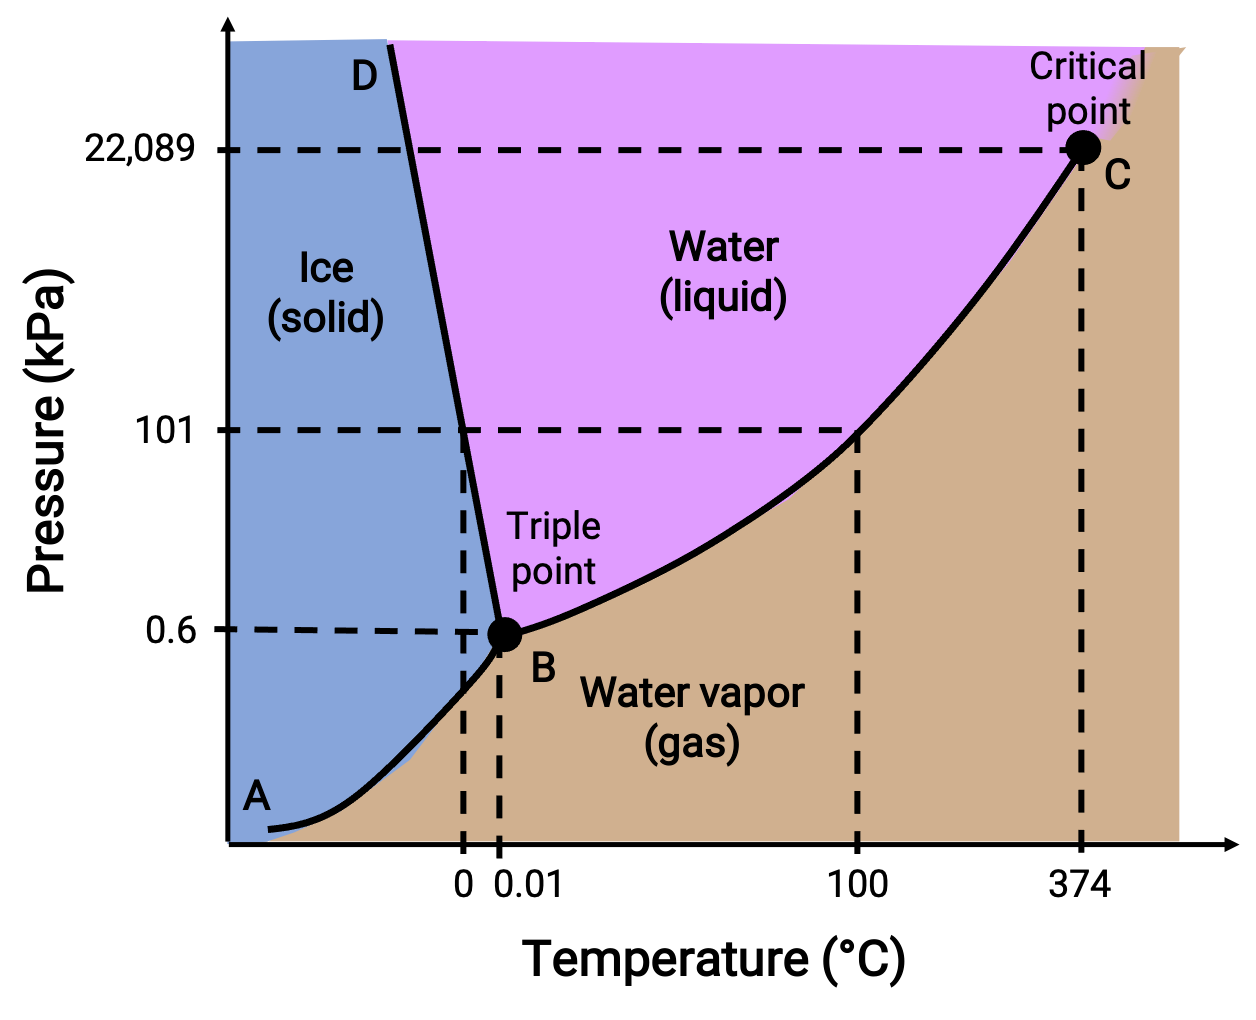
Figure 2. Phase diagram of water.
A pressure of 50 kPa and a temperature of −10 °C corresponds to the region of the diagram labeled “ice.” Under these conditions, water exists only as a solid. A pressure of 50 kPa and a temperature of 50 °C corresponds to the region where water exists only as a liquid. At 25 kPa and 200 °C, water exists only in the gaseous state. Curve BC is the liquid-vapor curve separating the liquid and gaseous regions of the phase diagram and provides the boiling point for water at any pressure. For example, at 1 atm, the boiling point is 100 °C. Notice that the liquid-vapor curve terminates at a temperature of 374 °C and a pressure of 218 atm, indicating that water cannot exist as a liquid above this temperature, regardless of the pressure. The physical properties of water under these conditions are intermediate between those of its liquid and gaseous phases. This unique state of matter is called a supercritical fluid. The solid-vapor curve labeled AB, indicates the temperatures and pressures at which ice and water vapor are in equilibrium. These temperature-pressure data pairs correspond to the sublimation, or deposition, points for water.
The solid-liquid curve labeled BD shows the temperatures and pressures at which ice and liquid water are in equilibrium, representing the melting/freezing points for water. Note that this curve exhibits a slight negative slope, indicating that the melting point for water decreases slightly as pressure increases. Water is an unusual substance in this regard, as most substances exhibit an increase in melting point with increasing pressure. The point of intersection of all three curves—labeled B—is the triple point of water, where all three phases coexist in equilibrium. At pressures lower than the triple point, water cannot exist as a liquid, regardless of the temperature.
Consider the phase diagram for carbon dioxide as another example.
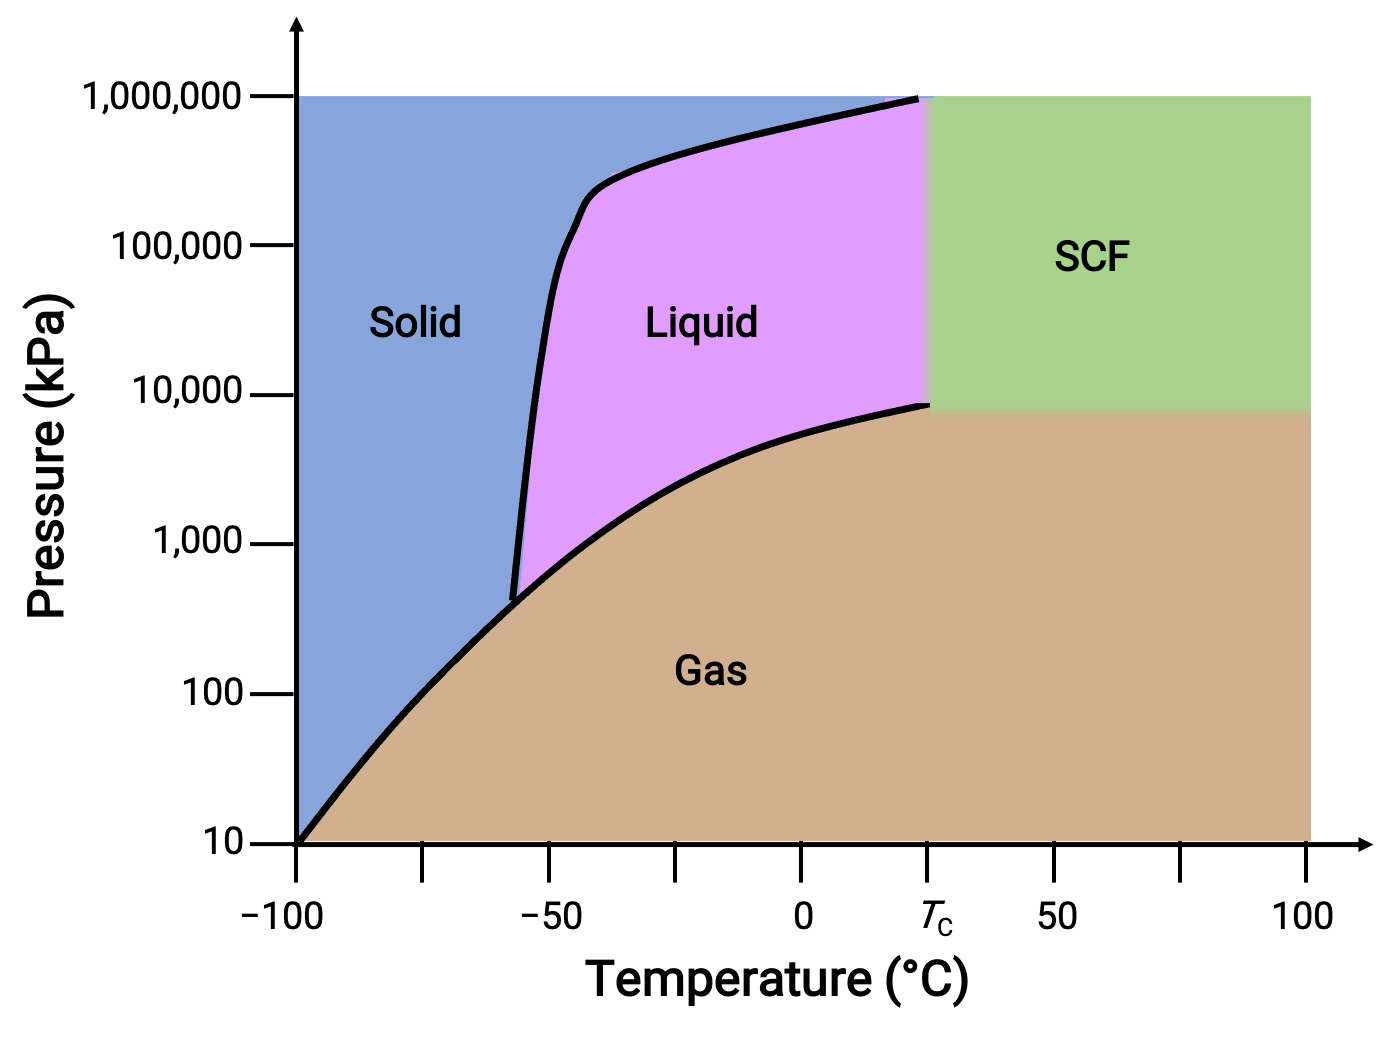
Figure 3. Phase diagram of carbon dioxide.
The solid-liquid curve exhibits a positive slope, indicating that the melting point for CO2 increases with pressure as it does for most substances. Notice that the triple point is well above 1 atm, indicating that carbon dioxide cannot exist as a liquid under ambient pressure conditions. Instead, cooling gaseous carbon dioxide at 1 atm results in its deposition into the solid-state. Likewise, solid carbon dioxide does not melt at 1 atm pressure but instead sublimes to yield gaseous CO2. Finally, the critical point for carbon dioxide is observed at a relatively modest temperature and pressure in comparison to water.
This text is adapted from Openstax, Chemistry 2e, Section 10.4: Phase Diagrams.