In this study, we developed a low-cost surface-enhanced Raman scattering (SERS)-based fingerprint nanoprobe with favorable biocompatibility to show label-free live cell bioimaging and detect two bacterial strains, showing in detail how to get SERS spectra of living cells in a non-destructive method.
Surface-enhanced Raman scattering (SERS) technology has attracted more and more attention in the biomedical field due to its ability to provide molecular fingerprint information of biological samples, as well as its potential in single-cell analysis. This work aims to establish a simple strategy for label-free SERS bioanalysis based on Au@carbon dot nanoprobes (Au@CDs). Here, polyphenol-derived CDs are utilized as the reductant to rapidly synthesize core-shell Au@CD nanostructures, which allows powerful SERS performance even when the concentration of methylene blue (MB) is as low as 10-9 M, due to the cooperative Raman enhancement mechanism. For bioanalysis, Au@CDs can serve as a unique SERS nanosensor to identify the cellular components of biosamples (e.g., cancer cells and bacteria). The molecular fingerprints from different species can be further distinguished after combination with the principal component analysis. In addition, Au@CDs also enable label-free SERS imaging to analyze intracellular composition profiles. This strategy offers a feasible, label-free SERS bioanalysis, opening up a new prospect for nanodiagnosis.
Single-cell analysis is essential for the study of revealing cellular heterogeneity and assessing the comprehensive state of the cell. The cell's instant response to the microenvironment also warrants single-cell analysis1. However, there are some limitations to the current techniques. Fluorescence detection can be applied to single-cell analysis, but it's limited by low sensitivity. Other challenges arise from the complicated fluorescence background of cells and the fluorescence photobleaching under long-term irradiation2. Surface-enhanced Raman scattering (SERS) may qualify in terms of single-cell analysis owing to its advantages, including (1) reflecting the intrinsic molecular fingerprint information and the instantaneous situation, (2) ultrahigh surface sensitivity, (3) convenient multiplex detection, (4) high photostability, (5) detection can be quantified for comparative analysis, (6) avoiding cellular autofluorescence with the NIR wavelength excitation, (7) detection can be performed in a cellular aqueous environment, and (8) detection can be directed to a specific region within the cell3,4,5.
There are two broadly recognized mechanisms to understand SERS as a fundamental phenomenon: electromagnetic enhancement (EM) as a dominant reason and chemical enhancement (CM). EM refers to, in a given frequency of the exciting field, the oscillation of collective electrons driven by electromagnetic waves when the frequency of the incident light matches the frequency of free electrons oscillating in the metal, giving rise to surface plasmon resonance (SPR). When localized SPR (LSPR) occurs through the incident laser impinging at the metal nanoparticles (NPs), it leads to the resonant absorption or scattering of the incident light. Consequently, the surface electromagnetic field intensity of metal NPs can be enhanced by two to five orders4. However, the key to the huge enhancement in SERS is not a single metal NP, but the gap between two NPs, which creates hot spots. CM is generated from two sides, including (1) interactions between target molecules and metal NPs and (2) target molecules being able to transfer electrons to/from metal NPs4,5. More exhaustive details can be found in these review articles4,5. Several promising methods for SERS biosensing and imaging in living cells have been presented in previous literature, for example, the detection of apoptotic cells6, proteins in organelles7, intracellular miRNAs8, cellular lipid membranes,9cytokines10, and metabolites11 in living cells, as well as the identification and monitoring of cells by confocal SERS imaging2,11,12,13. Interestingly, label-free SERS presents the unique advantage of SERS, which can describe internal molecular spectra5.
A major issue for label-free SERS is a rational and reliable substrate. Typical SERS substrates are noble metal NPs because of their excellent capacity to scatter a lot of light14. Nowadays, more and more attention is paid to nanocomposites due to their remarkable physical and chemical properties and biocompatibility. More significantly, nanocomposites can show better SERS activity because of the intense EM induced by the hot spots on the nanohybrids and additional chemical enhancement originating from other non-metal materials15. For example, Fei et al. used MoS2quantum dots (QDs) as reducers to synthesize Au NP@MoS2 QD nanocomposites for label-free near-infrared (NIR) SERS imaging of mouse 4T1 breast cancer cell (4T1 cells)16. Also, Li et al. fabricated a 2D SERS substrate consisting of Au NPs and 2D hafnium ditelluride nanosheets for label-free SERS measurements of foodborne pathogenic bacteria17. Recently, carbon dots (CDs), good electron donors, have been used as reductants without other reductants or irradiation to synthesize Au@carbon dot nanoprobes (Au@CDs)18, which have been reported to be efficient materials to enhance SERS activity based on the charge-transfer (CT) effect between Au cores and CD shells19,20. More than that, CDs are recognized as the capping agent and a stabilizer to prevent Au NPs from aggregating21. In addition, it opens up more possibilities for reactions with analytes, as it can provide a large number of binding and active sites20. Taking advantage of the above, Jin et al. developed a fast and controllable method for fabricating Ag@CD NPs with unique SERS properties and excellent catalytic activities for monitoring heterogeneous catalytic reactions in real time18.
Herein, a facile and low-cost method for fabricating core-shell Au@CD SERS substrates to identify cellular components and label-free SERS live cell bioimaging, as well as to detect and differentiate Escherichia coli (E. coli) and Staphylococcus aureus (S. aureus) was demonstrated, which holds promise for the early diagnosis of disease and a better understanding of cellular processes.
1. Fabrication of Au@CDs
NOTE: Figure 1 illustrates a fabrication procedure for Au@CDs.
2. Characterization of Au@CDs
3. Cell culture
4. Cell SERS experiments
5. Bacterial culture and SERS measurements
6. Data analysis
Fabrication of the Au@CDs is illustrated in Figure 1. The CDs were prepared from CA and GA via a typical hydrothermal process18. Au@CDs were rapidly synthesized by reducing HAuCl4 by CDs in aqueous media at room temperature. The size and morphology of CDs and Au@CDs can be observed by TEM and high-resolution (HR)TEM23. The prepared CDs are monodispersed with small sizes of nearly 2-6 nm (Figure 2A). The spherical Au nucleus is coated with a layer of CD shell of about 2.1 nm (Figure 2B,C and Supplementary Figure 1).
To confirm the structures of CDs and Au@CDs, FT-IR spectra were recorded to analyze the organic functional groups (Figure 2D). The band at 3,000-3,600/2,500-2,800 cm-1, 1,251/1,629 cm-1, and 1,471 cm-1 can be assigned to O-H stretching vibration, C=O stretching vibration, and C-O stretching vibration, respectively24,25. Also, the stretching vibrational band at 1,741 cm-1 is related to C-C24. A few of these functional groups from GA and CA are also present in CDs and Au@CDs, suggesting the successful synthesis of NPs. UV-vis absorption spectra of CDs have a characteristic peak at 265 nm, indicating an isolated aromatic structure in the carbon cores26, which disappears upon reduction. The spectrum of Au@CDs exhibits a characteristic peak at 545 nm, which is associated with the SPR absorption band of the Au nucleus, indicating fabrication of the composite nanostructure (Figure 2E).
As shown in Figure 3A,B, even when the concentration of MB is as low as 10-9 M, Au@CDs exhibit excellent SERS performance compared to Au NPs. The enhancement factor (EF) can be calculated by the following equation16, where ISERS and I0 refer to the Raman intensities of the SERS spectrum and normal Raman, respectively, and CSERS and C0 refer to the concentrations of the substrate molecules used for SERS and Raman measurements, respectively. Taking 1,620 cm-1 of MB to calculate, the EF of Au@CDs is nearly 2.1 × 10⁵, which is about three times stronger than that of the Au NPs (6.8 × 10⁴).
A few characteristic peaks can be detected, such as 770 cm-1 (in-plane bending of C-H), 1,398 cm-1 (symmetric stretching of C-N), and 1,625 cm-1 (C-C ring stretching), which is consistent with reported literature27. At the same time, 10-5 M to 10-9 M of MB are detected, taking the SERS band at 1,620 cm-1 for quantification; the linear relationship is defined as y = 0.2437x + 2.1756 (R2 = 0.9922) (Figure 3B). In addition to sensitivity, reproducibility and long-term stability are both significant indicators for SERS substrates. Therefore, SERS spectra were acquired on 20 points randomly, exhibiting high similarity among them (Figure 3C,D); four spectra were collected during 1 month, the characteristic peaks of MB were still detected 1 month after placement at 4 °C, and the average SERS activity at 950 cm-1, 1,185 cm-1, and 1,620 cm-1 only showed a degree of decay of about 5.43%, 11.44%, and 13.94%, respectively (Figure 3E), indicating the good reproducibility and long-term stability of Au@CD substrates.
In the present cell SERS measurements, firstly, the cytotoxicity of the NPs was tested. Au@CDs (20-100 µM) barely showed cytotoxicity to A549 cells (Figure 3F). The above results suggest the high potential of Au@CDs to be applied to label-free SERS measurements in living cells. As shown in Figure 4, the Au@CD-assembled SERS substrate provides integrated SERS mapping of the cellular components from 800 to 1,700 cm-1. It has been observed that Au@CD NP aggregates exhibit obvious SERS signals without noise background in the SERS mapping of A549 cells (Figure 4B). Three spectra from different cell points are shown in Figure 4C, demonstrating the heterogeneity of components in various cytoplasmic regions and the superiority of the Au@CDs as SERS probes for single-cell analysis. The mean spectrum of A549 cells is shown in Figure 4A, and abundant cellular information can be observed. Detailed characteristic peak assignments are provided in Table 1.
In addition, Au@CDs also demonstrate a good ability to detect and differentiate two bacterial strains. The spectra obtained are quite similar to the published literature for E. coli and S. aureus, such as phenylalanine at 1,030 cm-1 and a ring breathing of nucleic acid at 741 cm-1 (Figure 5A, B), which verifiesthe reliability of SERS measurements28. Detailed characteristic peak assignments28,29,30,31 are provided in Table 2. The PCA model also discriminates well (Figure 5C,D).
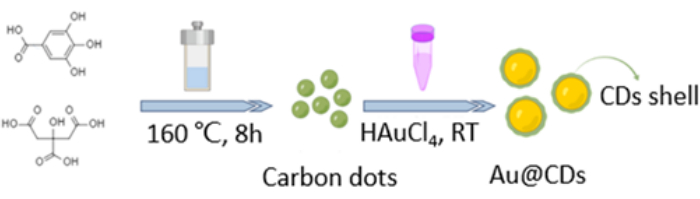
Figure 1: Schematic illustration of the synthesis pathway of the Au@CDs. Please click here to view a larger version of this figure.
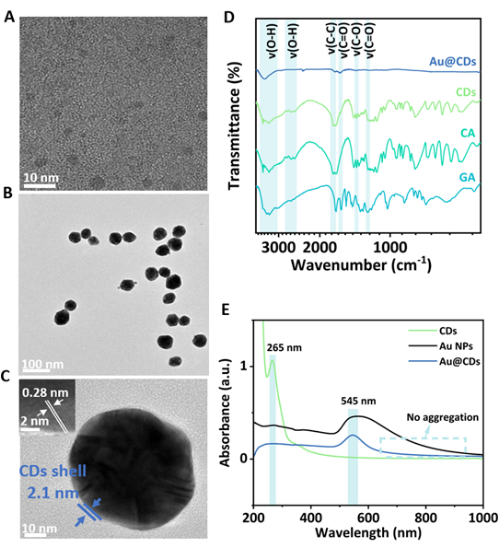
Figure 2: Representative characterization of CDs and Au@CDs. (A) HRTEM image of CDs. Scale bar: 10 nm. (B) TEM image of Au@CDs. Scale bar: 100 nm. (C) HRTEM image of the interface region of Au@CDs. Scale bar: 10 nm; inset: 2 nm. (D) FT-IR spectra of raw GA, CA, and as-prepared CDs and Au@CDs. (E) UV-vis absorption spectra of CDs, Au NPs, and Au@CDs. Please click here to view a larger version of this figure.
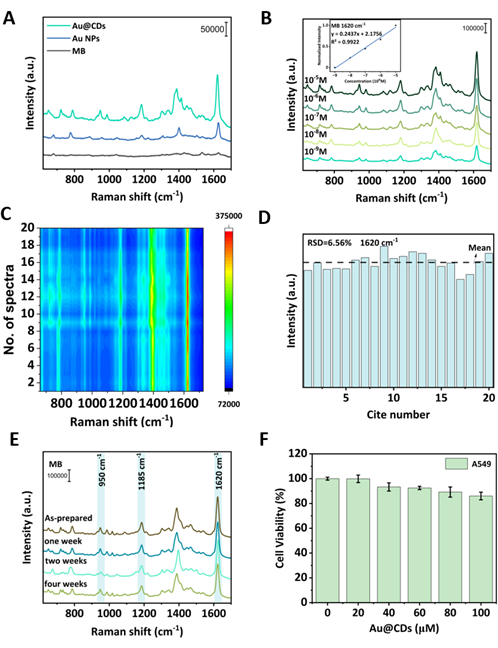
Figure 3: SERS activities of Au@CDs. (A) SERS spectra of bulk MB (10-5 M, black line) and the 10-9 M MB (blue line and green line) solution. (B) SERS spectra of MB at different concentrations (10-9-10-5 M). Insert: The linear relationship of the SERS band at 1,620 cm-1 of MB, y = 0.2437x + 2.1756 (R2 = 0.9922). Results of SERS substrate reproducibility (C), relative standard deviation (RSD) histogram (1,620 cm-1 peak of MB at 10-7 M) (D), and long-term stability (E) experiments. (F) Cell viabilities of A549 cells after 24 h of incubation with the Au@CD concentration gradient. Please click here to view a larger version of this figure.
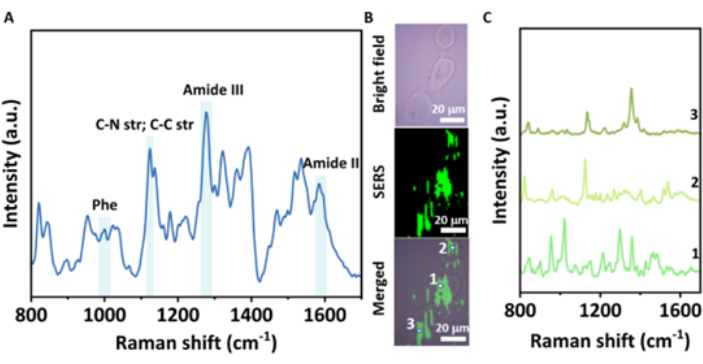
Figure 4: Fingerprint analysis and label-free SERS imaging of A549 cells. (A) Mean SERS spectrum of A549 cells. (B) The bright field, SERS mapping, and merged images of the A549 cells. Scale bars: 20 µm. (C) SERS spectra of different cell points marked in the merged image of 1, 2, and 3. Please click here to view a larger version of this figure.
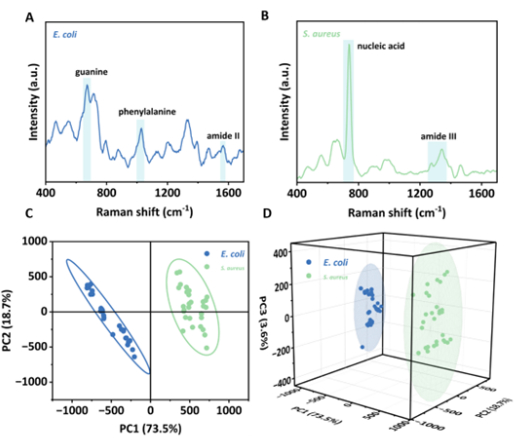
Figure 5: Fingerprint analysis of two bacterial strains. The mean SERS spectra of E. coli (A)and S. aureus (B). The 2D PCA (C) and 3D PCA (D) on the differential analysis of two bacterial strains. Please click here to view a larger version of this figure.
Table 1: Assignments for the Raman peaks of A549 cells. Abbreviations: Pro = proline; HYP = hydroxyproline; Tyr = tyrosine; Trp = trypotophan; Phe = phenylalanine; A = adenine; T = thymine; C = cytosine; G = guanine; bend = bending; str = stretching; def = deformation; twist = twisting; breath = breathing; wag = wagging; sym = symmetrical; asym = asymmetrical; bk = backbone. Please click here to download this Table.
Table 2: Assignments for the Raman peaks of E. coli and S. aureus. Abbreviations: Tyr = tyrosine; Phe = phenylalanine; A = adenine; G = guanine; str = stretching; def = deformation; breath = breathing; sym = symmetrical. Please click here to download this Table.
Supplementary Figure 1: Dynamic light scattering study of Au@CDs. Please click here to download this File.
In summary, Au@CDs with an ultrathin CD shell of 2.1 nm have been successfully fabricated. The nanocomposites show superior SERS sensitivity than pure Au NPs. Also, Au@CDs possess excellent performance in reproducibility and long-term stability. Further research includes taking Au@CDs as substrates to perform SERS imaging of A549 cells31 and to detect two bacterial strains32. It has been proved that Au@CDs can be used as an ultrasensitive SERS probe mainly based on the chemical enhancement between Au NPs and CDs.
There are a few key points during SERS measurements in the previous protocol. Firstly, before Au@CDs are applied in cells and bacterial samples, it's necessary to ensure a superior SERS substrate formula as well as the right concentration, which can be verified by dye molecules. Subsequently, the SERS spectrum is inconsistent at every cellular point because the biological samples are complex and dynamic.
If taking a bigger laser spot, the SERS spectrum from different points will be more similar. Of note, the SERS spectrum of the same cellular point may not be in accordance with different laser power. It's well accepted that the average SERS spectrum of biological samples is consistent; therefore, it's critical to obtain the SERS spectrum in the same cellular regions as much as possible and then to average several different cellular regions. In addition, intracellular SERS detection sensitivity is easily affected by background signals. The Raman background signals mainly come from three aspects, including (1) a substrate, such as sapphire, silicon wafer, and so on, (2) a SERS probe, and (3) biological samples. Consequently, it is recommended to choose substrates without background noise whenever possible, although this is difficult.
Compared to conventional Raman spectroscopy, SERS can substantially improve the signal intensity by several orders of magnitude33. In this work, gold was chosen for the fabrication of composite NPs because it possessed a better ability to optimize the size and shape, being less cytotoxic as well as more chemically inert and robust than silver34. Meanwhile, CD shells attached to Au surfaces can reduce the interactions between cells and metal NPs33. In conclusion, the above results demonstrated label-free SERS as a noninvasive and non-destructive technique, which can provide an intrinsic chemical composition of analytes on a single-cell level35.
Previous studies have shown that it is essential to control the appropriate detection environment and time in case of distortion of native fingerprint information5. Therefore, it's essential to make sure there is no damage on the cells, with the aim of obtaining reliable spectra. Other challenges include: (1) for intracellular SERS measurements, SERS-active Au NPs may interact with intracellular components such as proteins, lipids, or nucleic acids4. Therefore, biocompatibility and SERS signal assignments need to be considered; (2) constant laser exposure during SERS detection may damage the cell cytotoxicity or biosamples; and (3) as shown in Figure 5A,B, the portable SERS platform still has some limitations-either Raman intensity or signals that can be detected is not good as what is shown in Figure 4.
In addition, when combined with other technologies such as droplet microfluidics36, deep learning37, machine learning38, catalytic hairpin assembly amplification technology39, and fluorescence technology40, these integrated strategies can develop the superiority of SERS.
The authors have nothing to disclose.
This work was supported by the National Natural Science Foundation of China (32071399 and 62175071), the Science and Technology Program of Guangzhou (2019050001), the Guangdong Basic and Applied Basic Research Foundation (2021A1515011988), and the Open Foundation of the Key Laboratory of Optoelectronic Science and Technology for Medicine (Fujian Normal University), Ministry of Education, China (JYG2009).
10x PBS buffer (Cell culture) | Langeco Technology | BL316A | |
6 well cell culture plate | LABSELECT | 11110 | |
Cell Counting Kit-8 (CCK-8) | GLPBIO | GK10001 | |
Citric acid | Shanghai Aladdin Biochemical Technology | C108869 | |
CO2 incubator | Thermo Fisher Technologies | 3111 | |
Constant temperature magnetic agitator | Sartorius Scientific Instruments | SQP | |
Cryogenic high speed centrifuge | Shanghai Boxun | SW-CJ-2FD | |
DMEM high glucose cell culture medium | Procell | PM150210 | |
Electronic balance | Sartorius Scientific Instruments | SQP | |
Enzyme marker | Thermo Fisher Technologies | 3111 | |
Fetal bovine serum | Zhejiang Tianhang Biological Technology | 11011-8611 | |
Figure 1 | Figdraw. | ||
Fourier infrared spectrometer | Thermo, America | Nicolet 380 | |
Freeze dryer | Tecan | Infinite F50 | |
Gallic acid | Shanghai Aladdin Biochemical Technology | G104228 | |
Handheld Raman spectrometer | OCEANHOOD, Shanghai, China | Uspectral-PLUS | |
HAuCl4 | Guangzhou Pharmaceutical Company (Guangzhou) | ||
High resolution transmission electron microscope | Thermo Fisher Technologies | FEI Tecnai G2 Spirit T12 | |
High temperature autoclave | Shanghai Boxun | YXQ-LS-50S | |
Inverted microscope | Nanjing Jiangnan Yongxin Optical | XD-202 | |
LB Broth BR | Huankai picoorganism | 028320 | |
Medical ultra-low temperature refrigerator | Thermo Fisher Technologies | ULTS1368 | |
Methylene blue | Sigma-Aldrich | ||
Pancreatin Cell Digestive Solution | beyotime | C0207 | |
Penicillin streptomycin double resistance | Shanghai Boxun | YXQ-LS-50S | |
Pure water meter | Millipore, USA | Milli-Q System | |
Raman spectrometer | Renishaw | ||
Sapphire chip | beyotime | ||
Thermostatic water bath | Changzhou Noki | ||
Ultra-clean table | Shanghai Boxun | SW-CJ-2FD | |
Uv-visible light absorption spectrometer | MADAPA, China | UV-6100S | |
Wire 3.4 | Renishaw |