This study describes a method to isolate and purify bacterial extracellular vesicles (BEVs) enriched from human feces via density gradient centrifugation (DGC), identifies the physical characteristics of BEVs from morphology, particle size, and concentration, and discusses the potential applications of the DGC approach in clinical and scientific research.
Bacterial extracellular vesicles (BEVs) are nanovesicles derived from bacteria that play an active role in bacteria-bacteria and bacteria-host communication, transferring bioactive molecules such as proteins, lipids, and nucleic acids inherited from the parent bacteria. BEVs derived from the gut microbiota have effects within the gastrointestinal tract and can reach distant organs, resulting in significant implications for physiology and pathology. Theoretical investigations that explore the types, quantities, and roles of BEVs derived from human feces are crucial for understanding the secretion and function of BEVs from the gut microbiota. These investigations also necessitate an improvement in the current strategy for isolating and purifying BEVs.
This study optimized the isolation and purification process of BEVs by establishing two density gradient centrifugation (DGC) modes: Top-down and Bottom-up. The enriched distribution of BEVs was determined in fractions 6 to 8 (F6-F8). The effectiveness of the approach was evaluated based on particle morphology, size, concentration, and protein content. The particle and protein recovery rates were calculated, and the presence of specific markers was analyzed to compare the recovery and purity of the two DGC modes. The results indicated that the Top-down centrifugation mode had lower contamination levels and achieved a recovery rate and purity similar to that of the Bottom-up mode. A centrifugation time of 7 h was sufficient to achieve a fecal BEV concentration of 108/mg.
Apart from feces, this method could be applied to other body fluid types with proper modification according to the differences in components and viscosity. In conclusion, this detailed and reliable protocol would facilitate the standardized isolation and purification of BEVs and thus, lay a foundation for subsequent multi-omics analysis and functional experiments.
The gut is widely recognized as the organ harboring the most abundant microbial communities in the human body, with over 90% of bacteria involved in colonization and multiplication1,2. Extensive evidence has demonstrated that the gut microbiota modulates the gut microenvironment and simultaneously interacts with dysfunction in distant organs, primarily through an impaired intestinal barrier3,4. Mounting evidence indicates a correlation between the imbalance of gut microbiota and the progression of inflammatory bowel disease (IBD)5,6, as well as cognitive disorders through the gut-brain axis5,6,7,8. Bacterial extracellular vesicles (BEVs) produced by bacteria play significant roles in these pathological processes.
BEVs are nanoscale particles encapsulating bacterial derivatives, with diameters ranging from 20 to 400 nm. They have been demonstrated to facilitate interactions between bacteria and their host organisms9,10. Despite their invisibility, these particles have garnered increasing attention from researchers due to their prospective broad applications as diagnostic biomarkers, therapeutic targets, and drug delivery vehicles11. Human feces, often used as biospecimens for studying BEVs, predominantly sourced from gut bacteria, contain a complex mixture of water, bacteria, lipids, proteins, undigested food residue, and exfoliated epithelial cells among others. The intricate fecal composition poses challenges to the isolation and purity of BEVs, thereby impeding a comprehensive, objective, and realistic analysis of BEVs. Hence, effective strategies to minimize interference from contaminating components and enhance the yield of BEVs have emerged as critical issues warranting immediate attention.
Existing isolation strategies largely rely on techniques such as ultra-high-speed centrifugation (UC), density gradient centrifugation (DGC), and size exclusion chromatography (SEC)12,13,14,15,16,17. Currently, DGC is one of the most widely applied methods in the field of BEV separation, encompassing two sedimentation-floating modes, "Top-down" and "Bottom-up", which are determined by the initial loading position of the sample. These methodologies differentiate extracellular vesicles (EVs) from other components based on size and density disparities, yielding variable purity and recovery rates. Prior research has indicated that single-approach strategies are insufficient for adequately separating EVs from soluble proteins in body fluid samples, such as lipoprotein in blood18 and Tamm-Horsfall protein in urine19. Additionally, the size distribution of eukaryotic extracellular vesicles (EEVs) often overlaps with that of BEVs, thereby necessitating further methodological enhancements to optimize BEV yield. Consequently, advancing the study of BEVs hinges on the development of effective separation and purification methodologies. Notably, Tulkens et al15 employed an orthogonal biophysical strategy to separate fecal BEVs from EEVs, in which the centrifugation time of a Bottom-up DGC mode was up to 18 h. In contrast, this study reduced it to 7 h, greatly saving the gradient-ultracentrifugation time and simplifying the process.
In the present study, we isolated and purified fecal BEVs employing two DGC modes under optimized buffer conditions, after enriching BEVs with a range of differential centrifugation speeds, from low to extremely high velocity. Evaluations based on morphology, particle size, and concentration indicated a commendable performance by this enhanced method. This study could serve as the foundation for future research, extending its applications to a broader domain, and offering insights into the heterogeneity of BEVs within the human body. It also contributes to the standardization of BEV separation and analysis techniques.
The Ethics Committee of Nanfang Hospital, Southern Medical University, sanctioned this study, which was conducted with the informed consent of the participants. All methods employed herein adhered to the standard operating guidelines furnished by the International Human Microbiome Standards (IHMS: http://www.microbiome-standards.org/). All subsequent liquid handling procedures were mandated to be carried out within a biosafety cabinet or an ultra-clean bench.
1. Collection and aliquoting of fecal samples
2. Feces sample preparation
3. Differential speed centrifugation
4. Ultra-high-speed centrifugation
5. Solution preparation for density gradient centrifugation
6. Establishment of a density gradient centrifugation system
7. Density gradient centrifugation and fraction collection
8. Characterization and quantitative analysis of the collected fractions
Determine the distribution of BEV-enriched fractions
To determine the distribution of bacterial extracellular vesicles (BEVs)-enriched fractions, a blank control was established to measure the absorbance values at OD 340 nm, and the density of each fraction was calculated based on the measurements and iodixanol guidelines (Step 8.1). Table 2 presents the density results, demonstrating that fractions F4 to F9 exhibited densities within the range typically associated with extracellular vesicles. This finding suggested that the majority of BEVs were isolated in these fractions, leading to the definition of F4-F9 as the rough range for BEVs. Transmission electron microscopy (TEM) was employed to characterize the morphological features of fecal BEVs isolated as shown in Figure 1 in fractions F4-F9. The TEM images (Figure 2) revealed the presence of classical cup-shaped structures, which are characteristic of BEVs. Nanoparticle tracking analysis (NTA) and bicinchoninic acid assay (BCA) were conducted to determine the particle number and protein concentration, respectively, allowing for further evaluation of recovery rates and purity. Figure 3 displays the protein and particle concentrations for each fraction, indicating that F6 and F7 exhibited the highest concentrations, followed by F5 and F8. Subsequently, Coomassie brilliant blue staining (CBBS) and western blotting (WB) were performed to provide an overall protein analysis. The results of CBBS were consistent with the protein concentration findings, with F6 and F7 displaying the most intense bands (Figure 4). To confirm the distribution of BEVs, extracellular vesicles derived from Escherichia coli were employed as a positive control (defined in Step 8.5.13). The isolation and purification procedures followed the steps described in the Table of Materials and the aforementioned protocol sections (Steps 3, 4). WB analysis further confirmed the presence of outer membrane protein A (OmpA), a major component of the outer membrane of bacteria and a specific marker for BEVs, in fractions F6-F8. Based on these results, fractions F6-F8 were defined as BEV-enriched fractions suitable for subsequent experiments and analysis.
Verification of the range of presentation of the interference components
Eukaryotic extracellular vesicles (EEVs), which possess a similar size and density as BEVs, were identified as a major interference in the analysis of BEVs. To address this, three EEV proteins were probed in fractions 5-8 from both the Top-down and Bottom-up modes, with centrifugation times of 7 h and 15 h. CD63, an EEV-associated transmembrane protein, was predominantly detected in F5, while the BEV marker LPS was enriched in fractions 6-7. This pattern was observed in both modes, although the Bottom-up mode exhibited slight banding of CD63-EEVs in F7. However, other EEV markers, CD9 and TSG-101, did not show visible signals in these fractions regardless of the modes or centrifugation times. In an independent experimental undertaking, antibodies targeting Syntenin and Integrin β1 were employed to ascertain the enrichment of distinct protein markers inherent to EEVs across fractions 5-8. Syntenin was prominently detected within F5, particularly under the ambit of the Top-down approach, while the presence of Integrin β1 was discerned within F6 (Figure 5). To further assess the presence of interfering particles, Dil-labeled low-density lipoprotein (Dil-LDL) was introduced into the density gradient system, and fluorescence intensity was measured across all fractions. In the Top-down mode, fractions 1-4 exhibited relatively higher fluorescence values, while in the Bottom-up mode, it was F1-F6 that displayed higher intensities (Figure 6).
Assess the recovery rates and purity of two DGC modes from concentration, particle size, and markers of BEVs
After identifying F6-F8 fractions as BEV-enriched fractions, the recovery rates and purity of the two density gradient centrifugation (DGC) modes were evaluated. The particle sizes of BEV-enriched fractions obtained from the Top-down mode, Bottom-up mode, and ultracentrifugation (UC) alone were compared. The observed particle sizes in both centrifugation modes ranged from 90 to 300 nm, aligning with the defined diameter of BEVs (Figure 7). Next, the particle and protein recovery rates of the two modes were calculated based on the particle and protein concentrations before and after DGC (Table 3 and Figure 8). Notably, the Bottom-up mode exhibited higher recovery rates compared to the other mode. In a separate experimental group, protein recovery in the two modes was evaluated at different centrifugation times of 7 h and 15 h. Importantly, there was no statistically significant difference in protein content within F6-F8 fractions after DGC between the two centrifugation times, regardless of the gradient mode used (Figure 9). The particle/protein ratio was calculated to provide a rough assessment of the purity in the two modes. The data indicated no significant difference in purity between the modes. Additionally, Coomassie brilliant blue staining (CBBS) and western blotting (WB) were performed to further compare the purity, focusing on three BEV markers (LPS, OmpA, and LTA), one EEV marker (CD63), and two contaminating markers (Calnexin, Flagellin). The results demonstrated a partial reduction of interfering substances after DGC, with LPS and OmpA showing a more prominent presence in both DGC modes compared to UC alone (Figure 10).
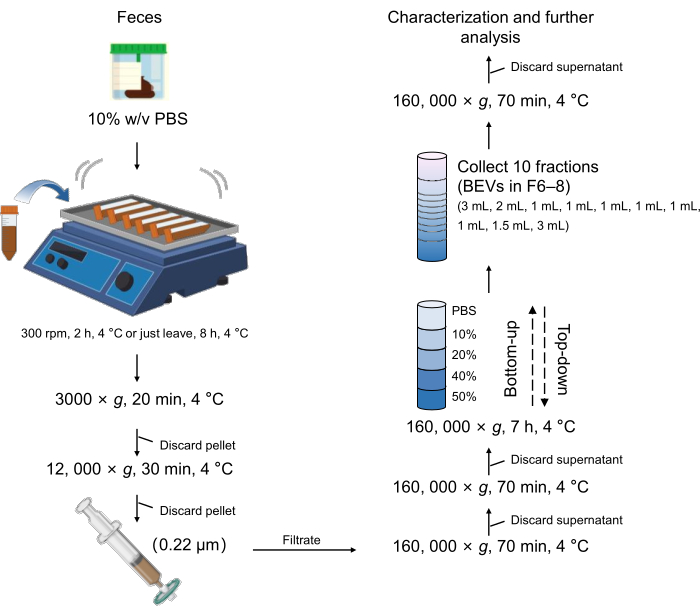
Figure 1: Schematic workflow of BEVs isolation and purification. Abbreviations: BEVs = bacterial extracellular vesicles. Please click here to view a larger version of this figure.
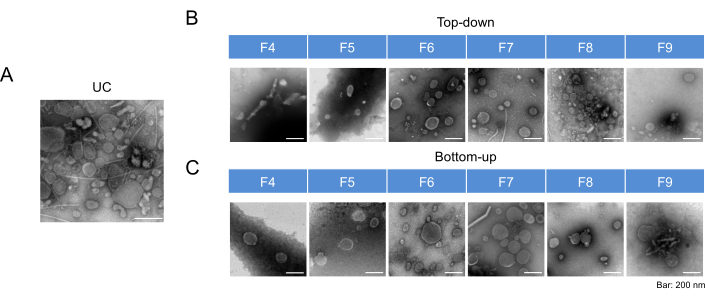
Figure 2: Representative TEM images of BEV fractions. (A) TEM images of BEVs isolated after UC. (B) TEM images of BEVs isolated after DGC using the Top-down mode. (C) TEM images of BEVs isolated after DGC using the Bottom-up mode. All images were presented at a consistent scale of 200 nm. Abbreviations: TEM = transmission electron microscope; BEVs = bacterial extracellular vesicles; UC = ultracentrifugation; DGC = density gradient centrifugation. Please click here to view a larger version of this figure.
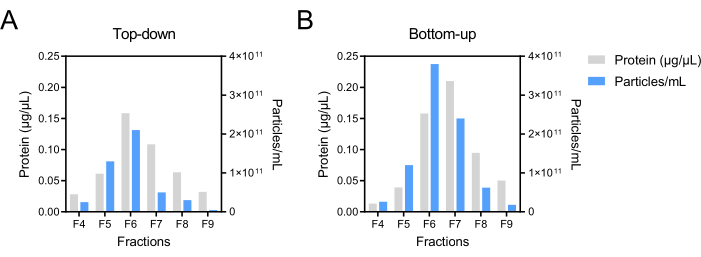
Figure 3: Protein and particle concentration of BEV fractions after Top-down and Bottom-up DGC modes. The protein concentration of BEV fractions was determined using BCA and is represented by the grey bars. The particle concentration was measured using NTA and is represented by the blue bars. Abbreviations: BEV = bacterial extracellular vesicle; DGC = density gradient centrifugation; BCA = bicinchoninic acid assay; NTA = nanoparticle tracking analysis. Please click here to view a larger version of this figure.
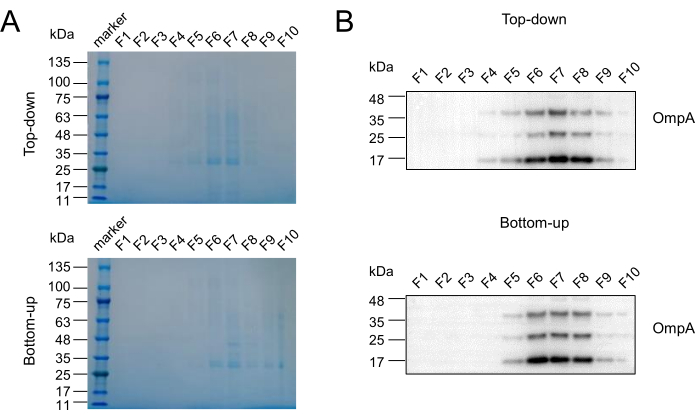
Figure 4: Determination of BEV-enriched fractions. (A) CBBS was performed to determine the fractions enriched with fecal BEVs in both Top-down and Bottom-up modes. (B) EVs derived from Escherichia coli were isolated, purified, and utilized as a positive control in WB to confirm the presence and distribution of BEVs. OmpA: Outer membrane protein A, a BEV marker. Abbreviations: BEV = bacterial extracellular vesicle; CBBS = coomassie brilliant blue staining; EVs = extracellular vesicles; WB = western blotting. Please click here to view a larger version of this figure.
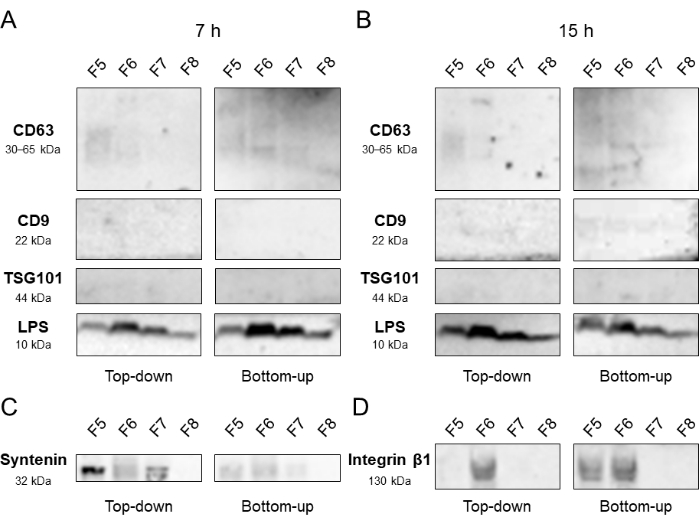
Figure 5: Confirmation of EEV distribution. Western blot analysis of fractions 5-8 obtained from the Top-down and Bottom-up DGC modes with different density gradient ultracentrifugation durations, 7 h (A) and 15 h (B). An independent trial focusing on F5 to F8 resulting from a 7-h centrifugation period was executed, as demonstrated in (C) and (D). Selected markers included those associated with BEVs (LPS) and EEVs (CD63, CD9, TSG-101, Syntenin, Integrin β1). Abbreviations: DGC = density gradient centrifugation; BEV = bacterial extracellular vesicle; EEV = eukaryotic extracellular vesicle. Please click here to view a larger version of this figure.
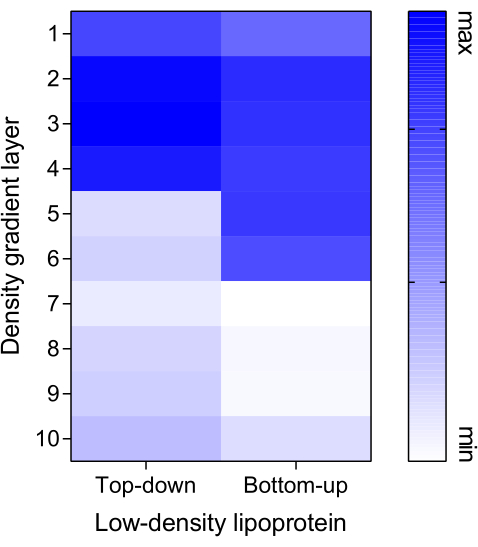
Figure 6: Distribution of low-density lipoprotein. Dil-labeled low-density lipoprotein (Dil-LDL), considered a contamination marker, was added at a concentration of 10 µg to the gradient system in both the Top-down and Bottom-up modes. Dil-LDL replaced the PBS/BEV solution (Step 6.1.1 and Step 6.2.2) to establish a detection model. The fluorescence intensity of each fraction was measured using a microplate detector with an excitation/emission wavelength of 549/565 nm. Abbreviation: BEV = bacterial extracellular vesicle. Please click here to view a larger version of this figure.
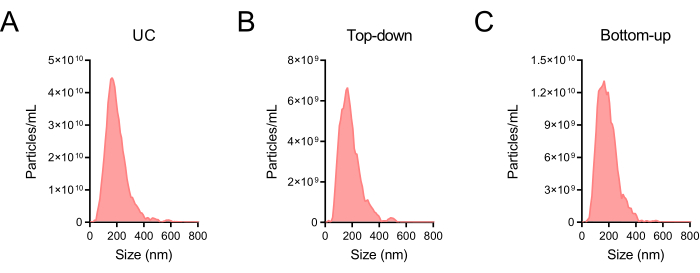
Figure 7: Particle sizes of BEV-enriched fractions. (A) Particle size distribution of crude BEVs obtained after UC. (B) Particle size distribution of BEV-enriched fractions (F6-F8) obtained using the Top-down density gradient centrifugation (DGC) mode. (C) Particle size distribution of BEV-enriched fractions (F6-F8) was obtained using the Bottom-up DGC mode. NTA was undertaken to quantify the dimensions of the particles. The dilution factors employed for panels (A–C) were 10,000, 2,000, and 5,000, correspondingly, with the ensuing outcomes calibrated. Abbreviations: BEV = bacterial extracellular vesicle; UC = ultracentrifugation; DGC = density gradient centrifugation; NTA = nanoparticle tracking analysis. Please click here to view a larger version of this figure.
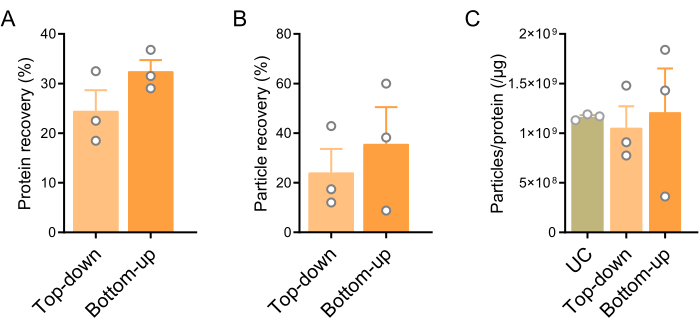
Figure 8: Protein and particle recovery rates of Top-down and Bottom-up DGC modes. (A) Protein recovery rates of the two modes calculated as the ratio of protein concentration after and before DGC (UC). (B) Particle recovery rates of the two modes are calculated by the ratio of particle concentration after and before DGC (UC). (C) Particle/protein ratios of UC, Top-down, and Bottom-up modes. Data are presented as mean ± SEM. Statistical analysis was performed using a two-tailed, unpaired t-test for panels A and B, and one-way analysis of variance (ANOVA) with Tukey post hoc test for panel C. No significant differences were observed. Abbreviations: DGC = density gradient centrifugation; UC = ultracentrifugation. Please click here to view a larger version of this figure.
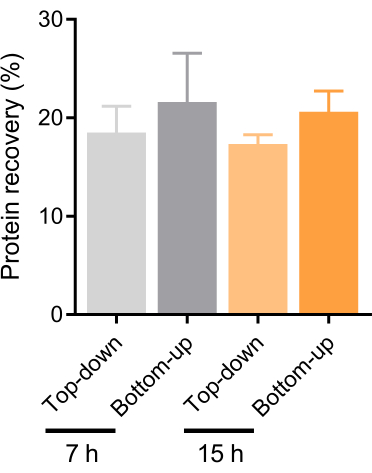
Figure 9: Comparison of protein recovery based on Top-down and Bottom-up DGC modes using different density-associated ultracentrifugation times. Protein recovery rates in fractions F6-F8 obtained from gradient ultracentrifugation for 7 h and 15 h were evaluated in independent experiments using both Top-down and Bottom-up modes. Data are presented as mean ± SEM. Statistical analysis was performed using two-way analysis of variance (ANOVA) with Fisher's least significant difference test. No significant differences were observed. Abbreviations: DGC = density gradient centrifugation. Please click here to view a larger version of this figure.
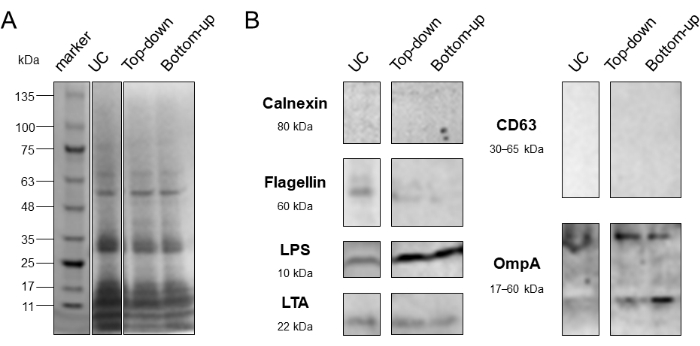
Figure 10: Purity assessment of Top-down and Bottom-up DGC modes. (A) CBBS was conducted to compare the protein distribution of UC, Top-down, and Bottom-up modes. (B) WB was conducted to assess the purity of UC, Top-down, and Bottom-up modes. Calnexin: endoplasmic reticulum-associated protein marker; Flagellin, contaminating protein marker from bacteria. CD63: transmembrane protein marker for eukaryotic extracellular vesicles; LTA: BEVs marker from gram-positive bacteria; LPS, OmpA: BEVs markers from gram-negative bacteria. Abbreviations: DGC = density gradient centrifugation; UC = ultracentrifugation; CBBS = Coomassie Brilliant Blue staining; WB = western blotting. Please click here to view a larger version of this figure.
Iodixanol solution concentration (%) | 0.02 M HEPES buffer | 50% Iodixanol working solution |
40 | 1 | 4 |
20 | 3 | 2 |
10 | 4 | 1 |
Table 1: Ratios for preparing iodixanol density gradient buffers. The table provided the ratio of 0.02 M HEPES buffer and 50% iodixanol working solution to obtain a certain concentration of iodixanol solution.
F1 | F2 | F3 | F4 | F5 | F6 | F7 | F8 | F9 | F10 | |
Density (g/mL) | 1.023 | 1.038 | 1.049 | 1.062 | 1.074 | 1.098 | 1.144 | 1.185 | 1.239 | 1.293 |
Table 2: The density of the iodixanol-based density gradient centrifugation system. The table showed the density of each fraction in an iodixanol-based density gradient centrifugation system. Blank control: PBS-based gradient system.
Top-down mode | Bottom-up mode | |
Particle recovery rate (%) | 24.08 | 35.69 |
Protein recovery rate (%) | 24.5 | 32.45 |
Table 3: The particle and protein recovery rates of two modes. The table showed the particle and protein recovery rates of the Top-down and Bottom-up modes (Figure 8).
Bacterial extracellular vesicles (BEVs) are lipid-bilayer nanoparticles secreted by bacteria, carrying a wealth of proteins, lipids, nucleic acids, and other bioactive molecules, contributing to mediating the functional effects of bacteria20. BEVs derived from the gut have been verified to be involved in the development of diseases, such as inflammatory bowel disease, Crohn's disease, and colorectal cancer, and also affect general metabolism and mediate impaired cognitive function4,16,17,20,21,22,23,24,25,26. Currently, obtaining complete and objective biological information on BEVs of gut bacteria origin from human specimens-feces is still constrained by a series of factors, among which the first and foremost key issue is how to isolate BEVs from the complex host environment.
The main methods of isolating BEVs, such as ultracentrifugation (UC), density gradient centrifugation (DGC), and size exclusion chromatography (SEC)13,14,15,16,17, possess both upsides and downsides. Difficulty in removing some interfering substances and the lack of consistent operating procedures, seriously affecting a more realistic and comprehensive analysis of BEVs, remain challenges for the process of separation. To ease the undesirable effects of interferences, many studies15,27,28 have combined two or more of the above methods to achieve the separation of BEVs, particularly from body fluids, but complex procedures tend to affect the stability of results. For BEVs, the difference in density with other contaminants (e.g., protein aggregates, lipid components, eukaryotic extracellular vesicles (EEVs)15) may become a specific means of isolation nowadays.
Presently, iodixanol has emerged as the preferred medium for density gradient separation of EVs, replacing sucrose due to its isotonic properties. These properties contribute to preserving EV morphology and facilitating density estimation for each fraction29. In alignment with Tulkens et al15, our study adopted an identical concentration for the DGC system, utilizing iodixanol at 50% (w/v), 40% (w/v), 20% (w/v), 10% (w/v), and 0% concentration gradient layers. The initial step involved the use of HEPES buffer to prepare various concentrations of iodixanol solutions. When compared to Tris (-EDTA)-sucrose buffer, an appropriate concentration of HEPES buffer ensures long-term pH stability within the centrifugation system, thanks to its intrinsic properties. Concurrently, sterile PBS buffer was employed at the top layer of the centrifugation system, not only to guard against potential contamination by bacteria and their metabolites during solution preparation but also to maintain sample buffer consistency pre- and post DGC. This involved resuspending the pellet with PBS buffer following UC and replacing iodixanol with PBS after DGC, thereby facilitating a comparative analysis of results. Moreover, the volume of each gradient layer within the DGC system was calibrated to 3 mL, 3 mL, 3 mL, 3 mL, and 3.5 mL for 50%, 40%, 20%, 10%, and 0% (PBS layer) iodixanol solutions respectively. This strategy aids in establishing a relatively broader density range (1.02-1.30 g/mL), potentially enhancing the separation of BEVs from other interfering elements, thereby making the gradients applicable to other body fluids with complex contamination.
It is important to emphasize that some stages of the protocol are crucial. Notably, the dilution factor outlined in Step 2.2, where 1 g of fecal samples is mixed with a minimum of 10 mL of PBS, is pivotal to preventing oversaturation and conserving experimental resources. Under these conditions, particle and protein concentration generally increase proportionally with the fecal mass in a sample, assuming other fecal characteristics are constant. If required, further analysis considering factors such as consistency, lipoprotein, or blood content can be undertaken. During Step 3.4, caution should be exercised to avoid directly pouring the solution, as this may disturb the pellet, potentially causing larger granules to obstruct the membrane of the 0.22 µm filter. If the filter rapidly becomes saturated (for instance, if less than 10 mL passes through a filter), an additional centrifugation step at 12,000 × g is advised. In the context of density gradient centrifugation, precise preparation of gradient solutions is a prerequisite for reliable results. Additionally, careful manipulation of the tube when layering the upper low-density solutions is essential to prevent the disruption of stratification, and any bubbles must be eliminated by attentive pipetting. Finally, when aspirating the fractions, it is important to draw them off meticulously along the tube wall, avoiding any over- or under-aspiration that could lead to inaccurate BEV distribution. Regular observation of the liquid level and consistent practice can help mitigate this issue.
This study determined the BEVs-enriched fractions (F6-F8) using multiple characterization methods and explored two distinct gradient ultracentrifugation modes: Top-down and Bottom-up. Through the measurement of protein and particle concentration in F4-F8 (Figure 3) and comparing recovery rates and purity (Figure 8 and Figure 10), it was observed that the Bottom-up centrifugation mode yielded higher detected values at both protein and particle levels than the alternative method in isolating and purifying BEVs from fecal samples. This observation implies different dynamic processes. A hypothesis was proposed that non-vesicular extracellular nanoparticles (NVEPs)29, such as lipoproteins, with lower density than BEVs, might not reach their buoyant densities if samples are bottom loaded (Figure 6), potentially causing an inflated recovery rate, even after 15 h of DGC (Figure 9). This observation necessitates consideration of whether the traditional purity definition, based on the ratio of particles to proteins, is applicable. Furthermore, it is worth noting that EEVs exhibited preponderance within F5, while BEVs were prominently detected in F6-F7 (Figure 4 and Figure 5). Notably, this differentiation appeared to be accentuated when adopting the Top-down mode. Hence, this mode may be more suitable for this protocol. However, it is essential to highlight the presence of Integrin β1 within F6, potentially signifying the intrinsic heterogeneity among EEVs. When applying this method to other body fluids such as blood and urine, researchers should consider the unique features of the samples. The centrifugation time defined in this protocol is 7 h, significantly less than the duration cited in other studies, which can be as long as 18 h. When compared to protein recovery with a 15-h duration executed in the same pattern in this study (Figure 9), this time appears sufficient to achieve the required separation purity. Under these operating conditions, the particle recovery in the Top-down mode reached up to 108 (4.5 × 10⁷-1.5 × 10⁸) per milligram of feces, aligning with previous reports (1011 BEVs per gram of wet stool)15,29,30. Lastly, density measurements of each fraction from the blank control confirmed that the density of BEVs ranged from 1.09-1.19 g/mL, which is consistent with earlier research.
This method, although effective, presents a limitation due to the impact of diets, gut function, and other factors on fecal composition. These variables can alter fecal consistency, potentially affecting bacterial abundance and BEV recovery. Therefore, it is crucial to standardize the isolation and purification of BEVs31,32, with adjustments made based on the assessment of fecal characteristics. Future research should focus on identifying a standard for normalizing BEV yield, akin to urine creatinine or urine flow rate. Such a benchmark could enhance methodological assessment and illuminate the link between fecal BEVs and the body's physiological and pathological state. Moreover, the strong association between fecal BEVs and various diseases underscores their significant clinical potential. However, the centrifugation time stipulated in this protocol does not meet the demand for more convenient and faster testing as necessitated by clinicians. Therefore, further investigation is needed to determine if shorter centrifugation times, perhaps less than 3 h, can yield equivalent results. Further exploration is also needed to understand the events occurring in both centrifugation modes. Although it is postulated that non-vesicular components are more enriched in F6-F8 in the Bottom-up mode, refining gradient concentrations may prove beneficial in identifying additional subtypes with specific functions.
This study successfully demonstrated the isolation and purification of BEVs from human feces using DGC. The strategy holds promise for application to other biological specimens, such as blood, urine, and saliva, providing researchers with an effective approach to uncover BEVs' hidden information, potentially advancing clinical applications.
The authors have nothing to disclose.
This work was supported by the National Science Fund for Distinguished Young Scholars (82025024); the Key project of the National Natural Science Foundation of China (82230080); the National Key R&D Program of China (2021YFA1300604); the National Natural Science Foundation of China (81871735, 82272438, and 82002245); Guangdong Natural Science Fund for Distinguished Young Scholars (2023B1515020058); the Natural Science Foundation of Guangdong Province (2021A1515011639); the Major State Basic Research Development Program of Natural Science Foundation of Shandong Province in China (ZR2020ZD11); the Post-doctoral Science Foundation (2022M720059); the Outstanding Youths Development Scheme of Nanfang Hospital, Southern Medical University (2022J001).
1 % (w/v) glutaraldehyde (prepared from 2.5 % stock solution in deionized water) | ACMEC | AP1126 | Morphological observation for BEVs using TEM at Step 8.3.3 |
1 % (w/v) methylcellulose (prepared from original powder in deionized water) | Sigma-Aldrich | M7027 | Morphological observation for BEVs using TEM at Step 8.3.6 |
1.5 % (w/v) uranyl acetate (prepared from original powder in deionized water) | Polysciences | 21447-25 | Morphological observation for BEVs using TEM at Step 8.3.5 |
1000 μL, 200 μL, 10 μL Pipette | KIRGEN | KG1313, KG1212, KG1011 | Transfer the solution |
5 % (w/v) bovine serum albumin solution (prepared from the original powder in TBST buffer) | Fdbio science | FD0030 | Used in western blotting for blocking at Step 8.5.6 |
5 × loading buffer | Fdbio science | FD006 | Used in western blotting and Coomassie brilliant blue stain at Step 8.5.1 |
75 % (v/v) alcohol | LIRCON | LIRCON-500 mL | Surface disinfection |
96-well plate | Rar | A8096 | Measure the absorbance values |
Anti-Calnexin antibody | Abcam | ab92573 | Western blotting (Primary Antibody) |
Anti-CD63 antibody | Abcam | ab134045 | Western blotting (Primary Antibody) |
Anti-CD9 antibody | Abcam | ab236630 | Western blotting (Primary Antibody) |
Anti-Flagellin antibody | Sino Biological | 40067-MM06 | Western blotting (Primary Antibody) |
Anti-Integrin beta 1 antibody | Abcam | ab30394 | Western blotting (Primary Antibody) |
Anti-LPS antibody | Thermo Fisher | MA1-83152 | Western blotting (Primary Antibody) |
Anti-LTA antibody | Thermo Fisher | MA1-7402 | Western blotting (Primary Antibody) |
Anti-OmpA antibody | CUSABIO | CSB-PA359226ZA01EOD, https://www.cusabio.com/ | Western blotting (Primary Antibody) |
Anti-Syntenin antibody | Abcam | ab133267 | Western blotting (Primary Antibody) |
Anti-TSG101 antibody | Abcam | ab125011 | Western blotting (Primary Antibody) |
Autoclave | ZEALWAY | GR110DP | Sterilization for supplies and mediums used in the experiment |
Balance | Mettler Toledo | AL104 | Balance the tube sample-loaded with PBS |
Bicinchoninic acid assay | Fdbio science | FD2001 | Measure protein content of BEVs at Step 8.2 |
BioRender | BioRender | https://app.biorender.com | Make the schematic workflow of BEVs isolation and purification showed in Figure 1 |
Biosafety cabinet | Haier | HR1200- II B2 | Peform the procedures about feces sample handling |
Centrifuge 5810 R; Rotor F-34-6-38 | Eppendorf | 5805000092; 5804727002, adapter: 5804774000 | Preprocess for BEVs (Step 3) |
Chemiluminescence Apparatus | BIO-OI | OI600SE-MF | Used in western blotting for signal detection at Step 8.5.12 |
Cytation 5 | BioTek | F01 | Microplate detector for measuring the absorbance (Step 8.1) and fluorescence (Figure 6) values |
Dil-labled low density lipoprotein | ACMEC | AC12038 | Definition of distribution of interfering components |
Electrophoresis equipment | Bio-rad | 1658033 | Used in western blotting for protein separation and transfer at Step 8.5.2, 8.5.3, 8.5.5 |
Enhanced Chemiluminescence kit HRP | Fdbio science | FD8020 | Used in western blotting for signal detection at Step 8.5.12 |
Escherichia coli | American Type Culture Collection | ATCC8739 | Isolate BEVs as a positive control. Protocol: Dissolve 25 g of the LB powder in 1 L deionized water, and autoclave. Transfer the 800 μL of preserved Escherichia coli into the medium. Cultivate at 37 °C in the incubator shaker. Then centrifuge at 3, 000 × g for 20 min at 4 °C, 12, 000 × g for 30 min at 4 °C, filter the supernatant through 0.22 μm membrane, and perform ultra-speed centrifugation at 160, 000 × g for 70 min at 4 °C. Pellet defined as crude BEVs from Escherichia coli was suspended in 1.2 mL PBS (Step 3, 4). |
Falcon tubes 50 mL | KIRGEN | KG2811 | Preprocess for BEVs (Step 3) |
Feto Protein Staining Buffer | Absci | ab.001.50 | Coomassie brilliant blue staining at Step 8.5.4 |
Filter paper | Biosharp | BS-TFP-070B | Morphological observation for BEVs using TEM at Step 8.3 (Blotting the solution) |
Formvar/Carbon supported copper grids | Sigma-Aldrich | TEM-FCF200CU50 | Morphological observation for BEVs using TEM at Step 8.3 |
HEPES powder | Meilunbio | MB6078 | Prepare iodixanol buffers with different concentrations for density gradient centrifugation |
HRP AffiniPure Goat Anti-Mouse IgG (H+L) | Fdbio science | FDM007 | Western blotting (Secondary Antibody) |
HRP AffiniPure Goat Anti-Rabbit IgG (H+L) | Fdbio science | FDR007 | Western blotting (Secondary Antibody) |
Incubator shaker | Qiangwen | DHZ-L | Cultivate Escherichia coli |
Kimwipes™ Delicate Task Wipes | Kimtech Science | 34155 | Wipe the inner wall of the ultracentrifuge tube at Step 4.15 |
LB broth | Hopebio | HB0128 | Cultivate Escherichia coli |
Low temperature freezer (-80 °C) | Haier | DW-86L338J | Store the samples |
Methanol | Alalddin | M116118 | Used in western blotting for activating PVDF membrane at Step 8.5.5 |
Micro tubes 1.5 mL | KIRGEN | KG2211 | Recover fractions after density gradient centrifugation |
Micro tubes 2 mL | KIRGEN | KG2911 | Recover fractions after density gradient centrifugation |
Micro tubes 5 mL | BBI | F610888-0001 | Recover fractions after density gradient centrifugation |
Microplate reader | Thermo Fisher | Multiskan MK3 | Measure protein content of BEVs at Step 8.2 |
Millipore filter 0.22 μm | Merck millipore | SLGP033RB | Filtration sterilization; Material: polyethersulfone, PES |
NaCl | GHTECH | 1.01307.040 | Density gradient centrifugation solution |
NaOH | GHTECH | 1.01394.068 | Density gradient centrifugation solution (pH adjustment) |
Optima™ XPN-100 | Beckman Coulter | A94469 | Ultracentrifugation for BEVs isolation at Step 4, 7 |
OptiPrep™ | Serumwerk Bernburg AG | 1893 | Density gradient centrifugation stock solution |
Orbital Shaker | Youning | CS-100 | Dissolve feces at Step 2 |
Phosphate buffered saline | Procell | PB180327 | Dissolve feces at Step 2 |
Pipettor | Eppendorf | 3120000267, 3120000259 | Transfer the solution |
Plastic pasteur pipette | ABCbio | ABC217003-4 | Remove supernatant in preprocessing at Step 3.4 |
Polyvinylidene difluoride (PVDF) membranes | Millipore | ISEQ00010, IPVH00010 | Used in western blotting for protein transfer at Step 8.5.5 |
Prefabricated polyacrylamide gel, 4–20% 15 Wells | ACE | F15420Gel | Used in western blotting for protein separation at Step 8.5.2, 8.5.3 |
Primary antibody diluent | Fdbio science | FD0040 | Used in western blotting at Step 8.5.8 |
Protein ladder | Fdbio science | FD0672 | Used in western blotting and Coomassie brilliant blue stain at Step 8.5 |
Rapid protein blotting solution | UBIO | UW0500 | Used in western blotting for protein transfer at Step 8.5.5 |
Rotor SW 32 Ti Swinging-Bucket Rotor | Beckman Coulter | 369650 | Ultracentrifugation for BEVs isolation at Step 4, 7 |
Syringe 20 mL, 50 mL | Jetway | ZSQ-20ML, YCXWJZSQ-50 mL | Transfer buffers amd remove supernatant in preprocessing |
TBS powder | Fdbio science | FD1021 | Used in western blotting at Step 8.5 |
Transmission electron microscope (TEM) | Hitachi | H-7650 | Morphological observation for BEVs at Step 8.3 |
Tween-20 | Fdbio science | FD0020 | Used in western blotting at Step 8.5 |
Ultracentrifuge tube | Beckman | 326823, 355642 | Ultracentrifugation for BEVs isolation at Step 4, 7 |
Ultra-clean bench | AIRTECH | SW-CJ-2FD | Peform the procedures about liquid handling |
Water bath | Bluepard | CU600 | Used for measuring protein content of BEVs at Step 8.2.5 |
ZetaView | Particle Metrix | S/N 21-734, Software ZetaView (version 8.05.14 SP7) | Nanoparticle tracking analysis (NTA) for measuring the particle size and concentrarion of BEVs at Step 8.4 |