Summary

Protein Purification-free Method of Binding Affinity Determination by Microscale Thermophoresis

Published: August 15, 2013
doi:

Summary

Microscale thermophoresis (MST) can be widely used for determination of binding affinity without purification of the target protein from cell lysates. The protocol involves overexpression of the GFP-fused protein, cell lysis in non-denaturing conditions, and detection of MST signal in the presence of varying concentrations of the ligand.

Abstract

Quantitative characterization of protein interactions is essential in practically any field of life sciences, particularly drug discovery. Most of currently available methods of KD determination require access to purified protein of interest, generation of which can be time-consuming and expensive. We have developed a protocol that allows for determination of binding affinity by microscale thermophoresis (MST) without purification of the target protein from cell lysates. The method involves overexpression of the GFP-fused protein and cell lysis in non-denaturing conditions. Application of the method to STAT3-GFP transiently expressed in HEK293 cells allowed to determine for the first time the affinity of the well-studied transcription factor to oligonucleotides with different sequences. The protocol is straightforward and can have a variety of application for studying interactions of proteins with small molecules, peptides, DNA, RNA, and proteins.

Introduction

Quantitative characterization of affinity of intermolecular interactions is important in many areas of biomedical research. Binding dissociation constant (KD) is essential not only in drug discovery but is also an important parameter in characterization of any binary interaction in any biological system. Biochemical methods used for detection of protein-protein interactions, such as immunoprecipitation and yeast two-hybrid screens, do not inform us on how tight are those interactions, while affinity defines whether this particular complex exists under given conditions in vivo. In drug discovery process, binding assay development is one of the necessary and frequently the most time-consuming steps. Most commonly used methods of KD determination include fluorescence polarization,1 surface plasmon resonance (SPR) technology,2 radioligand binding,3 isothermal titration calorimetry,4 equilibrium dialysis (ED),5 ultrafiltration (UF),5 and ultracentrifugation (UC).6 All of them require significant quantities of purified target protein. Microscale thermophoresis (MST) is a rapidly developing method that detects directed movement of molecules in a microscopic temperature gradient. Any changes of the hydration shell of biomolecules result in a relative change of movement along the temperature gradient.7 MST is used to determine binding affinities and has been applied for studying ligand binding to fluorescently labeled proteins or fluorescent ligands to a target protein.8, 9 MST allows measurement of interactions directly in solution without the need of immobilization to a surface (immobilization-free technology). Practically, any binding is accompanied by a change in MST signal, although the size of the change differs from system to system significantly. For the detection of molecule motion by MST, they have to be fluorescent. This major limitation of the method can be turned into an advantage. If a protein is expressed as a GFP fusion in any system, it will be the only fluorescent molecule and thus can be studied without isolation from the cell lysate or cell-free expression system. Generation of cell lysates that allow for binding conditions with minimal artifacts is the major challenge. Here we describe a protocol of cell lysate preparation and MST experiment that can be used for many soluble and membrane proteins.

STAT proteins are latent cytoplasmic transcription factors activated by tyrosine phosphorylation in response to extracellular signals and are involved in many biological processes including immunity, hematopoiesis, inflammation, and development.10 In mammals, the STAT family consists of STAT 1, 2, 3, 4, 5A, 5B, and 6. All activated STATs are known to bind to the same DNA sequence, so called GAS motif, IFN-gamma activated sequence. However, the transcriptional effects of different STATs are very different.11 In spite of involvement in many pathological processes and extensive studies yielding over 17,000 publications, the KD of STAT interactions with different DNA sequences have not been determined. Only relative affinity of different STATs to variants of GAS motif has been characterized.11 Difficulties in protein expression and purification are the major impediments in characterization of STATs’ DNA binding selectivity. Although the majority of the studies have focused on the role of “activated” STATs, which became synonymous to Tyr-phosphorylated transcription factor, the role of non-phosphorylated STATs (U-STATs) in regulation of transcription is emerging rapidly.12 However, these mechanisms are poorly understood, and it was unclear whether U-STATs actually bind to DNA or act through interactions with other transcription factors. We have recently shown that U-STAT3 can bind to DNA sequences different from GAS motifs with even higher affinity.13 The finding has significant implications for our understanding of the biological functions of this important protein. We have applied microscale thermophoresis to determine relative affinities of STAT3 to GAS and AT-rich oligonucleotide S+100 (Figure 4). Almost identical protocol has been used for KD determination for binding of a different STAT3 ligand, a lipopeptide inhibitor.14 No binding to a related transcription factor, GFP-STAT1 that was used as a negative control could be detected thus confirming selectivity of interaction.14

Protocol

1. Preparation of Cell Lysate

This protocol is intended for adherent cells expressing any GFP-fused protein. Needed cell number can vary from as low as 106 to as many as 20 x 106 cells, depending on the level of protein expression. For example, lysate of HEK cells overexpressing GFP-STAT3 was prepared by treating cells grown in 10 T75 flasks to near 70% confluency with 1 ml lysis buffer. However, this lysate had to be diluted 150-fold to provide optimal level of fluorescence for MST experiment. Cell lysis protocol depends strongly on the properties and intracellular localization of the protein under investigation. If using detergents is undesirable because of protein instability, sonication described below, could be the best choice. Different additives can be added to the lysis buffer to prevent protein modification reactions: EDTA prevents phosphorylation, sodium vanadate inhibits tyrosine protein phosphatases, sodium fluoride is an inhibitor of Ser/Thr phosphatases.

  1. Prepare lysis buffer. For easy-to-extract cytoplasmic proteins the following composition works well: 25 mM Tris HCl, pH 8.0, and protease inhibitor cocktail diluted 100-fold (Sigma-Aldrich P2714, consisting of 2 mM AEBSF, 0.3 μM aprotinin, 130 μM bestatin, 1 mM EDTA, 14 μM E-64, 1 μM leupeptin). Alternatively, for less soluble proteins, one can use commercial RIPA buffer with protease inhibitors cocktail and non-denaturing detergents. Keep the buffer on ice.
  2. Wash cells briefly with ice-cold PBS using 10 ml of buffer per T75 flask. Keep cells on ice for 5 min, or until cells start detaching from the flask. Scrape cells with cell scraper to detach if necessary.
  3. Resuspend cells in 10 ml ice cold PBS and transfer to a prechilled 14 ml round bottom centrifuge tube.
  4. Pellet cells by centrifugation at 400-600 x g at 4 °C for 5 min. Combine cells from several flasks at this point if needed.
  5. Remove PBS supernatant and resuspend pellet in 200 μl of ice-cold lysis buffer, transferring suspension to a pre chilled 1.5 ml Eppendorf tube.
  6. Keep cells on ice to minimize local overheating. Lyse cells with 3x 10 sec pulses of sonication at 30% amplitude, using a 2-3 mm pre-chilled tip. Keep the tip below the surface to minimize frothing. Omit this step when using detergent-containing buffer and incubate on ice for 30 min instead.
  7. Correct the lysate solution to contain physiological salt concentration (100 mM NaCl) if necessary using 5 M NaCl.
  8. Collect lysates by centrifugation at about 26,000 x g at 4 °C for 10 min.
  9. Determine the optimal lysate dilution (as described in section 3 below) and amount of lysate needed for one titration (typically around 300 μl of pre-diluted lysate).
  10. Aliquot the lysate and store at temperature appropriate for the protein under investigation (-80 °C, in most cases).

2. MST Buffer Selection and Preparation

  1. Since the protein-ligand interactions are dependent on buffer conditions, MST buffer composition is chosen based on the properties of a particular system. It is generally advantageous to test at least two different buffers.
  2. Prepare 2 5x MST buffers. We had good experiences with these two compositions: HEPES (250 mM HEPES, pH 7.4; 25 mM MgCl2; 500 mM NaCl; 0.25% NP-40) and Tris HCl (250 mM Tris HCl, pH 7.4; 750 mM NaCl; 50 mM MgCl2; 0.05% Tween-20). Addition of BSA (5% in the final binding mixture) can help prevent adhesion of proteins to plastic tubes and glass capillaries. NaN3 (0.5 mM) can also be included to prevent growth of microorganisms.

3. Determination of Optimal Lysate Dilution

  1. Select the LED excitation source with the wavelength λ = 470 nm on the MST instrument.
  2. Load capillaries with the cell extract diluted 2 and 10x with MST buffer.
  3. Perform “Find Capillaries” operation on Control Software of MST instrument. The optimal fluorescence range in diluted lysate is from 400 to 1,500 fluorescence units.

4. Determination of the Optimal Ligand Concentration Range

  1. The highest concentration of the ligand should be at least 20x higher than the expected dissociation constant.
  2. The lowest ligand concentration should be lower than molar concentration of the fluorescent protein.

Refer to the NanoTemper Technologies Concentration Finder tool for the ligand concentration range estimation.

5. Preparation of Cell Lysate and Ligand Dilutions

  1. Place a tube rack with a needed number (usually 10-16) of 0.5 ml LoBind centrifuge tubes on ice. Pipette 25 μl of MST buffer to the bottom of each tube. Add 25 μl of the ligand stock solution to the first tube (#1, ligand highest concentration) and perform serial two-fold dilution of the ligand using the rest of the tubes. Keep the rack with ligand samples on ice.
  2. Thaw cell lysate slowly on ice.
  3. Dilute cell lysate with MST buffer to provide the optimal level of the fluorescent target protein in the binding reactions. Final protein concentration should be close to expected KD or lower. It should be adjusted to obtain necessary number of fluorescence counts in the final solution. For determination of GFP-STAT3 concentration in the lysate, the instrument was calibrated with a help of fluorescein. The molar concentration of GFP in the lysate was determined using the ratio of fluorescein and EGFP quantum yields, 0.85 and 0.61 respectively.15

6. Microscale Thermophoresis Binding Studies

  1. Select the LED excitation source with λ = 470 nm on the MST instrument.
  2. Place 0.5 ml LoBind tubes in the tube rack across from tubes with ligand serial dilution samples. Carefully add 15 μl of the cell lysate to the bottom of each tube. Try not to touch tube walls to avoid sample loss.
  3. Add 15 μl of the ligand sample with the highest concentration (#1) to the corresponding tube #1 with the cell lysate. Mix well and change a pipette tip. Repeat this step with the rest of the tubes except for the last one, which should contain no ligand.
  4. Add 15 μl of MST buffer to the last tube and mix well.
  5. Fill approximately 2/3 of the first capillary with the binding mixture from tube #1, tilt it to move the solution towards the center, and place the capillary on the capillary tray to the position #1 (the closest position to the tray opening). Repeat this step with the rest capillaries. Capillary ends can be plugged with wax for longer experiments.
  6. Place the tray inside the MST instrument and close the instrument’s door.
  7. Perform “Find Capillaries” command to let the instrument find exact positions of the capillaries and measure fluorescence of the samples.
  8. Based on the fluorescence signal intensity, adjust the LED power (from 10-100%) to bring it into 400-1,500 units interval.
  9. Click the “Start” button to perform the thermophoresis experiment. More than one IR-laser power can be chosen for the experiment in order to find the optimal temperature gradient for the particular system. Collect data from 2-3 runs for the same set of capillaries to ensure the reproducibility of measurements. It takes 10-12 min to run one set of 16 capillaries.

7. Microscale Thermophoresis Data Analysis

  1. Open the Analysis software.
  2. Load the project folder. In the appeared Information Run Viewer select collected at a specific IR laser power thermophoretic curves. There is an option of opening all thermophoretic traces collected under various conditions such as IR laser power, LED power, temperature, concentration, etc. at once and then choosing any curves for analysis by switching them on and off (click on the experiment’s name).
  3. In the Evaluation Points graph window, select the thermophoresis or thermophoresis with T-jump. Ensure that blue and red lines are positioned correctly. To obtain the averaged points with standard deviations, select “Use Average” or “Distinguish runs” for separate runs.
  4. To plot a dissociation constant fit, select “Use Average”, enter and fix the labeled molecule concentration value (check the “concentration” square in a fit window menu), and fit the curve. The KD value with its standard deviation appears in a separate information pop-up window. To plot a fit using Hill method, select “Average”, Hill method, and then fit the curve. The EC50 affinity value with its standard deviation is shown in this case. The feature of KD or Hill “border” can also be utilized when saturation in a bound state is not reached.
  5. Save the average fit data in a text file and transfer to Excel.
  6. Plot Fnorm (normalized fluorescence), ΔFnorm (difference in normalized fluorescence if different experiments are compared), or fraction bound (see the formula below) as a function of the unlabeled (titrated) molecule concentration.

Fraction Bound (fraction of molecules in a complex) = (Therm(C)-unbound)/(bound-unbound), where Therm(C) is thermophoresis measured for the concentration C, unbound is thermophoresis for the unbound state (when molecules are not in a complex), and bound is thermophoresis for the completely bound state.

Representative Results

Measuring the affinity of non-phosphorylated STAT3 protein binding to oligonucleotides.

HEK293 cells expressing STAT3-GFP were used as a source of fluorescently labeled STAT3 for DNA binding assay. Cell lysates were prepared using RIPA buffer (20×106cells/ml). For binding studies, the lysates were diluted 150x with MST DNA-binding buffer to provide the optimal level of the fluorescent protein in the binding reaction (about 20 nM). Non-transfected HEK293 cells have been used to evaluate background fluorescence, which turned out to be non-detectable even in non-diluted lysate. However, background fluorescence can be more significant in other expression systems and thus has to be monitored. Titration series consisting of 11 binding mixtures and lysate sample without the ligand have been prepared. Each sample contained 15 μl of diluted cell lysate and 15 μl of oligonucleotides solutions of varying concentrations. Final buffer composition included 25 mM HEPES, pH 7.2; 50 mM NaCl; 2.5 mM MgCl2; and 0.025% NP-40. The measurements were taken in standard treated capillaries on Monolith NT.115 instrument using 50% IR-laser power and LED excitation source with λ = 470 nm at ambient temperature. Binding of highly charged oligonucleotides resulted in significant changes in STAT3 mobility in temperature gradient (Figure 2). In Figure 3, thermophoretic signal is plotted as a function of oligonucleotide concentration. Each data point represents the mean of three measurements. NanoTemper Analysis 1.2.20 software was used to fit the data and to determine the apparent KD values. The apparent dissociation constants were 37.9±1.0 μM and 23.3±0.6 μM for GAS and S+100, respectively (Figure 4). Substitution of A-to-G resulted in dramatic decrease in affinity of S+100 mut#1 (Figure 4), while mutant S+100 mut#2 showed no detectable binding thus confirming sequence-selective binding of STAT3 to S+100. Surprisingly, S+100 sequences displayed slightly tighter binding than GAS in three measurement repetitions.

Figure 1
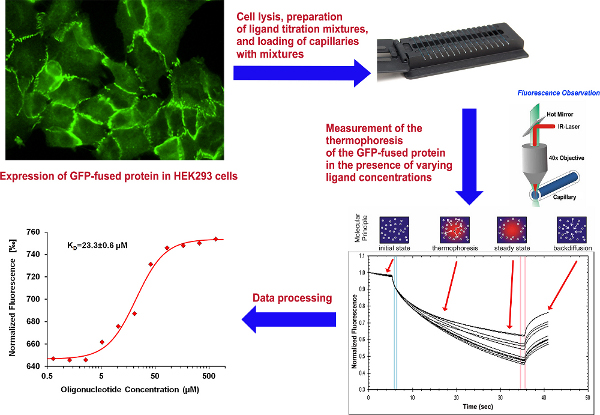
Figure 1. Overall scheme of the experiment. Click here to view larger figure.

Figure 2
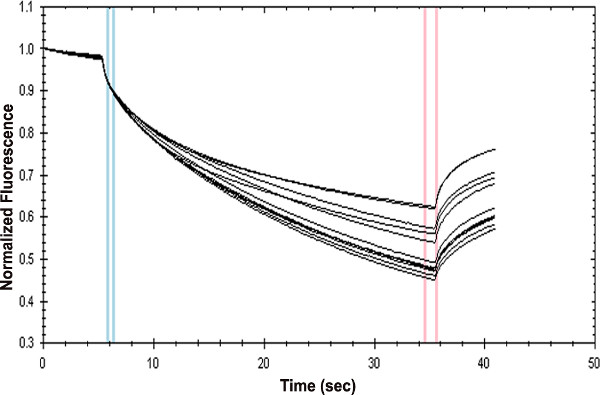
Figure 2. Unprocessed thermophoresis data generated for the interaction of GFP-STAT3 with AT-rich oligonucleotide. Diluted cell lysate containing 20 nM GFP-STAT3 was mixed with increasing amounts of double-stranded oligonucleotide (5′-AAAACAAAACGAAACAAACAAACTA) yielding the specified concentrations of the ligand. The data were collected at 50% laser power and 100% LED.

Figure 3
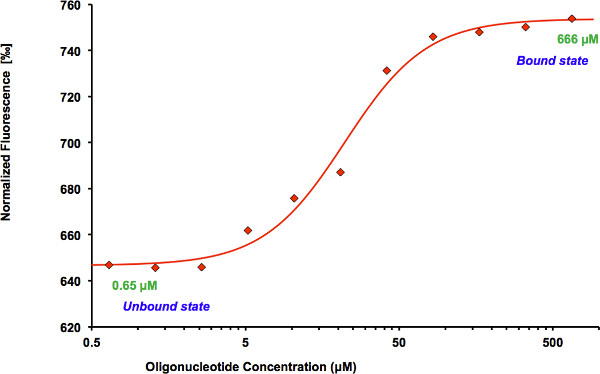
Figure 3. Binding curve generated by the NanoTemper Analysis 1.2.231 software. Normalized fluorescence (hot fluorescence/initial fluorescence) is plotted as a function of oligonucleotide concentration. The protein shows an increase in fluorescence in the bound compared to the unbound state. The data are fitted using the Hill equation method incorporated into the NanoTemper Analysis software.

Figure 4
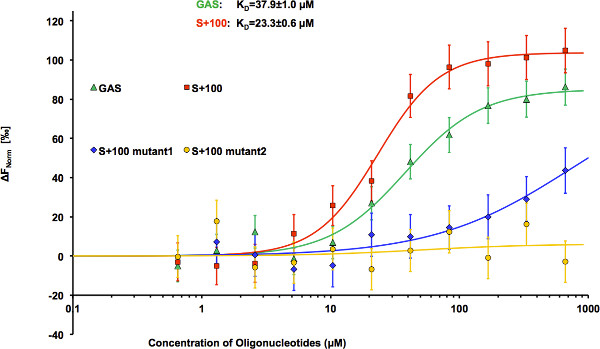
Figure 4. STAT3 binding to oligonucleotides with different sequences. Microscale thermophoresis binding measurements of STAT3-GFP to GAS (KD = 37.9±1.0 μM), S+100 (KD = 23.3±0.6 μM), S+100 mutant 1 (KD = 740±21 μM), and S+100 mutant 2 (no binding). The STAT3-GFP concentration was kept constant at about 20 nM, and the concentration of oligonucleotides varied from 666 to 0.650 μM. The difference in normalized fluorescence [‰] is plotted as a function of oligonucleotide concentration, and curves are fitted using the Hill method of the NanoTemper Analysis software. Error bars represent standard error of 3 measurements.

Discussion

Protein expression and purification is a laborious and expensive step, which is, however, necessary for determination of interactions’ KD by most currently used method. Application of MST allows avoiding protein purification thus significantly simplifying and accelerating quantitative characterization of interactions. It presents particularly significant advantages in the case of difficult-to-express and purify proteins, such as membrane proteins and transcription factors.

The major limitation and requirement of MST is the ability to express a protein as a fusion with green fluorescent protein. However, the constructs for expression of majority of GFP-fused human and mouse proteins are commercially available. GFP-fused proteins are also widely used for trafficking and degradation studies, and thus can serve “double duties” in combination with MST studies.

In addition to lack of need for protein purification, very economical use of all reagents and insensitivity to slight variations in buffer compositions, MST offers other advantages when compared to traditional methods of KD determinations. Unlike surface plasmon resonance, MST -based experiments take less than 2 hr, allow for determination of KD in broader range and do not suffer from surface immobilization artifacts. For example, we could not determine KD for STAT3 binding to oligonucleotides by SPR, although we have invested significant amount of funds for purchasing of purified STAT3 protein. KD of the interaction was too high, which is frequently the case for transcription factors, and fell out of SPR experiment’s concentration range.

Titration calorimetry works only for interactions that are accompanied by changes in enthalpy. This limitation excludes many cases. Meanwhile, changes in thermophoretic mobility, although do differ a lot in values for different systems, occur for a vast majority of interactions. One of the biggest advantages of MST is that it works in a variety of buffers and tolerates the presence of detergents, micelles, and bicelles in the system. This property allows applying it to membrane proteins that are practically impossible to study by other means. However, the caution must be used to avoid the variations in detergent and micelles content and composition during titration with the ligand.

It should be also kept in mind when using cell extracts that the protein under study may exist in its native form, which is frequently a complex with other proteins, nucleic acids, and cofactors. Thus, binding affinity may be different from that for an isolated protein not involved in any complex formations. Overexpression frequently allows titrating out the interaction partners leaving most of the molecules of the protein under study in non-bound state. This is another reason for trying to achieve very high expression levels of the GFP-fused protein upon cells transfection. The other hard-to-control parameter is posttranslational modifications that also can add significant heterogeneity to the system. Additional limitation is studying binding to proteins and small molecules that are present in cell lysates in large quantities or molecules with broad specificity and low affinity that can interact with multiple proteins present in the lysate. Wienken, C.J., et al. have found that KD determined by MST in E. coli extract was more than an order of magnitude higher than in a buffer for the interaction of interferon gamma with antibodies9. The effect may have been partially due to the proteolysis since the extract had no protease inhibitors. Small molecule binding to serum albumin was also found to change KD in interactions studies by MST9.

The efficacy of extraction can also differ for different proteins depending on intracellular localization and physico-chemical properties. Thus, it is helpful to try several cell lysis and protein extraction conditions. For cytoplasmic proteins, using no detergents, just ultrasound for cell disruption frequently produces very good yields and data. Meanwhile, membrane proteins require more extensive screening of extraction conditions with varying concentrations and nature of detergents, lipid micelles, or bicelles. Detergent content has to be kept to minimum to avoid influencing binding affinity.

In spite of the listed limitations, we have found MST studies of non-purified GFP-fused proteins to be very convenient for quantitation of binding affinities for many proteins and ligand types. There is no doubt that wider use of the method in many laboratories will allow further broadening the applications of MST-based protein binding studies.

Declarações

The authors have nothing to disclose.

Acknowledgements

This work was partially supported by the Intramural Research Program of the NIH, National Cancer Institute, Center for Cancer Research; Collaborative Research Agreement between NCI and Calidris Therapeutics; American Cancer Society grant IRG 97-152-17 to O.T; and federal funds from the National Cancer Institute, NIH, under contract HHSN26120080001E.

Materials

Name of the Reagent/material Company Catalogue Number Comments
RIPA buffer Millipore 20-188 Other manufacturer’s buffers work as well
Protease inhibitors cocktail Sigma-Aldrich P2714
Monolith NT.115 NanoTemper Technologies GmbH G008
Monolith NT.115 Capillary Tray NanoTemper Technologies GmbH T001
Monolith NT.115 Standard Treated Capillaries NanoTemper Technologies GmbH K002
NT Control software NanoTemper Technologies GmbH 2.0.2.29
NT Analysis software NanoTemper Technologies GmbH 1.4.27
Table-top refrigerated centrifuge Eppendorf 5417R Other microtube refrigerated centrifuges
Protein LoBind Tube 0.5 ml Eppendorf 22431064

Referências

  1. Lea, W. A., Simeonov, A. Fluorescence polarization assays in small molecule screening. Expert. Opin. Drug Discov. 6, 17-32 (2011).
  2. Willander, M., Al-Hilli, S. Analysis of biomolecules using surface plasmons. Methods Mol. Biol. 544, 201-229 (2009).
  3. Hulme, E. C., Trevethick, M. A. Ligand binding assays at equilibrium: validation and interpretation. Br. J. Pharmacol. 161, 1219-1237 (2010).
  4. Ghai, R., Falconer, R. J., Collins, B. M. Applications of isothermal titration calorimetry in pure and applied research–survey of the literature from 2010. J. Mol. Recognit. 25, 32-52 (2012).
  5. Vuignier, K., Schappler, J., Veuthey, J. L., Carrupt, P. A., Martel, S. Drug-protein binding: a critical review of analytical tools. Analytical and Bioanalytical Chemistry. , 398-3953 (2010).
  6. Lebowitz, J., Lewis, M. S., Schuck, P. Modern analytical ultracentrifugation in protein science: a tutorial review. Protein Sci. 11, 2067-2079 (2002).
  7. Duhr, S., Braun, D. Why molecules move along a temperature gradient. Proc. Natl. Acad. Sci. U.S.A. 103, 19678-19682 (2006).
  8. Zillner, K., Jerabek-Willemsen, M., et al. Microscale thermophoresis as a sensitive method to quantify protein: nucleic acid interactions in solution. Methods Mol. Biol. 815, 241-252 (2012).
  9. Wienken, C. J., Baaske, P., Rothbauer, U., Braun, D., Duhr, S. Protein-binding assays in biological liquids using microscale thermophoresis. Nat. Commun. 1, 100 (2010).
  10. Stark, G. R., Darnell, J. E. The JAK-STAT pathway at twenty. Immunity. 36, 503-514 (2012).
  11. Ehret, G. B., Reichenbach, P., et al. DNA binding specificity of different STAT proteins. Comparison of in vitro specificity with natural target sites. J. Biol. Chem. 276, 6675-6688 (2001).
  12. Yang, J., Stark, G. R. Roles of unphosphorylated STATs in signaling. Cell Res. 18, 443-451 (2008).
  13. Timofeeva, O. A., Chasovskikh, S., et al. Mechanisms of unphosphorylated STAT3 transcription factor binding to DNA. J. Biol. Chem. 287, 14192-14200 (2012).
  14. Timofeeva, O. A., Tarasova, N. I., et al. STAT3 suppresses transcription of proapoptotic genes in cancer cells with the involvement of its N-terminal domain. Proc. Natl. Acad. Sci. U.S.A. , (2013).
  15. Patterson, G., Day, R. N., Piston, D. Fluorescent protein spectra. J. Cell Sci. 114, 837-838 (2001).

Play Video

Citar este artigo
Khavrutskii, L., Yeh, J., Timofeeva, O., Tarasov, S. G., Pritt, S., Stefanisko, K., Tarasova, N. Protein Purification-free Method of Binding Affinity Determination by Microscale Thermophoresis. J. Vis. Exp. (78), e50541, doi:10.3791/50541 (2013).

View Video