Chromatin immunoprecipitation is a powerful technique used to profile the localization of a protein or a histone modification along the genome. In a proteomics equivalent, ChIP is followed by MS-based proteomics to identify qualitatively and quantitatively the hPTMs, histone variants and chromatin-binding proteins that are immunoprecipitated together with the modification or protein of interest, used as “bait”. In the N-ChroP approach, outlined in Figure 1A, native ChIP, in which chromatin is digested with MNase (Figure 1B), is used as input to purify from bulk chromatin a distinct functional domain. Digested chromatin enriched in mono-nucleosomes is incubated with a specific antibody and the immunopurified proteins are separated by SDS-PAGE. In the example illustrated, H3K9me3, marker of silent chromatin32,33, is used to set up the approach. The choice is based on the fact that both its functional role as well as some of its protein interactors are well described. Moreover, a highly specific and efficient antibody optimized for ChIP is available34, as also confirmed by visual inspection of the Coomassie gel, where the intact nucleosome, with the core histones at the correct stoichiometry, is enriched in appropriate amounts for MS (Figure 1D).
The comparison between the amount of H3K9me3 present in the flow-through (FT) and input (IN) indicates that about 50% of the region of interest is immunopurified, excluding the risk of a bias due the enrichment of a minor sub-population of chromatin (Figure 1C). MS is employed to characterize the PTMs co-associated within the enriched nucleosomes: each core histone is digested using a protocol designed ad hoc in order to achieve an “Arg-C like” digestion, in polyacrylamide gel. In fact, on the one hand Arg-C is the best protease for MS analysis of hPTMs because it produces peptides of optimal length; on the other hand, it does not cleave efficiently in gel. To overcome this limitation, our tailored protocol exploits the chemical alkylation of lysine achieved by incubating histone gel bands with deuterated (D6)-acetic anhydride, followed by trypsin digestion. Since trypsin does not cleave D3-acetylated lysines, the resulting peptides mixture mimics an “Arg-C like” pattern (Figure 1E).
The addition of a D3-acetyl moiety to a lysine produces an unambiguous delta mass of 45.0294 Daltons, discriminating between native and chemically added acetylations in MS. Moreover, D3-acetylation offers two additional advantages that facilitate the discernment of isobaric modified peptides: first, the alkylation occurs only on unmodified and mono-methylated lysines, but not on di- and tri-methylated residues; as such modified peptides bearing the same total number of modifications but in different arrangements are differentially decorated by distinct set of D3-acetyl groups that produce unambiguous m/z shifts. Second, distinct patterns of D3-alkylation cause slightly different retention times in liquid chromatography on reverse phase column, which generate an additional level of separation for isobaric modified peptides21.
After validation of all hPTMs by manual inspection of the corresponding MS/MS spectra (Figure 2B), the label free quantification is achieved in two steps: first, we calculate the relative abundance of each modification using the signal intensity of the unmodified and modified species for the corresponding peptide, measured through the calculation of the extracted ion chromatograms (XIC) (Figure 2A and 2C, upper panel); second, the relative enrichment is estimated as a ratio between the relative abundance of each modification in the ChIP-ed octamer and the corresponding relative abundance from input (Figure 2C, lower panel). The analysis of the H3(9-17) peptide shows the enrichment of di- and tri-methylated K9, with the corresponding depletion of the unmodified and mono-methylated forms (Figure 2C). With this results as positive control for antibody specificity, the co-association or depletion of all other modifications can be assessed, both at the intra-molecular level on the same H3 and at the inter-molecular level, on other co-enriched histones within the same nucleosome. This allows the screening of hPTMs cross-talks within the H3K9me3 domains, the so-called “heterochromatin modificome” (Figure 2D): the significant enrichment of known markers associated with gene silencing, with the corresponding depletion of markers linked with gene activation is observed. In addition, novel associations are detected such as the enrichment of H3K18me1.
To screen for all proteins co-associating within heterochromatin, the classical crosslinking ChIP is combined with SILAC (Stable Isotope Labelling by Amino acids in Cell culture) (Figure 3A). In the SILAC experiment, the lysine and arginine (light form) are replaced with their isotopically labeled analogs (heavy form) in the culturing medium. Upon cells grown and replication in both light and heavy media, the two differentially isotope-encoded amino acids are metabolically incorporated into proteins, generating light and heavy forms of proteins, respectively, that are distinguishable by MS, due to a specific Δmass. Before starting a large-scale SILAC experiment, the labeling efficiency is evaluated, calculating the incorporation level, measured as the percentage fraction of heavy peptides versus the sum of heavy and light ones, found in the only heavy labeled sample. Incorporation superior to 95% for both heavy arginine and heavy lysine is required for accurate protein quantification (Figure 3B). After crosslinking of heavy and light cells, chromatin is fragmented by sonication. SILAC is used in conjunction with a competition assay using an excess fold of soluble H3 peptide (QTARKSTGG) that bears tri-methylation on K9 in order to discriminate specific H3K9me3 interactors from background. The soluble peptide is added in excess to one of the two SILAC ChIP experiments, where it saturates the binding capacity of the antibody, thus “competing out” the majority of the H3K9me3- nucleosomes and, accordingly, all specific interactors. In the other SILAC channel, the competing peptide is not added to the ChIP and the immunoprecipitation takes place normally. SILAC-competition experiments are typically performed in duplicate in so-called “Forward” and “Reverse” formats, where the competition with the excess soluble peptide is switched from the heavy (H) to the light (L) chromatin samples. This results in inverted complementary SILAC ratio readouts, used for discerning genuine from unspecific binders: proteins specifically enriched are present with a higher intensity in the heavy form in comparison with the light form (protein ratio H/L>1) in the experiment where excess peptide is added to the light channel (Forward) (Figure 4A, upper panel); an opposite trend (protein ratio H/L<1) is observed in the Reverse replica (Figure 4A, lower panel). Proteins whose intensity in the heavy and light form are similar in both Forward and Reverse experiments produce a constant ratio close to 1 and are classified as background (Figure 4B).
The choice of the optimal excess fold for the soluble peptide is important and must be tuned accurately. Typically, we set the correct antibody-to-peptide proportion performing a competition assay using serial dilutions of excess peptide and comparing the level of the “bait” (hPTM/protein) between the positive control ChIP, where the peptide is not added, and the different serial competition ChIPs, by Western Blot or MS. Generally, the optimal excess fold peptide reduces of about 90% the amount of hPTM/protein in the immunoprecipitated material. In fact, on the one hand, the larger the protein ratio obtained, the higher the discriminating power of SILAC; on the other hand, an excessive saturation by the peptide may evict completely the specific binders from the antibody, thus leading to missing H/L ratios for quantification and statistical analysis. For H3K9me3 antibody we defined the correct proportion by measuring the H/L ratio for the QTARK(me3)STGG peptide, in a competition test carried out in a Forward set up and we took this value as a measure of the competition efficiency (Figure 3C).
The intersection of the Forward and Reverse X-ChIP experiments leads to the identification of 635 proteins, present in both experiments and quantified with at least 2 ratio counts. The log2 plot of their H/L ratios represent the so-called “heterochromatome” (Figure 4C), where the genuine H3K9me3 interactors are unambiguously identified as the proteins present within the top 40% of the proteins ratio distributions (upper right quadrant of the scatter plot and Figure 4D).
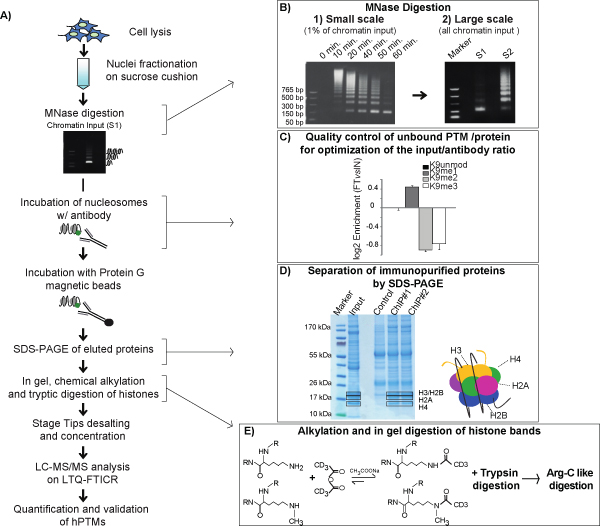
Figure 1: Schematic view of the N-ChroP workflow. A) Scheme of native ChIP combined with MS analysis. Chromatin from cells is digested with MNase and the fraction enriched in mono-nucleosomes (S1) is immunoprecipitated using an anti-H3K9me3 antibody. Immunopurified proteins are separated by SDS-PAGE and core histones are in gel-digested with an ad hoc protocol to mimic an Arg-C digestion. Peptides are analyzed by nano-LC-MS/MS. Histone PTMs are identified, validated by manual inspection of MS/MS spectra and quantified. B) Small scale MNase test: DNA resolved on a 1% agarose gel after chromatin digestion with MNase at different time lapse (left panel); large scale MNase digestion: DNA resolved on a 1% agarose gel after 60 minutes of MNase chromatin digestion and after separation of S1 fraction, containing mono-nucleosomes from S2 faction, containing poly-nucleosomes (right panel). C) Estimation of enrichment/depletion of unmodified, mono-, di-, and tri-methylated K9 in flow-through (FT) compared to input (IN). Histogram represents the average ±SEM from three independent experiments for each modification. D) SDS-PAGE of chromatin input and co-immunopurified proteins: core histones H3, H4, H2A and H2B are visible around and below the 17kDa band, with H3 and H2B co-migrating (black squares). E) Each core histone from both immunoprecipitated nucleosomes and input are chemically alkylated using deuterated (D6)-acetic-anhydride before trypsin treatment, in order to obtain an “Arg-C like” in gel digestion. The D6-acetic anhydride reacts with the Epsilon amino group of unmodified and mono-methylated lysines but not with di-methylated, tri-methylated and acetylated lysines. As result, the enzymatic activity of trypsin is blocked on all native and chemical acetylated lysine, thus producing a “Arg-C like” digestion pattern. This figure has been modified from 21, using Figure 1, Figure S1 and Figure S5 as reference. Click here to view larger image.
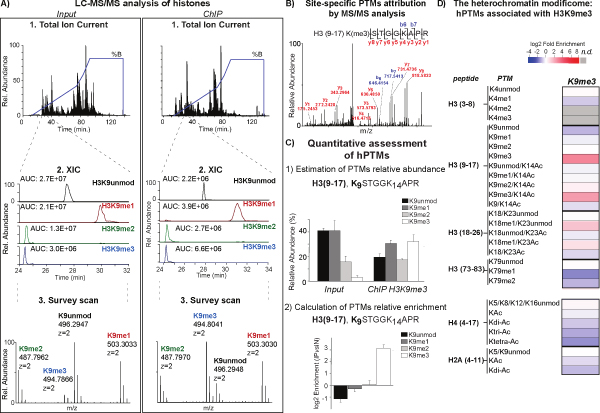
Figure 2: Mass Spectrometry analysis of the H3K9me3 “modificome”. A) Zoomed mass spectra and extracted ion chromatograms (XIC) constructed at the corresponding m/z value of the 2+ charge unmodified, mono-, di-, and tri-methylated K9 in the H3(9-17) peptide, both for input and ChIP samples. B) Representative MS/MS spectra using CID fragmentation. The b-ion and y-ion series allow to define the sequence of H3(9-17) peptide and to localize specifically the tri-methylation on K9 residue. C) Relative abundance of the different degrees of methylation on K9 in the H3(9-17) peptide, estimated by dividing the area under the curve (AUC) of each modified peptide by the sum of the areas corresponding to all observed unmodified and modified forms of that peptide, in the input and ChIP-ed octamer. Histogram represents the average ±SEM from three independent experiments for each modification (upper panel). Relative enrichment of K9 methylations in H3(9-17) peptide. The enrichment is expressed as a log2 ratio between the relative abundance of each methylation in the ChIP-ed octamer as compare to input. Histogram represents the averages ±SEM from three independent experiments (lower panel). D) Heatmap summarizing the enrichment of all co-associating hPTMs identified on histone H3, H4 and H2A. Each row corresponds to a different modification (n.d. are not detected modifications). This figure has been modified from 21, using Figure 1, Figure 2, Figure 3 and Figure S10 as reference. Click here to view larger image.
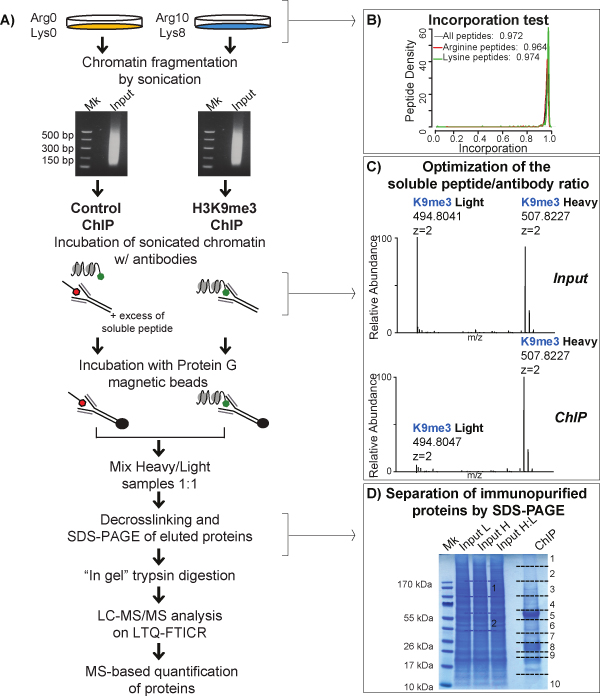
Figure 3: Schematic view of X-ChroP workflow. A) Scheme of crosslinking ChIP combined with MS analysis. Cells grown in light and heavy media are fixed with formaldehyde and chromatin inputs are fragmented by sonication to generate DNA fragments. In a Forward set up, the sonicated heavy-labeled chromatin is immunoprecipitated using anti-H3K9me3 antibody while the light-labeled chromatin is incubated with the same antibody saturated with an excess fold of soluble H3 peptide bearing K9me3. Immunoprecipitated proteins from heavy and light chromatins are pooled, extracted and separated by SDS-PAGE. Proteins are digested with trypsin and peptides are analyzed by nano-LC-MS/MS. B) Efficiency of SILAC labeling is monitored calculating the incorporation of heavy lysine (Lys8) and arginine (Arg10) into proteins. In the plot, the median of lysine and arginine peptides density distribution is equal to 0.974 (green line) and 0.964 (red line), respectively. C) Zoomed mass spectra at the corresponding m/z value of the 2+ charge tri-methylated K9 in the H3(9-17) peptide, both for light and heavy forms, in input and ChIP-ed octamer. While in input the intensities of heavy and light peptide are close to 1, in the Forward SILAC ChIP, the intensity of light peptide is much lower than the one of the heavy counterpart, thus indicating an efficient competition. D) SDS-PAGE of light (L) and heavy (H) labeled chromatin input and of co-immunoprecipitated material: the lane corresponding to the ChIP-ed material is cut in ten slices (black line), while only two slices of input are analyzed for incorporation test analysis (blue line). This figure has been modified from 21, using Figure 4 and Figure S6 as reference. Click here to view larger image.
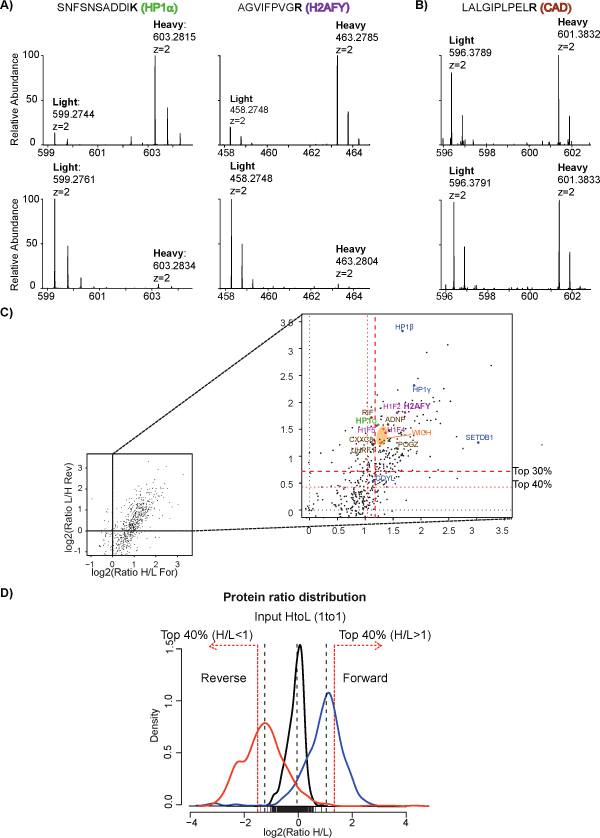
Figure 4: Mass Spectrometry analysis of the H3K9me3 “interactome”. A) Representative full spectra showing the SILAC-pair corresponding to peptides from HP1 and macro-2A proteins: the ratios H/L>1 in the Forward experiment (upper panels), mirrored by a ratios H/L<1 in the Reverse replica (lower panels), demonstrate the specific enrichment of these proteins in heterochromatin. B) Representative full spectra with SILAC-pair corresponding to peptide from one background protein: H/L ratios in Forward and Reverse replicates are equal to 1. C) Quantified proteins are distributed in a scatter plot based on their SILAC-ratios in Forward and Reverse experiments (x and y axes, respectively); red dotted lines represent the top 40% and 30% of protein ratios, as indicated. D) Protein ratios distributions from input (H/L mixed 1:1) (black), Forward (blue) and Reverse (orange) X-ChroP experiments; red dotted lines represent the top 40% of protein ratios, set as cutoffs to select the genuine interactors. This figure has been modified from21, using Figure 5 as reference. Click here to view larger image.
| Buffer for section 2 | Composition |
| Lysis Buffer | 10% sucrose, 0.5 mM EGTA pH 8.0, 15 mM NaCl, 60 mM KCl, 15 mM HEPES, 0.5% Triton, 0.5 mM PMSF, 1mM DTT, 5 mM NAF, 5 mM Na3VO4, 5mM NaButyrate, 5 mg/ml Aprotinin, 5 mg/ml Pepstatin A, 5 mg/ml Leupeptin |
| Sucrose cushion | 2 g sucrose in 20 ml of Lysis Buffer |
| Digestion Buffer | 0.32 M sucrose, 50 mM Tris-HCl pH 7.6, 4 mM MgCl2, 1 mM CaCl2, 0.1 mM PMSF |
| TE Buffer | 10 mM Tris-HCl pH 7.5, 1 mM EDTA |
| Dialysis Buffer | 10 mM Tris-HCl pH 7.6, 1 mM EDTA, 0.5 mM PMSF, 5 mM NAF, 5 mM Na3VO4, 5mM NaButyrate, protease inhibitors cocktail |
| ChIP Dilution Buffer | 100 mM Tris HCl pH 7.6, 100 mM NaCl and 10 mM EDTA |
| Blocking Solution | BSA 0.5% in PBS |
| Washing Buffer | 50 mM Tris-HCl pH 7.6,10 mM EDTA |
| Protease Inhibitors | EDTA-free protease inhibitors cocktail, 0.5 mM PMSF, 5 mM NAF, 5 mM Na3VO4, 5mM NaButyrate |
| Loading Buffer | orange loading dye, 50% (v/v) glycerol in H20 |
| Buffer for section 3 | Composition |
| Lysis Buffer | 50 mM HEPES-KOH pH 7.5, 140 mM NaCl, 1 mM EDTA, 10% glycerol, 0.5% NP-40, 0.25% Triton-100, 0.5 mM PMSF, 5 mM NAF, 5 mM Na3VO4, 5mM NaButyrate, 5 mg/ml Aprotinin, 5 mg/ml Pepstatin A, 5 mg/ml Leupeptin |
| Washing Buffer | 10 mM Tris-HCl pH 8, 200 mM NaCl, 1 mM EDTA, 0.5 mM EGTA, 0.5 mM PMSF, 5 mM NAF, 5 mM Na3VO4, 5mM NaButyrate, 5 mg/ml Aprotinin, 5 mg/ml Pepstatin A, 5 mg/ml Leupeptin |
| ChIP Incubation Buffer | 10 mM Tris-HCl pH 8, 100 mM NaCl, 1 mM EDTA, 0.5 mM EGTA, 0.1% sodium deoxycholate, 0.5% sodium lauroylsarcoside, 0.5 mM PMSF, 5 mM NAF, 5 mM Na3VO4, 5 mM NaButyrate, 5 mg/ml Aprotinin, 5 mg/ml Pepstatin A, 5 mg/ml Leupeptin |
| Washing Buffer 2 | 20 mM Tris-HCl pH 7.6, 2 mM EDTA, 0.1 % SDS,1 % Triton-100 |
| Loading Sample Buffer | 250 mM Tri-HCl pH 8.8, 0.5 M b-mercaptoethanol, 2% SDS |
| Buffer for section 4 | Composition |
| Alkylation Buffer | 55 mM iodoacetamide in 50 mM NH4HCO3 |
| Reduction Buffer | 10 mM dithiothreitol in 50 mM NH4HCO3 |
| Extraction Buffer | 30% ACN and 3% TFA in ddH20 |
Table 1. Buffers Composition.
| Tuning acquisition file | Parameters |
| FT full scan | accumulation target value 1 x 10⁶; maximum filling time 1,000 msec |
| IT MSn | accumulation target value 10 x 104; maximum filling time 150 msec |
| Acquisition setting | Parameters |
| Electrospray voltage | 2.4 kV |
| Sheath and auxiliary gas flow | No |
| Ion transfer capillary temperature | 200 °C |
| Dynamic exclusion | up to 500 precursor ions for 60 sec upon MSMS |
| Exclusion mass width | 10 ppm |
| Normalized collision energy using wide-band activation mode | 35% |
| Ion selection thresholds | 100 counts |
| Activation q | 0.25 |
| Activation time | 30 msec |
Table 2. MS settings.
| Mascor Deamon search | Parameters | Notes |
| Database | depends on the organism (i.e. for HeLa cells: human database, version 3.68; 87,061 entries) | |
| Enzyme | Arg-C | Arg-C cleave at the C-terminal of all arginine residues |
| Variable modifications | acetyl (K), oxidation (M), D3-acetylation (K), methyl-D3-acetyl (K), dimethyl (k), trimethyl (K) | acetyl [42.010 Da], oxidation [15.995 Da], D3-acetylation [+45.0294 Da], methyl-D3-acetyl [sum of +14.016 Da and +45.0294 Da], dimethyl [28.031], trimethyl [42.046 Da] |
| Missed cleavages | up to 2 | |
| Mass accuracy of the parent ions in the search | 10 ppm | |
| Mass-accuracy for CID MSMS | 0.5 Da | |
| MaxQuant search | Parameters | Notes |
| Database | depends on the organism | |
| Enzyme | trypsin/P | Trypsin cleaves at the C-terminal of all lysine and arginine residues. The search is performed taking in account the fact that the efficiency of trypsin to cleave lysine and arginine is reduced when the next amino acid is the proline (/P). |
| Fixed modification | carbamidomethylation | |
| Variable modifications | N-acetyl (Protein), oxidation (M) | |
| Missed cleavages | up to 3 | |
| Label parameters | lys8 and arg10 | |
| Maximum label amminoacid | 3 for Trypsin | |
| Mass-accuracy of the parent ions in the initial “Andromeda” search | 20 ppm | |
| Mass accuracy of the parent ions in the main “Andromeda” search | 6 ppm | |
| Mass-accuracy for CID MSMS | 0.5 Da (six top peaks per100 Da) | |
| Peptide false discovery rates (FDR) | 0.01 | |
| Protein false discovery rates (FDR) | 0.01 | Setting the FDR for peptide and protein to 0.01 means that both peptides and proteins identified are expected to contain 1% of false positives. This value is estimated using a target-decoy database |
| Maximum posterior error probability (PEP) | 1 | PEP is the probability that an individual peptide is a false positive match. PEP equal to 1 in your setting means that all peptides will be taken irrespective of the PEP thus filtering is based exclusively on FDR. |
| Minimum peptide length | 6 | |
| Minimum number of peptides | 2 | |
| Minimum number of unique peptides | 1 | |
| Using only unmodified peptides and oxidation (M)/acetyl (Protein N-Term) | activate the option | Peptides with modifications should generally not be counted for protein quantification since their abundance may not reflect the ratio of the corresponding protein. |
| Minimum ratio count | 1 | |
| “Match between runs” | activate the option | This option matches precursor masses in a 2-min retention time window (after realignment of the runs) based on the accurate mass measurement and allows transferring the MS/MS identification between the different LC MS/MS runs. |
Table 3. Data Analysis.
