An Engulfment Assay: A Protocol to Assess Interactions Between CNS Phagocytes and Neurons
Summary
Microglia are the resident immune cells of the central nervous system (CNS) with a high capacity to phagocytose or engulf material in their extracellular environment. Here, a broadly applicable, reliable, and highly quantitative assay for visualizing and measuring microglia-mediated engulfment of synaptic components is described.
Abstract
Phagocytosis is a process in which a cell engulfs material (entire cell, parts of a cell, debris, etc.) in its surrounding extracellular environment and subsequently digests this material, commonly through lysosomal degradation. Microglia are the resident immune cells of the central nervous system (CNS) whose phagocytic function has been described in a broad range of conditions from neurodegenerative disease (e.g., beta-amyloid clearance in Alzheimer’s disease) to development of the healthy brain (e.g., synaptic pruning)1-6. The following protocol is an engulfment assay developed to visualize and quantify microglia-mediated engulfment of presynaptic inputs in the developing mouse retinogeniculate system7. While this assay was used to assess microglia function in this particular context, a similar approach may be used to assess other phagocytes throughout the brain (e.g., astrocytes) and the rest of the body (e.g., peripheral macrophages) as well as other contexts in which synaptic remodeling occurs (e.g. ,brain injury/disease).
Introduction
Synaptic circuits remodel throughout the life of an animal. In the developing brain, synapses form in excess and must undergo synaptic pruning which involves the selective removal of a subset of synapses and the maintenance and strengthening of those synapses that remain8-10. This process is necessary to achieve the precise connectivity characteristic of the adult nervous system. In the adult, synapses can also be plastic, particularly in the context of learning and memory. The structural correlates of this plasticity are thought to include the addition and/or elimination of dendritic spines and presynaptic boutons11-13. In addition to these roles in the healthy nervous system, synaptic remodeling is also involved in nervous system disease/injury12,14,15. For example, following spinal cord injury, severed axons must subsequently remodel and form new synapses to achieve functional recovery16-19.
Emerging as an important aspect of synaptic plasticity is the process of phagocytosis or engulfment of synapses destined for removal3,5,20. We recently showed this phenomenon in the context of synaptic pruning in the healthy, postnatal mouse brain7. Specifically, microglia, the resident CNS immune cells and phagocytes, were shown to engulf presynaptic inputs during a peak period and in a region of developmental synaptic pruning, the postnatal dorsal lateral geniculate nucleus (dLGN) of the thalamus. Genetic or pharmacological blockade of this engulfment resulted in sustained deficits in synaptic connectivity.
In this protocol, we describe a reliable and highly quantitative assay to measure phagocyte-mediated engulfment of presynaptic inputs. For the purposes of this article, this assay will be presented in the context of the developing retinogeniculate system, which includes retinal ganglion cells (RGCs) residing in the retina that project presynaptic inputs to the dLGN (Figure 1A). To begin, a lysosomal degradation-resistant anterograde labeling strategy will be described, which is used to visualize RGC-specific presynaptic inputs in the dLGN (Figure 1)7,21. Following this description, a detailed methodology for imaging and quantitatively measuring engulfment using confocal microscopy combined with 3 dimensional (3D) surface volume rendering will be given. This methodology is based on fixed tissue preparation but may also be adapted for use in live imaging studies. Importantly, while the assay has been validated in the context of the healthy, postnatal retinogeniculate system, one could apply the same techniques to assess other phagocyte-neuron interactions throughout the brain and during disease, as well as phagocyte function in other organ systems.
Protocol
1. Anterograde Labeling of RGC Presynaptic Inputs
Note: All experiments involving the use of animals were reviewed and overseen by the institutional animal care and use committee (IACUC) in accordance with all NIH guidelines.
- Sterilize field and instruments.
- Anesthetize mouse with 4 vol % isoflurane in a Plexiglas induction chamber (this vol % isoflurane works for neonatal-adult mice). Observe mice closely to avoid over-anesthetizing. CAUTION: Avoid inhalation with a vacuum waste gas evacuation.
- After 1-3 min, (older mice will require less time) ensure appropriate level of anesthesia is achieved by pinching the tail (no reaction should be observed) and observing breathing rate (rate should be slow and steady).
- Place mouse under the stereo microscope on its side and place nose cone delivering 3-4 vol % isoflurane over the snout (neonates < postnatal day 10 (P10) ~4 vol %; >P10 ~3 vol %).
- Expose the sclera. For injection of neonates prior to eye opening, use a pair of small spring scissors to open the eyelid and pull back the skin to expose the sclera. For older mice, use fingers to pull back the skin surrounding the eye to expose the sclera. CAUTION: In neonates, sometimes another perpendicular cut at the corner of the eye is necessary. Take care when cutting the corner of the eyelid as there is a blood vessel that, if cut, will bleed excessively.
- Use a sterile 30.5 G needle to puncture a small hole in the side of the eye at the line where the sclera begins. Take care to avoid damaging the lens by inserting the needle just far enough that the bevel goes into the eye.
- Allow the vitreous to flow out of the hole and use a sterile cotton-tipped applicator to absorb the liquid.
- Once the vitreous has stopped flowing out of the hole, insert a blunt ended needle attached to a Hamilton syringe preloaded with anterograde tracing dye into the hole. CAUTION: Insert needle slowly to avoid puncturing the other side of the eye or damaging the lens.
- Slowly inject dye into the eye. Typically, cholera toxin β subunit conjugated to Alexa 594, 647, or 488 (CTB-594, CTB-647, or CTB-488, 5-6 µg/µl) is used to anterogradely trace RGC inputs. For neonates (≤P10) 1-2 µl is sufficient and for mice >P10 ~3 µl is sufficient. Note: Alexa dyes are particularly resistant to lysosomal degradation
- Leave the needle in the hole for a few seconds and then slowly remove.
- Use a cotton tipped applicator to absorb excess fluid and prevent dye from leaking out.
- Apply a small amount of antibiotic ointment to the eye. If eye was surgically opened, gently reposition the eyelids together.
- If injecting both eyes, repeat procedure on other eye.
- Following injection(s), leave mouse under a heat lamp or on a heat pad until it begins to recover from the anesthesia.
- Return mouse to a clean home cage and monitor to make sure it is fully awake before returning to the colony.
2. Prepare Tissue for Imaging
This tissue preparation protocol is used for reporter mice in which the phagocytes are labeled with fluorescent markers (e.g., CX3CR1-EGFP for microglia). If a reporter line is not available, the investigator can immunostain tissue sections (see Discussion).
- ~24 hr after the injection, sacrifice the mouse and dissect the brain.
- Drop fix the brain in a Falcon tube filled with 4% paraformaldehyde (PFA) overnight at 4 °C. CAUTION: PFA is toxic. Avoid inhalation and skin exposure by using in a fume hood or on a downdraft table and wearing personal protective equipment. Notes: Fixation can be shorter (≥4 hr). In addition, instead of drop fixing, 4% PFA perfusion can be used followed by a 2-24 hr drop fix. However, comparison of perfused to drop fixed neonatal and adult brains revealed no difference in image quality or quantification.
- Rinse the brain 3x in phosphate buffered saline (PBS).
- Pour the brain and PFA into an empty weigh boat.
- Use a spatula to transfer the brain to another weigh boat filled with PBS.
- Wash brain twice more in PBS (transfer brain to two more weigh boats filled with PBS).
- Transfer the brain to a Falcon tube filled with a 30% sucrose solution. Leave the brain in sucrose at 4 °C until the brain sinks to the bottom of the tube (24-48 hr).
- Once the brain sinks, prepare the brain for sectioning. The following steps are preparation of 40 µm floating sections using a sliding microtome with a freezing stage (a cryostat can also be used).
- Use a razor blade to remove parts of the brain that are not needed (for the dLGN, remove the rostral and caudal parts of the brain).
- Freeze the brain on aluminum foil over dry ice. During this time, freeze the microtome stage and fill each well of a 24-well plate with 0.5 ml of 0.1 M phosphate buffer (PB).
- Mount the frozen brain (it should appear opaque) on the freezing stage.
- Apply a small amount of optimal cutting temperature compound (OCT) to the stage.
- Once the OCT begins to freeze, lay the brain in the OCT. The end of the brain that will be cut should be facing up (e.g., for the dLGN, face the caudal side up).
- Cover the brain and OCT with very finely crushed dry ice.
- Leave dry ice on the brain/OCT for ~30 sec.
- Use a large paint brush to remove the dry ice. The brain and OCT should be frozen to the stage.
- Begin sectioning through the tissue until the region of interest (ROI) is reached.
- Once the ROI is reached, use a small paint brush to remove sections from the blade and transfer them to the 24-well plate containing 0.1 M PB (step 2.5.2). Keep the paint brush moist by wetting it in the 0.1 M PB prior to removing sections from the blade. Note: Sections can be left in 0.1 M PB overnight at 4 °C.
- Once sections have been collected, visualize the anterograde labeling under a fluorescent dissecting microscope and choose sections that contain the ROI.
- Mount sections on a slide with a small paint brush.
- Apply a small pool of 0.1 M PB to a charged microscope slide.
- Transfer the tissue section to the pool of PB.
- Use the PB and paint brush to orient and spread the tissue.
- Use a Kimwipe to wick off excess PB. Take care to avoid wicking off the section.
- Allow to completely air dry.
- Apply a small drop of mounting medium to each section and mount a coverslip on top (22 x 50 mm, No. 1.5).
- Seal edges of slide with nail polish and store at -20 °C until imaging session. Note: Although imaging within a week of preparation is advised, slides can be maintained at -20 °C for several weeks prior to imaging.
3. Imaging Tissue
All images are acquired on a spinning disk confocal microscope (UltraView Vox spinning disk confocal microscope equipped with diode lasers (405 nm, 445 nm, 488 nm, 514 nm, 561 nm, and 640 nm)). Images can also be acquired on any microscope with the ability to acquire high resolution z-stacks (e.g., laser scanning confocal microscope, epifluorescent microscope followed by deconvolution, etc.). Frame size is typically 1,000 x 1,000 pixels.
- Find ROI at 10X magnification and acquire an image. For imaging microglia in the retinogeniculate system, the ROI is the most medial dLGN sections.
- Shift to higher magnification (a 60X Plan Apo objective, NA = 1.4, is typically used).
- Acquire first field of view containing phagocytes using 0.2 µm z-steps.
- Acquire 15-19 more fields containing phagocytes per animal.
4. Prepare Images for Quantification (ImageJ)
- Open z-stack in ImageJ.
- Go to the Image menu, select Color and Split Channels.
- Subtract background from the channel(s) containing the engulfed material.
- Select the channel window containing the engulfed material (e.g., presynaptic inputs).
- Go to the Process menu and select Subtract Background. Use a rolling ball radius of 10 pixels for anterograde tracing of presynaptic inputs in the dLGN. Note: The rolling ball radius is determined empirically. However, it should generally be as large as the radius of the largest object in the image that is not part of the background.
- Smooth the channel containing the phagocyte.
- Select the channel window containing the phagocyte (e.g., microglia).
- Go to the Process menu and select Filters, Mean. Use a mean filter of 1.5 (this smoothes the image for surface rendering in later steps).
- Subtract background from the channel containing the phagocyte.
- Select the channel window containing the phagocyte (e.g., microglia).
- Go to the Process menu, select subtract background (settings will need to be empirically determined). Use a rolling ball radius of 50 pixels for EGFP-positive microglia.
- Merge channels by going to the Image menu and selecting Color, Merge Channels.
- Crop ROI containing phagocyte from merged file (this makes surface rendering faster, see step 5).
- Draw a box around the ROI using the rectangular selections tool in the tool bar.
- Go to the Image menu and select Crop.
- Split channels again (see step 4.2).
- Save each channel as its own TIFF file.
5. Prepare Image for Quantification in Imaris
- Open Imaris and make sure that the Volume icon is selected in the top left menu (Figure 2).
- Open first channel of cropped image (any of the channels can be opened first, just be consistent).
- Add the other channel(s). Go to the Edit menu, select Add Channels and select the next channel in the file. (Repeat this step for any remaining channels). Note: To change the color, go to the Display Adjustment window and click on the channel name (Figure 3A). This will bring up a dialogue box to adjust the color. If the Display Adjustment window is not visible, go to the Edit menu and select Display Adjustment.
- Adjust the pixel values. Go to the Edit menu and select Image Properties. In this window, adjust x, y, and z pixel values (These values depend on the microscope, objective, camera, and z-step acquisition and can be found in the software used to acquire the image).
- Step 5.5 will result in a very small image. To resize, click on the Fit icon in the bottom right corner (Figure 2).
- In the Display Adjustment window, adjust the brightness and contrast for each channel using the left and middle triangles.
6. 3 Dimensional (3D) Surface Rendering of the Phagocyte
- In the top tool bar, be sure the Surpass mode is selected (Figure 3C).
- In the Display Adjustment window, uncheck all channels except the phagocyte channel. This will remove them from the field of view.
- Click the Surface Rendering icon (Figure 2).
- A create window will be displayed in the bottom left (Figure 4A), make sure Segment ROI is unchecked in this first window. Click the blue forward button at the bottom.
- Adjust the smoothing.
- In the next window, choose the phagocyte channel from the pull down menu (Figure 4B). This adjusts the amount of detail that will be surfaced and should be determined empirically (0.1 µm smoothing is typically used for microglia).
- Select Absolute thresholding.
- Click on the blue forward button at the bottom.
- Threshold the image.
- Click on histogram and drag until image is surfaced appropriately (Figure 4C). This is determined empirically by rotating the image to ensure the grey surfaces overlaid on the fluorescent image are an accurate surface representation. Notes: To rotate, select Navigate in the Pointer menu on the upper right side of the screen (Figure 3B), click and hold image to rotate. To return image to original orientation, select Origin Bottom Left from the View menu.
- Click on the blue forward button at the bottom.
- In the next window, there is an option to filter out any surfaces by size, etc. Unless image is very noisy, do not filter and delete any filters that automatically appear. Click the green arrow at the bottom to finish surface rendering the phagocyte. A new set of tabs will appear (Figure 5)
- If necessary, delete any surfaces that are not part of the phagocyte of interest.
- Make sure that the Select option is selected in the Pointer menu (Figure 3B).
- Click on any surface to be deleted so that it turns yellow. To delete multiple surfaces, click on the surfaces while holding down the control button.
- Click Delete under the Pencil tab.
- Select and merge all the surfaces of the phagocyte into one surface.
- Click on the Funnel (i.e. Filter tab; Figure 5C).
- Click Add.
- Choose any filter, drag the histogram to the far left (all surfaces should be yellow).
- Go back to the Pencil tab and click Unify.
- Go to the Graph tab (Figure 5A) and click on Details and select any parameters to display. Select the volume (Figure 5D). For displaying multiple parameters, go to the Wrench icon at the bottom left (Figure 2) and select parameters to record.
- Record the volume of the phagocyte and save the file before continuing.
7. 3D Surface Rendering of Engulfed Material
- Create a new channel for material that has been engulfed by the phagocyte.
- While the phagocyte surface is selected, click on the pencil tab.
- Click Mask All.
- In the dialogue that appears, select the channel corresponding to engulfed material (e.g., anterograde tracing of presynaptic inputs; Figure 5B).
- Check duplicate channel before applying mask and hit OK.
- A new channel will appear in the Display Adjustment window that contains only the material that has been engulfed and is inside the phagocyte.
- Surface render the channel containing total engulfed and nonengulfed material.
- Uncheck all channels in the Display Adjustment window except for the channel to be surfaced and uncheck the surface created for the phagocyte.
- Click on the Surface rendering icon again (see step 6.3) and create a surface for the channel using the same steps as described for the phagocyte (steps 6.4-6.11). Notes: Be sure to select the correct channel prior to smoothing and thresholding (step 6.5; Figure 4B). Make note of the threshold value (see step 6.6; Figure 4C). This value can also be obtained after the surface rendering is complete (Wand tab; Figure 5A).
- Record the volume of the total engulfed and non-engulfed material and save the file before continuing.
- Surface render engulfed material (material within the phagocyte).
- Visualize fluorescence of only the new channel of engulfed material (see step 7.2.1).
- Follow the same steps as above (steps 7.2-7.3). Notes: Be sure to select the correct channel from the pull down menu prior to smoothing (choose the new channel created in step 7.1). In the threshold window, manually enter the threshold value that was set for rendering the total engulfed and non-engulfed material (see step 7.2.2).
- Record the volume of the engulfed material and save file before continuing.
8. Calculate the Total Volume of the Field of View
- Create a new surface for any channel.
- In the thresholding window (step 6.6), slide the histogram all the way to the left so that the entire field is surfaced.
- Finish surfacing the entire field and record the volume (steps 6.7-6.11).
- Save the file.
9. Calculate the Amount of Phagocytosed Material
- Calculate the density of the total engulfed and non-engulfed material channel using the following algorithm:
Volume of Total Engulfed and Non-Engulfed Material (step 7.3) / Volume of Field (step 8). - Calculate % engulfment per cell using the following algorithm:
(Volume of Engulfed Material (step 7.5) / Total Volume of the Phagocyte (step 6.11)) x 100
Notes: To account for variations in cell size, data are normalized to the total volume of the phagocyte. If numbers from step 9.1 are highly variable across fields, it may be necessary to normalize the data from step 9.2 to the calculation in 9.1.
Representative Results
Recently, we used this engulfment assay to visualize and quantify microglia-mediated engulfment of presynaptic inputs in the developing retinogeniculate system (Figure 1)7. RGCs from CX3CR1-EGFP heterozygous mice were anterogradely traced with CTB-594 and CTB-647 into the left and right eyes, respectively. Following this tracing, EGFP-positive microglia within the dLGN were imaged. These images were subsequently surface-rendered for volume measurements.
Using this technique, we found that during a peak period of developmental synaptic remodeling within the dLGN (P5), presynaptic inputs are engulfed by microglia (Figure 6). As few as 4 days later when a large amount of remodeling is nearly complete (P9), there is a dramatic reduction in the amount of engulfed inputs. In addition, engulfment and pruning are disrupted in mice deficient in proteins belonging to the classical complement cascade (Figure 6) as well as following manipulation of neuronal firing (data not shown)7.
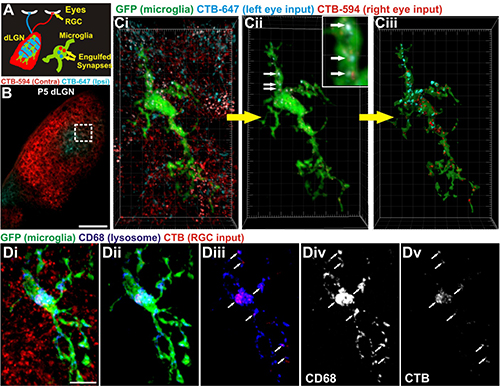
Figure 1. Strategy to assess microglia-mediated engulfment of RGC presynaptic inputs7. A) Schematic of anterograde tracing strategy. Left and right eye RGC inputs are traced with CTB-647 (blue) and CTB-594 (red), respectively. Microglia-mediated (green) engulfment of inputs is subsequently assessed. B) A representative low magnification image of postnatal day 5 (P5) mouse dLGN following anterograde tracing of left (blue) and right (red) eye inputs. Scale bar = 100 µm. Ci) A microglia (EGFP, green) sampled from the border region of left (blue) and right (red) eye inputs (inset in B). Cii) All CTB fluorescence outside the microglial volume has been subtracted revealing RGC inputs (red and blue) that have been engulfed (arrows, enlarged in inset). Ciii) Surface rendering of microglia and engulfed RGC inputs. Grid line increments = 5 µm. Di) A representative microglia (green, EGFP) from P5 dLGN. RGC inputs are labeled with CTB-594 (red) and lysosomes are labeled with anti-CD68 (blue). Dii) All CTB fluorescence outside the microglia volume has been removed revealing engulfed RGC inputs (red) and lysosomes (blue) within the microglia (green). Diii) Most RGC inputs (red) are completely localized within CD68-positive lysosomes (blue; white arrows). Div-v) The CD68 (Div) and CTB (Dv) channels alone. Scale bar = 10 µm. Please click here to view a larger version of this figure.
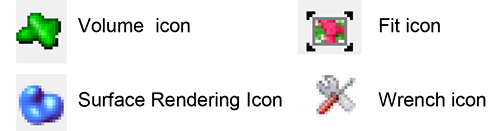
Figure 2. Imaris software icons.
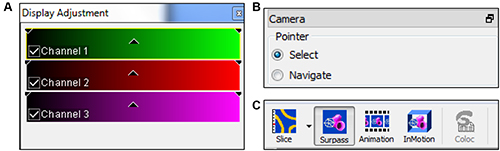
Figure 3. General navigation windows in software. A) The Display Adjustment Window. B) The Pointer Window. Select will allow selection of specific surfaces. Navigate will allow the rotation of an image in the field of view. C) It is necessary to be in Surpass mode for surface rendering the volume.
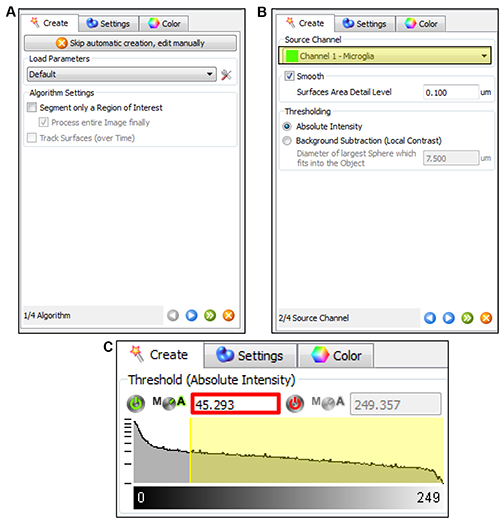
Figure 4. Surface rendering in software. A) The Create window. B) Smoothing window. Select the channel to surface from the pull down menu (highlighted in yellow). C) Thresholding the surface to the fluorescent image. Highlighted by the red box is the threshold value that should be recorded for total engulfed and non-engulfed material. This number will be applied later to threshold and surface the engulfed material. Please click here to view a larger version of this figure.
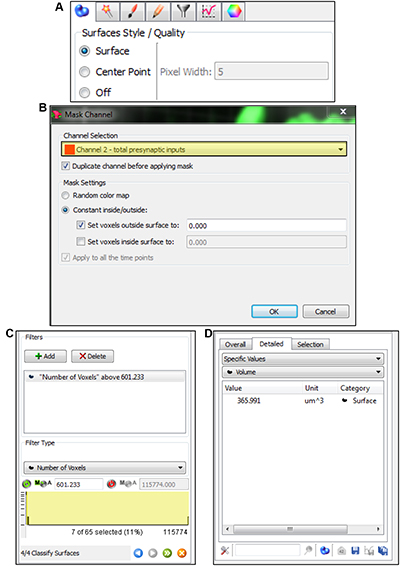
Figure 5. Obtaining volume measurements in software. A) Tabs that appear following surface rendering. Note the Wand, Pencil, Funnel, and Graph tabs that are identified in the text. B) The Mask all feature to visualize engulfed material within the phagocyte. Note the channel selected (yellow box). C) The feature under the Funnel/Filter tab allows the selection of all surfaces in the field by sliding the histogram all the way to the left so it appears yellow. Any filter can be chosen for this. D) Under the Graph tab, volume measurements can be obtained and recorded. Please click here to view a larger version of this figure.
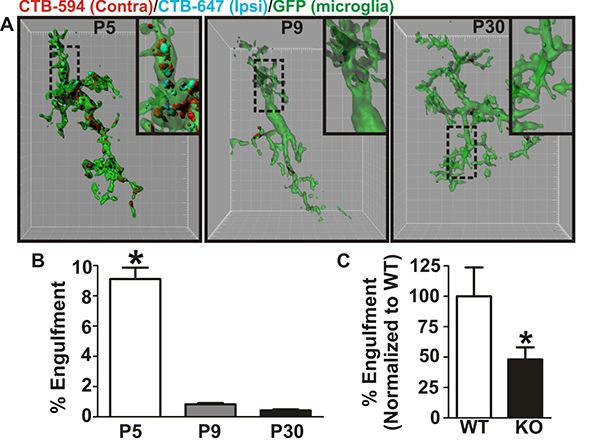
Figure 6. Representative data7. A) Representative surface-rendered microglia from P5 (fluorescent image is shown in Figure 1), P9, and P30 mouse dLGN. Enlarged insets denoted with a black dotted line. Grid line increments = 5 µm. B) Engulfment of RGC inputs is significantly increased during peak pruning in the dLGN (P5) versus older ages (P9 and P30). *P < 0.001 by one-way ANOVA, n = 3 mice/age. C) Microglia from mice deficient in complement receptor 3 (KO, black bar) engulf significantly fewer RGC inputs as compared to WT littermates (white bar). All data are normalized to WT control values. *P < 0.04 by Student’s t-test, n = 3 mice/genotype. All error bars represent s.e.m. Click here to view larger image.
Discussion
In order to accurately measure phagocytosis, engulfed material must be labeled in such a way that the researcher can visualize it once lysosomal degradation has occurred. In addition, high resolution imaging is required, followed by the use of software that will enable the researcher to visualize the volume of the entire cell and quantify its contents. In this protocol, we describe a highly reliable and quantitative method for measuring phagocyte-mediated engulfment using CTB conjugated to Alexa dyes to label engulfed material combined with high resolution confocal microscopy and 3D reconstruction. This methodology has been used in our lab to successfully analyze microglia mediated-engulfment of presynaptic inputs undergoing synaptic remodeling in the developing mouse brain (retinogeniculate system)7. In addition, it has proven to be a highly sensitive technique that can distinguish subtle changes in engulfment across different developmental ages under non-pathological conditions and between wildtype and knockout mice. With minor adjustments, this protocol can be adapted to study engulfment in live tissues by time lapse imaging. In addition, this protocol may be applied to study phagocyte-neuron interactions in disease.
Caveats
One of the most useful aspects of this assay is the ability to label neuronal projections in such a way that they remain visible after entering a lysosomal degradation pathway. However, because the neuron is labeled, it may be difficult to distinguish what part of the cell has been phagocytosed. This requires a very careful regional analysis (e.g., synaptic region versus a non-synaptic region of the dLGN) combined with electron microscopy7. In addition, this may prove more difficult in other brain regions where neuronal cell bodies and projections reside in the same area. However, alternative labeling strategies may be employed (see below). Furthermore, due to the resolution limits of light microscopy, there is a possibility that one may overestimate the amount of engulfed material. As a result, care must be taken to validate that engulfed material is within lysosomes. For this reason, we use anti-CD68 to label lysosomes within microglia, 3D rendering, and orthogonal views to validate the parameters of the assay.
Cell Types
In addition to microglia, this methodology could also be applied to analyze the role of other phagocytes in the brain (e.g., astrocytes) and in the peripheral nervous and immune systems (e.g., perisynaptic Schwann cells, macrophages, etc.). In addition, because CTB conjugated to Alexa dyes is so readily taken up by most cells, a similar labeling strategy may be used to label engulfed material throughout the brain and other organ systems.
Labeling of Engulfed Material
As an alternative to CTB conjugated to Alexa dyes, we have used the following strategies to label engulfed material7: 1) Fluorescent reporter mice in which RGCs were labeled with a fluorescent protein (e.g., tdTomato, EGFP, etc.). 2) Anterograde labeling with a pHrodo dye conjugated to dextran, a dye that only fluoresces once it is in a lysosome. Using these different strategies, visualization and quantification of engulfed presynaptic inputs within microglia can be performedwith the same imaging and quantification techniques. However, the Alexa dye conjugates are the most robust due to the high resistance of Alexa dye to lysosomal hydrolases7,21. In addition, labeling of engulfed material with antibodies (e.g., anti-VGlut2, a presynaptic vesicular protein) has been attempted. However, this is a relatively unreliable method of detection given that most proteins are rapidly broken down once in lysosomes. It is difficult to distinguish low fluorescence due to protein degradation over background.
Animals Used
In the current protocol, microglia are fluorescently labeled genetically using fluorescent reporter mice (CX3CR1-EGFP)22. However, there are instances in which antibody labeling versus genetic expression of fluorescent reporter constructs is necessary. For example, when fluorescent reporter mice are not available for the phagocyte of interest, the use of rats is necessary, or the researcher wishes to look at knockout mice without crossing them into a fluorescent reporter mouse line. For instances such as these, phagocytes can be labeled using immunohistochemistry and data are comparable to results from experiments using fluorescent reporter mice7. Following tissue sectioning, we typically use a standard immunostaining protocol for floating sections7. It is important to choose an antibody raised against a protein that will label the entire cell and its processes. For example, to label microglia, anti-Iba1 can be used.
Broader Applications: Live Imaging and Disease
While this protocol is based on analysis of fixed tissue, slight modifications would enable the same analysis in images acquired by live imaging. Following a time lapse imaging session, the subsequent z-stacks can be processed identical to steps 4-9 in this protocol. Furthermore, while we have applied this protocol to visualize engulfment of synapses during developmental synaptic remodeling in the healthy CNS, this protocol can also be applied in disease models. In particular, this protocol can be used to study diseases in which synapses undergo substantial remodeling, such as in the case of synapse loss and regeneration following spinal cord injury, early synapse loss associated with Alzheimer’s disease, etc12,14-19,23-26. In addition, one may also adapt this technique to study diseases in which phagocytosis of material other than synapses has been described, such as microglia/macrophage-mediated engulfment of myelin in demyelinating disease (e.g., multiple sclerosis) and engulfment of beta-amyloid in Alzheimer’s disease5,6,27-29.
In conclusion, the engulfment assay described here offers a convenient, reproducible, and sensitive technique to study phagocyte interactions with their extracellular environment. Importantly, this assay has a broad range of uses and capabilities that will serve the neuroscience community as well as those working in other organ systems.
Declarações
The authors have nothing to disclose.
Acknowledgements
Work was supported by grants from the Smith Family Foundation (B.S.), Dana Foundation (B.S.), John Merck Scholars Program (B.S.), NINDS (RO1-NS-07100801; B.S.), NRSA (F32-NS-066698; D.P.S.), Nancy Lurie Marks Foundation (D.P.S.), NIH (P30-HD-18655; MRDDRC Imaging Core).
Materials
| Heat pad | Vet Equip, Inc. | 965500 | |
| Warm water source for heat pad | Kent Scientific | TP-700 | |
| Stereo microscope | DSC Optical | Zeiss Opmi -6 Surgical Microscope | |
| Sliding microtome with freezing stage | Leica | SM2010 R | |
| Microtome blade | Leica | 14021607100 | |
| Fluorescent dissecting microscope | Nikon | SMZ800 with Epi-fluorescence attachment | |
| Spinning disk confocal microscope | Perkin Elmer | UltraView Vox Spinning Disk Confocal | |
| 10 µl Hamilton gas tight syringes | Hamilton | 80030 | Use a different syringe for each color dye/tracer |
| Hamilton needles | Hamilton | 7803-05, specifications: blunt, 1.5" | |
| Alexa-conjugated cholera toxin β subunit (CTB) | Invitrogen | 488: C22841 | Reconstitute in sterile saline, 80 µl (488), 100 µl (594), 20 µl (647) |
| 594: C22842 | |||
| 647: C34778 | |||
| Phosphate Buffered Saline (PBS) | Sigma | P4417-50TAB | |
| Neomycin and Polymyxin B Sulfates and Bacitracin Zinc Ophthalmic Ointment USP (antibiotic ointment) | Bausch & Lomb | 24208-780-55 | |
| 30.5 gauge needle | Becton Dickinson | 305106 | |
| Spring scissors | Roboz | RS-5630 | |
| Cotton-tipped applicator | Fisher | 23-400-125 | |
| Paraformaldeyde (PFA) | Electron Microscopy Sciences | 15710 | Dilute 16%to 4% in PBS. Paraformaldehye is toxic, use in a fume hood and wear personal protective equipment. |
| Dissection tools – scissors, forceps, spatula | Small scissors: Fine Science Tools | Small scissors:14370-22 | |
| Large scissors: Roboz | Large scissors: RS-6820 | ||
| #55 forceps: Fine Science Tools | #55 forceps: 11255-20 | ||
| Spatula: Ted Pella, Inc. | Spatula: 13504 | ||
| Sucrose | Sigma | S8501-5KG | Make 30% sucrose in PBS (weight/vol) |
| OCT Compound | VWR | 25608-930 | |
| Weigh boat | USA Scientific | 2347-1426 | |
| 24-well plates | BD Biosciences | 353047 | |
| Sodium phosphate monobasic | Sigma | S6566-500G | Make 0.2 M sodium phosphate monobasic (PB-A) in ddH20 and 0.2 M sodium phosphate dibasic (PB-B) in ddH20. To make 0.1 M PB, combine 19 ml PB-A and 81 ml PB-B, fill to 200 ml with ddH20 |
| Sodium phosphate dibasic | Sigma | S5136-500G | |
| Coverslips, 22 X 50 mm, No. 1.5 | VWR | 48393 194 | |
| Charged microscope slide | VWR | 48311-703 | |
| Vectasheild | Vector Laboratories | H-1200 |
Referências
- Ransohoff, R. M., Perry, V. H. Microglial physiology: unique stimuli, specialized responses. Annu Rev Immunol. 27, 119-145 (2009).
- Aguzzi, A., et al. Microglia: scapegoat, saboteur, or something else. Science. 339 (6116), 156-161 (2013).
- Tremblay, M. E., et al. The role of microglia in the healthy brain. J Neurosci. 31 (45), 16064-16069 (2011).
- Hanisch, U. K., Kettenmann, H. Microglia: active sensor and versatile effector cells in the normal and pathologic brain. Nat. Neurosci. 10 (11), 1387-1394 (2007).
- Sierra, A., et al. Janus-faced microglia: beneficial and detrimental consequences of microglial phagocytosis. Front Cell Neurosci. 7, (2013).
- Dheen, S. T., et al. Microglial activation and its implications in the brain diseases. Curr Med Chem. 14 (11), 1189-1197 (2007).
- Schafer, D. P., et al. Microglia sculpt postnatal neural circuits in an activity and complement-dependent manner. Neuron. 74 (4), 691-705 (2012).
- Katz, L., Shatz, C. Synaptic activity and the constuction of cortical circuits. Science. 274 (5290), 1133-1138 (1996).
- Sanes, J. R., Lichtman, J. W. Development of the vertebrate neuromuscular junction. Annu Rev Neurosci. 22, 389-442 (1999).
- Hua, J. Y., Smith, S. J. Neural activity and the dynamics of central nervous system development. Nat Neurosci. 7 (4), 327-332 (2004).
- Holtmaat, A., Svoboda, K. Experience-dependent structural synaptic plasticity in the mammalian brain. Nat Rev Neurosci. 10 (9), 647-658 (2009).
- Butz, M., et al. Activity-dependent structural plasticity. Brain Res Rev. 60 (2), 287-305 (2009).
- Bruel-Jungerman, E., et al. Brain plasticity mechanisms and memory: a party of four. Neuroscientist. 13 (5), 492-505 (2007).
- Schafer, D. P., Stevens, B. Synapse elimination during development and disease: immune molecules take centre stage. Biochem Soc Trans. 38 (2), 476-481 (2010).
- Alexander, A., et al. The complement system: an unexpected role in synaptic pruning during development and disease. Annu Rev Neurosci. 35, 369-389 (2012).
- Brown, A., Weaver, L. C. The dark side of neuroplasticity. Exp Neurol. 235 (1), 133-141 (2012).
- Navarro, X. Chapter 27: Neural plasticity after nerve injury and regeneration. Int Rev Neurobiol. 87, 483-505 (2009).
- Tan, A. M., Waxman, S. G. Spinal cord injury, dendritic spine remodeling, and spinal memory mechanisms. Exp Neurol. 235 (1), 142-151 (2012).
- Wolpaw, J. R., Tennissen, A. M. Activity-dependent spinal cord plasticity in health and disease. Annu Rev Neurosci. 24, 807-843 (2001).
- Schafer, D. P., et al. The "quad-partite" synapse: Microglia-synapse interactions in the developing and mature CNS. Glia. 61 (1), 24-36 (2013).
- Mukhopadhyay, S., et al. Manganese-induced trafficking and turnover of the cis-Golgi glycoprotein GPP130. Mol Biol Cell. 21 (7), 1282-1292 (2010).
- Jung, S., et al. Analysis of fractalkine receptor CX(3)CR1 function by targeted deletion and green fluorescent protein reporter gene insertion. Mol Cell Biol. 20, 4106-4114 (2000).
- Knobloch, M., Mansuy, I. M. Dendritic spine loss and synaptic alterations in Alzheimer’s disease. Mol Neurobiol. 37 (1), 73-82 (2008).
- Masliah, E., et al. Synaptic remodeling during aging and in Alzheimer’s disease. J Alzheimers Dis. 9 (3 Suppl), 91-99 (2006).
- Yoshiyama, Y., et al. Synapse loss and microglial activation precede tangles in a P301S tauopathy mouse model. Neuron. 53 (3), 337-351 (1016).
- Milnerwood, A. J., Raymond, L. A. Early synaptic pathophysiology in neurodegeneration: insights from Huntington’s disease. Trends Neurosci. 33 (11), 513-523 (2010).
- Noda, M., Suzumura, A. Sweepers in the CNS: Microglial Migration and Phagocytosis in the Alzheimer Disease Pathogenesis. Int J Alzheimers Dis. , (2012).
- Rotshenker, S. Microglia and macrophage activation and the regulation of complement-receptor-3 (CR3/MAC-1)-mediated myelin phagocytosis in injury and disease. J Mol Neurosci. 21 (1), 65-72 (2003).
- Smith, M. E. Phagocytosis of myelin in demyelinative disease: a review. Neurochem Res. 24 (2), 261-268 (1999).
