Here a novel region of interest analysis protocol based on sorting best-fit ellipses assigned to regions of positive signal within two-dimensional time lapse image sequences is demonstrated. This algorithm may enable investigators to comprehensively analyze physiological Ca2+ signals with minimal user input and bias.
Intracellular Ca2+ signals are commonly studied with fluorescent Ca2+ indicator dyes and microscopy techniques. However, quantitative analysis of Ca2+ imaging data is time consuming and subject to bias. Automated signal analysis algorithms based on region of interest (ROI) detection have been implemented for one-dimensional line scan measurements, but there is no current algorithm which integrates optimized identification and analysis of ROIs in two-dimensional image sequences. Here an algorithm for rapid acquisition and analysis of ROIs in image sequences is described. It utilizes ellipses fit to noise filtered signals in order to determine optimal ROI placement, and computes Ca2+ signal parameters of amplitude, duration and spatial spread. This algorithm was implemented as a freely available plugin for ImageJ (NIH) software. Together with analysis scripts written for the open source statistical processing software R, this approach provides a high-capacity pipeline for performing quick statistical analysis of experimental output. The authors suggest that use of this analysis protocol will lead to a more complete and unbiased characterization of physiologic Ca2+ signaling.
Ca2+ is a ubiquitous second messenger signaling molecule and cytosolic Ca2+ levels are highly regulated. Intracellular Ca2+ signals are complex and include isolated transients, oscillations, and propagating waves1-4. Spatial and temporal control of Ca2+ is thought to underlie physiological signal specificity, and therefore the analysis of Ca2+ signal patterns is of considerable interest to investigators in multiple fields5.
Ca2+ indicator dyes such as Fluo-4 and Fura-2 are commonly employed to measure intracellular Ca2+ signals with fluorescence microscopy5-12. Typically, temporal Ca2+ signals are evaluated as time-dependent changes in mean fluorescence within a user-defined area, or region of interest (ROI)5,6,13-16. Currently, manual ROI analysis is both time consuming and labor intensive because it requires users to identify many ROIs and perform repetitive computations17-19. These techniques may also be subject to considerable user error, including introduction of artificial signal modes and exclusion of low amplitude or diffuse signals18,20.
Automated ROI detection algorithms have previously been implemented using a variety of statistical approaches to determine optimal ROI placement, but they have generally been limited to analysis of line scan or pseudo-line scan images, which restricts analysis to a single spatial dimension in time17,19-22. Additionally, many existing algorithms are not adequate to encompass the diversity of Ca2+ release events which range from periodic, localized transients to propagating waves23,24. Comprehensive evaluation of physiological Ca2+ signals is often further complicated by the presence of significant image artifact that confounds signal to noise discrimination in many experimental systems.
Previously, an automated ROI detection algorithm solution to Ca2+ signal transient detection, implemented as a plugin for NIH ImageJ software (National Institutes of Health, Bethesda, MD), was developed and validated25,26. This algorithm, called LC_Pro, was designed to identify and analyze ROIs encompassing Ca2+ signal transients in two-dimensional time lapse image sequences. Here a practical experimental protocol and representative demonstration of an application of the algorithm in porcine coronary artery endothelium is provided, with additional postprocessing using the open source statistical processing software R to generate usable graphical output.
1. Vessel Dissection and Imaging
2. Automated Analysis
3. Graphical Output
A custom algorithm, LC_Pro, was developed and implemented in order to perform automated analysis of Ca2+ dynamics on confocal image sequences. As depicted in Figure 1, the algorithm utilizes sequential processing modules that A) detect and track sites of dynamic Ca2+ change above statistical (p < 0.01) noise, B) define regions of interest (ROI) automatically at active site centers, and C) calculate average fluorescence intensities at ROIs to determine specific event parameters. A graphical overview of the algorithm is shown using computer generated Gaussian pulses of known intensity and location (Figure 2). Signal pulses (Figures 2A and B) were converted to binary using the z-score for a standard normal distribution,and best-fit ellipses were assigned to pixel loci above signal threshold (Figure 2C). An ellipse sorting algorithm was used to determine optimal ROI placement (Figure 2D). ROI mean intensity versus time was then measured and signal parameters of amplitude, duration and spatial spread were computed (Figure 2E). This analysis approach was applied to assess cellular Ca2+ dynamics in intact vascular endothelium. Specifically, confocal imaging was performed in opened swine coronary arteries as described in Figure 3, and the algorithm was employed offline to quantify distinct Ca2+ parameters. For these experiments, continuous recordings were made before and after addition of the endothelial stimulus, substance P (SP; 100 pM), and LC_Pro analysis was subsequently performed. For scaling signal within each ROI, baselines were derived as linear regressions of ROI intensity over the experimental time course (Figure 4). Mean signal intensity values were computed for each ROI (Figure 4A), and values above the mean were truncated to the mean and a linear regression was performed to approximate signal baseline (Figure 4B). Finally, raw intensity values were divided by the value of the regression line to convert values to fold change over baseline (Figure 4C). Figure 5 shows a representative experiment, including images of Ca2+ dependent fluorescence in the endothelium (Figure 5A), accumulate binary masks of total Ca2+ signal detected within the sampled field (Figure 5B), and recordings of average fluorescence at each ROI (Figure 5C) before and after SP treatment. Subsequent parameter analysis was performed using R software. Resulting histograms show the amplifying effect of SP on event amplitude, duration, and spatial spread (Figure 6).
Figure 1. Signal flow charts of algorithm processes (this figure was obtained with permission from Francis et al.)24. The algorithm was organized into three sections: Image processing, event processing, and region of interest (ROI) processing. Image sequences are input into the flow chain, and event statistics are generated as final output. The image processing (A) subroutine of the algorithm converts the input image sequence into a list of best-fit ellipses by thresholding, using the z-score for a standard normal distribution and ImageJ particle analysis. Event processing (B) is a sorting subroutine used to determine optimum ROI position by organizing ellipse locations into event “sites” by time. After mean intensity measurements are taken at each ROI, statistical parameters for each event and site are calculated by the ROI processing subroutine (C) to generate the final output. BKGD, background; AVG, average. Please click here to view a larger version of this figure.
Figure 2. Demonstration of automated ROI acquisition and signal detection using a computer-generated Gaussian pulse (this figure was adapted with permission from Francis et al.)24. A single computer-generated signal pulse (A) was embedded in random background noise. The gray scale image sequence was filtered to remove static background pixel values (B) and converted to binary using threshold pixel intensity values of P < 0.05 calculated by the standard score (C). ImageJ particle analysis algorithms were then applied to the image sequence to assign best-fit ellipses to pixel loci within each frame. A novel algorithm was used to group ellipses into discrete temporal “events” and determine the optimal position for each ROI based on the mean ellipse center (D). An ROI of user defined radius is then placed at each position (dotted circle). Mean intensity values within an ROI are calculated for each frame and scaled using a linear baseline approximation. Peak amplitude is identified as local maxima above P < 0.05 as defined by the standard score for a corresponding ROI tracing (E). Please click here to view a larger version of this figure.
Figure 3. Porcine coronary artery dissection protocol. Approximately 0.5 mm diameter x 8 mm length branches of the left anterior descending coronary artery (1st image, dotted circle) were dissected from the surrounding myocardium. Vessel segments were trimmed of surrounding adventitial tissue and cut lengthwise with small scissors (2nd image). Next, the opened vessels were pinned flat to a PDMS block using fine tungsten wires (3rd image). Mounted vessel segments were loaded with Fluo-4 Ca2+ indicator dye, washed, and then placed in a coverglass-bottomed imaging chamber. Images were collected at 20X magnification (488 ex., 510 em.) at 8.0 frames per sec using an inverted confocal microscope. Please click here to view a larger version of this figure.
Figure 4. ROI mean intensity baseline approximation. Following mean intensity versus time measurements (solid lines) for each ROI, the raw intensity values are scaled to F/F0 using the following baseline approximation method. The mean signal intensity (dashed line) during the control period is computed from user defined control and treatment interval values (A). The time-dependent signal intensity curve is then truncated above the mean control intensity to the mean control intensity to filter activity from baseline approximation, and a linear regression is performed on the resultant curve (dotted lines) (B). Finally, the raw intensity values are scaled to the computed linear baseline (C). Please click here to view a larger version of this figure.
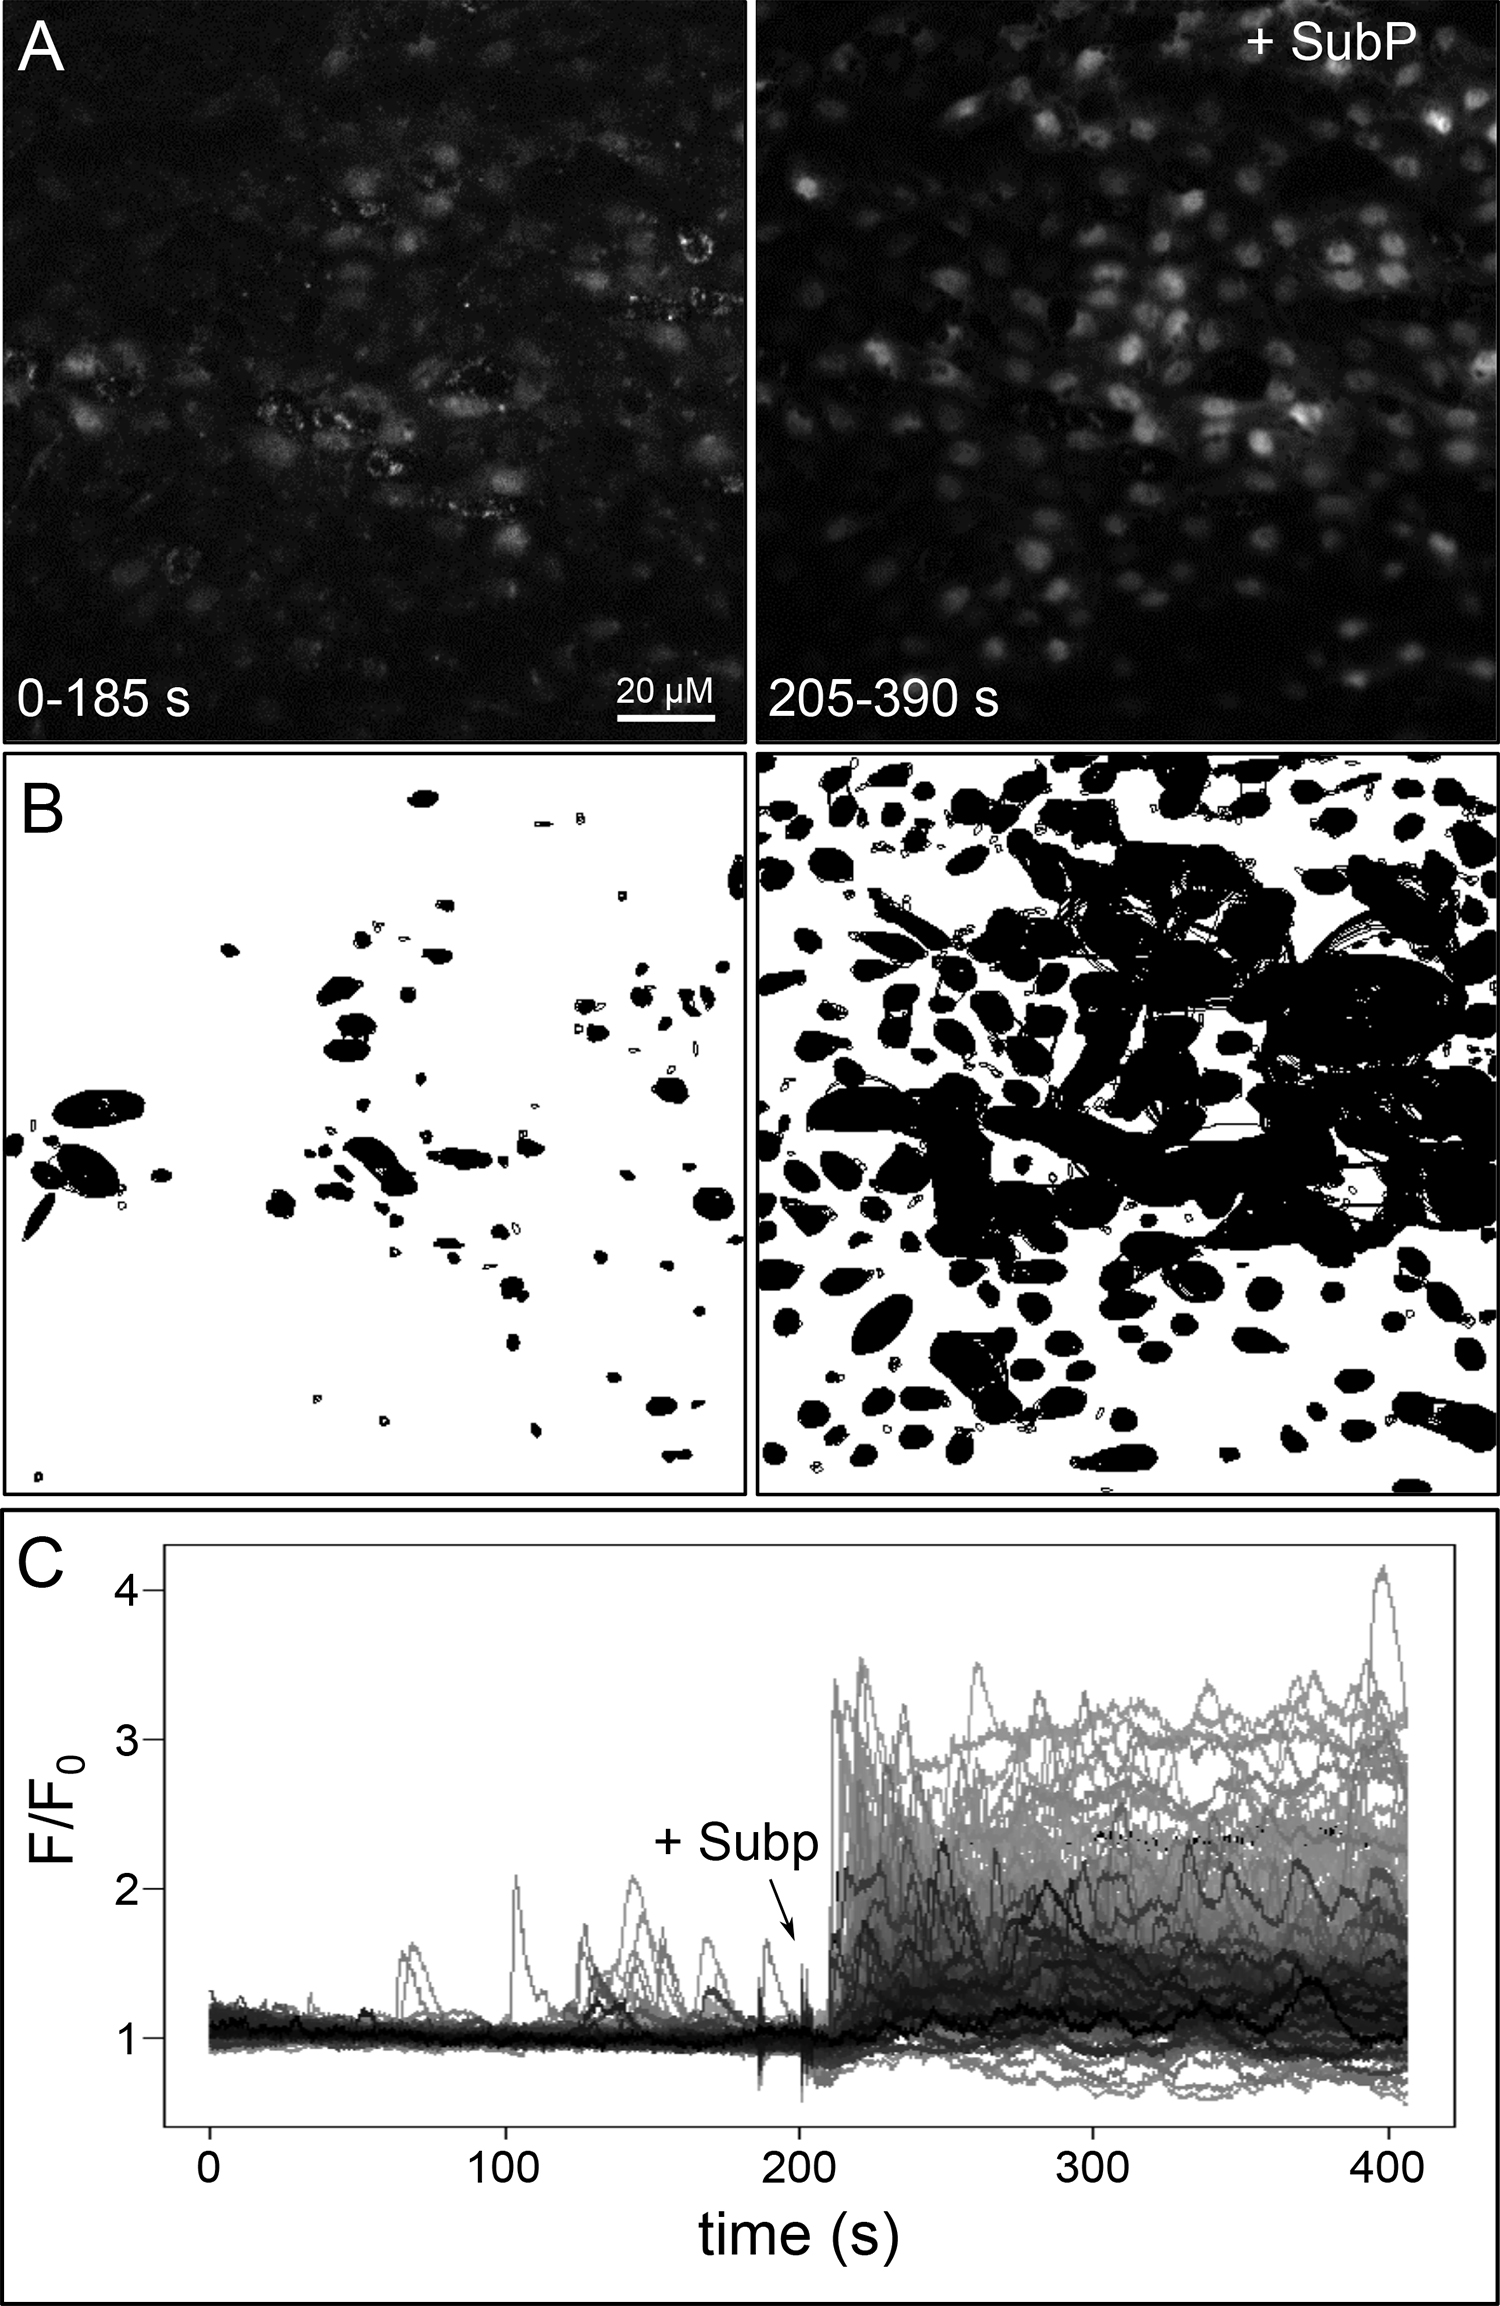
Figure 5. Representative results from LC_Pro analysis of basal and stimulated Ca2+ dynamics. Time lapse images of an input image sequence of a basal sampling interval (A, left panel) followed by a Substance P-stimulated sampling interval (A, right panel) are shown in grayscale. Time lapse image sequences of best fit ellipses for basal and stimulated intervals (B) were rendered by LC_pro. Finally, time-dependent scaled intensity curves from each automatically positioned region of interest (ROI) are shown (C).
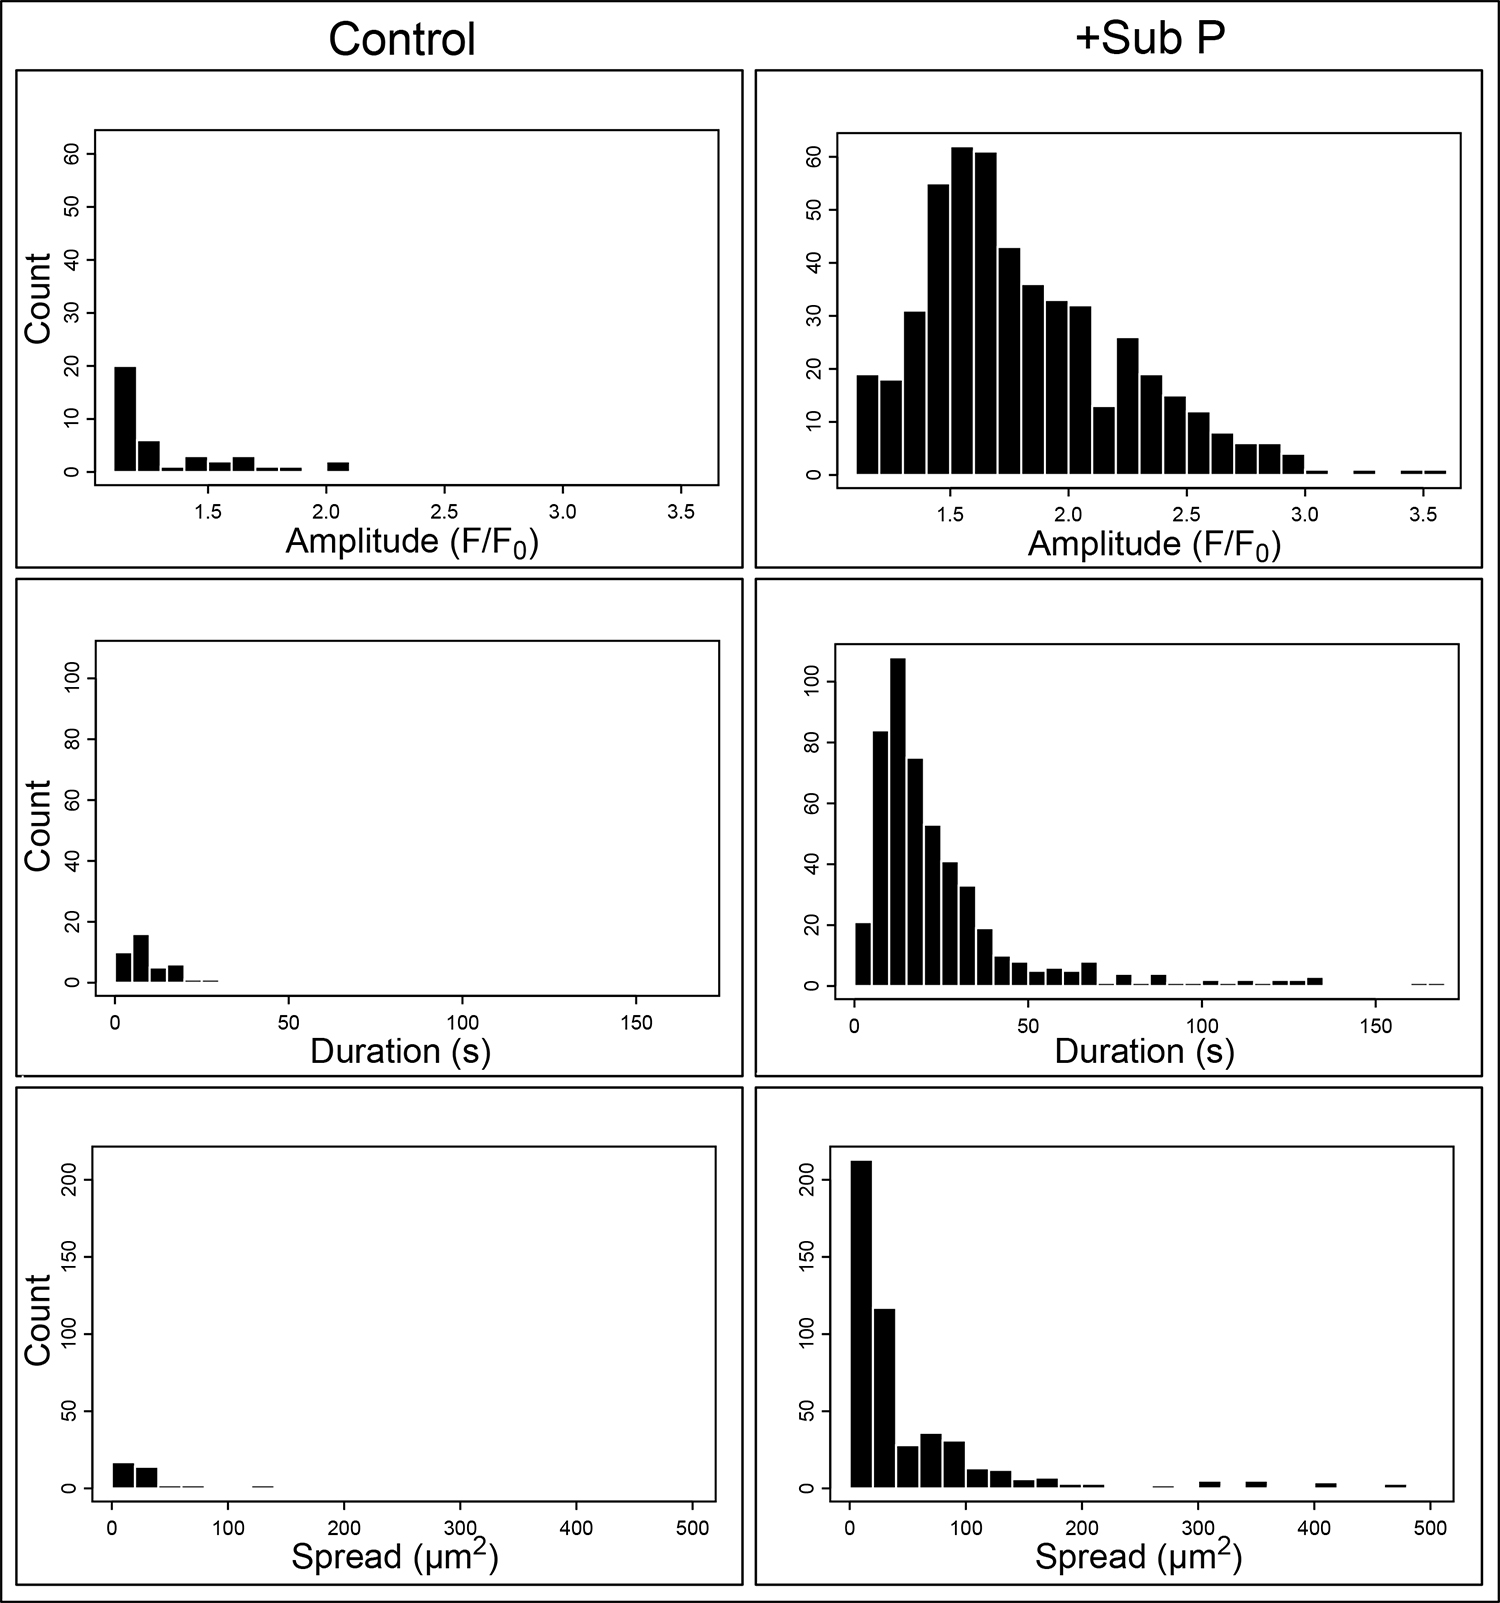
Figure 6. Histograms of parameter distributions from a representative experiment (Figure 4). Histograms from parameters of peak amplitude (F/F0), duration at ½ max (sec), and maximum spatial spread (μm2) for both control (left column) and Substance P-stimulated (right column) events from a representative experiment were rendered using R to graphically process the output from LC_pro. Notably, Substance P stimulation expanded the number of events, and caused a significant right shift in the median amplitude and duration by Mann-Whitney U test (p < 0.01).
Decoding complex Ca2+ signals at the cellular and multicellular level will require rigorous experimental and analytical approaches. Here, an approach is described in which time resolved confocal image sequences of Ca2+ dependent fluorescence are subjected to an automated analysis that identifies and quantifies statistically relevant Ca2+ signals within intact cellular fields In the specific case presented, an artery segment was isolated from pig heart, pinned opened to expose the endothelium, loaded with the Ca2+ indicator Fluo-4 AM, subjected to confocal imaging, and evaluated with the custom algorithm LC_Pro. This algorithm is designed to 1) detect and track sites of dynamic Ca2+ change above statistical (p < 0.01) noise, 2) define regions of interest (ROI) automatically at active site centers, and 3) analyze average fluorescence intensities at ROIs to determine specific event parameters. The approach overcomes major limitations of biological signaling research by reducing user error and bias, greatly reducing offline analysis time, and providing a complete index of signals across a field to discern representative profiles or patterns. Output from LC_Pro is further processed through R scripts, providing full parameter reports for individual experiments, including high quality graphical output.
Several steps are important for proper performance of the described technique. The tissue dissection procedure (step 1.1.1) must be performed carefully in order to avoid denudation or damage of the endothelial cell layer. Additionally, image sequences must be in the proper format (step 2.1) for the automated region of interest algorithm to work correctly. For example, if there is scale information associated with the file, regions of interest will be incorrectly placed according the pixel locations, rather than the scaled unit locations. Also, choosing a suitable region of interest diameter is critical to correctly performing automated analysis of the fluorescent activity within an image sequence. Too small a diameter value may result in redundant measurements, whereas too large a diameter will result in exclusion of subtle signals.
Potential pitfalls of this technique primarily relate to sensitivity of the automated analysis to x-y shifts in recorded image sequences and to signal saturation and/or bleaching, which may result in false positive or false negative results. Dimensional drifts or shifts may be addressed directly through use of stack registration software and accurate designation of intervals where perturbations are introduced. Gray levels and ROI diameter parameters may also be optimized for a given preparation in advance of data collection in order to standardize raw data sets.
Because it serves as a standard approach for any dynamic fluorescence signal, the analysis described here is suitable for a diverse body of applications. In the vasculature, this method is being employed to define characteristic physiological and pathophysiological signal modalities in multiple vascular beds under basal and stimulated conditions25,26. It is also being applied in the automated tracking of Ca2+ waves. Ultimately, such global automated analysis will be a crucial linchpin in deciphering spatially and temporally complex bio-signals and in establishing new cell and multi-cell models.
The authors have nothing to disclose.
This work was supported in part by National Institutes of Health Grants HL-085887, HL-092992, S10RR027535, and MOP-93676.
dissection dish | Fisher Sci | #08-772-70 | |
polydimethylsiloxane (PDMS) | Fisher Sci | #NC9644388 | elastomer kit, must be molded into dishes |
HEPES-buffered PSS | Sigma | #H3375-250G | HEPES acid |
stereomicroscope | Nikon Inst. | #MNA42000 | |
forceps | Fine Science Tools | #11223-20 | |
spring scissors | Fine Science Tools | 15003-08 | |
tungsten wire | Scientific Inst Svcs | #406 | |
Fluo-4 AM | Life Tech. | #F-14201 | |
pluronic F-127 | Life Tech. | #P3000MP | |
metal pins | Fine Science Tools | #26002-10 | |
cover-glass bottom chamber | Custom designed | ||
spinning disc confocal microscope | Perkin Elmer | RS-3 | |
imageJ software | download at: http://rsbweb.nih.gov/ij/download.html | ||
LC_Pro plugin for imageJ | download at: http://rsbweb.nih.gov/ij/plugins/lc-pro/index.html | ||
R software | download at: http://www.r-project.org/ | ||
R traceplot script | download at: https://docs.google.com/file/d/0B-PSp1D9e2fjV3NIcGppUzkxdEk/edit?usp=sharing |