The protocol described details an experimental procedure to quantify Red Blood Cell (RBC) aggregates under a controlled and constant shear rate, based on image processing techniques. The goal of this protocol is to relate RBC aggregate sizes to the corresponding shear rate in a controlled microfluidic environment.
Blood, as a non-Newtonian biofluid, represents the focus of numerous studies in the hemorheology field. Blood constituents include red blood cells, white blood cells and platelets that are suspended in blood plasma. Due to the abundance of the RBCs (40% to 45% of the blood volume), their behavior dictates the rheological behavior of blood especially in the microcirculation. At very low shear rates, RBCs are seen to assemble and form entities called aggregates, which causes the non-Newtonian behavior of blood. It is important to understand the conditions of the aggregates formation to comprehend the blood rheology in microcirculation. The protocol described here details the experimental procedure to determine quantitatively the RBC aggregates in microcirculation under constant shear rate, based on image processing. For this purpose, RBC-suspensions are tested and analyzed in 120 x 60 µm poly-dimethyl-siloxane (PDMS) microchannels. The RBC-suspensions are entrained using a second fluid in order to obtain a linear velocity profile within the blood layer and thus achieve a wide range of constant shear rates. The shear rate is determined using a micro Particle Image Velocimetry (µPIV) system, while RBC aggregates are visualized using a high speed camera. The videos captured of the RBC aggregates are analyzed using image processing techniques in order to determine the aggregate sizes based on the images intensities.
Red Blood Cells (RBCs) play a crucial role in determining the rheological behavior of blood. They are almost singularly responsible for the particular properties of blood in vitro and in vivo. Under physiological conditions, RBCs occupy 40% to 45% of the blood volume. In microcirculation, RBCs only occupy up to 20% of the blood volume due to smaller vessel diameters and the plasma skimming effect1. This phenomenon of plasma reduction in microcirculation is known as the Fåhræus effect. At low shear rates, RBCs are able to bridge together and form one dimensional or three dimensional structures called “rouleaux” or aggregates, hence contributing to the non-Newtonian behavior of blood. However, the mechanism of RBC aggregation is not completely understood. Two theories exist to model the aggregation of RBCs: the bridging of cells theory due to the cross-linking of the macromolecules2 and the force attraction theory caused by depletion of the molecules due to the osmotic gradient3.
Typically, for human blood, aggregates form at very low shear rates4 ranging from 1 to 10 sec-1. Above this range, RBCs tend to disaggregate and flow separately within the vessel.
Understanding the conditions of the aggregates formation is of a great importance to the hemorheology field in terms of defining blood’s rheological behavior. These aggregates are often seen at the macrocirculation level (>300 µm diameter)5. At this scale, blood is considered as a Newtonian fluid and a homogenous mixture. However, these aggregates are rarely seen in the capillary level (4-10 µm in diameter) and are usually an indication of pathological conditions such as diabetes6 and obesity. Other pathological conditions that could change RBC aggregation include inflammatory or infectious conditions, cardiovascular diseases such as hypertension or atherosclerosis, genetic disorders and chronic diseases7. Therefore, understanding the RBC aggregation mechanism and analyzing these entities (by defining a relationship between the size of these aggregates and the flow conditions) could lead to the understanding of the microrheological behavior of blood and hence relate it to clinical applications.
RBC aggregates can be altered by several factors such as the hematocrit (volume of RBCs in blood), the shear rate, the vessel diameter, the RBC membrane stiffness and the suspending medium composition8-10. Therefore, controlled conditions are required in order to effectively analyze the RBC aggregates. Several methods are able to analyze aggregate formation by providing static aggregation measurements (aggregation index) that offers relevant information about blood behavior. These methods include, inter alia, the erythrocyte sedimentation rate method11, the light transmission method12, the light reflection method13 and the low shear viscosity method14.
Few studies have attempted to study RBC aggregation and determine the degree of aggregation in controlled flow conditions15-17. However, these studies indirectly investigate RBC aggregate sizes by determining the ratio of the occupied space in a shearing system measured based on microscopic blood images providing information on the degree of aggregation as well as the local viscosity. Chen et al.18 presented a direct measurement technique for RBC aggregate sizes and provided RBC aggregate size distribution for different shear stresses by varying the flowrate of the suspensions while monitoring the pressure drop across a flow chamber. The shear stresses are calculated based on the monitored pressure using Stokes equation18.
We therefore present a new procedure to directly quantify RBC aggregates in a controlled microfluidic environment, dynamically, under specific, constant and measurable shear rates. The blood flow in the shear system is directly observed (perpendicularly to the flow direction), providing a different angle on flow investigation compared to previous studies15,18 and a visualization of the full domain of interest. RBC-suspensions are entrained, in a double Y-microchannel (as illustrated in Figure 1), with a Phosphate Buffered Saline (PBS) solution hence creating a shear flow in the blood layer. Within this blood layer a constant shear rate can be obtained. The RBC-suspensions are tested at different hematocrit (H) levels (5%, 10% and 15%) and under different shear rates (2-11 sec-1). The blood velocity and shear rate are determined using a micro Particle Image Velocimetry (µPIV) system while the flow is visualized using a high speed camera. The results obtained are then processed with a MATLAB code based on the image intensities in order to detect the RBCs and determine aggregate sizes.
Blood is collected from healthy individuals with the approval of the ethics committee of the University of Ottawa (H11-13-06).
1. Microchannel Fabrication
The microchannels are fabricated based on the standard photolithography methods19.
2. Blood Preparation
3. Fluids Preparation
Introduce two fluids in the double Y-microchannel: RBC-suspensions and PBS.
4. Aggregates Size Measurements
5. Fluid Velocity and Shear Rate Measurements
Determine the fluid velocity and hence the shear rate using a µPIV system.
An example of the two-fluid flow in the double Y-microchannel is shown in Figure 2 for human RBCs suspended at 5%, 10% and 15% hematocrit and flowing at 10 µl/hr. Figure 3 shows the difference in aggregate sizes when the flow in the channel is reduced from 10 µl/hr to 5 µl/hr for a hematocrit of 10%. This gives a qualitative notion of the sizes of the aggregates when varying the hematocrit and shear rate. Figure 5 follows the displacement of four human RBC aggregates, for three consecutive frames, providing a qualitative measure of the camera frame rate required and qualitative notion of the aggregates distribution within each frame. In Figure 5, the small aggregates (with 8 or less estimated RBCs) are shown in blue, while medium aggregates (ranging from 9 to 30 estimated RBCs) and large aggregates (greater than 30 estimated RBCs) are shown in green and red respectively.
The velocity profiles of the different RBC-suspensions in the channel are displayed in Figure 7, where the red, blue and green curves represent the velocity profiles of the RBCs suspended at 5%, 10% and 15% hematocrit respectively. The RMS errors of the velocity, also displayed in Figure 7 for each RBC-suspension, are relatively small compared to the velocity values, indicating the precision of the velocity measurements, and hence shear rates. The interface locations are denoted as ‘E’ and shown as the solid lines in the same figure.
The corresponding shear rates for the different RBC-suspensions (based on the velocity profiles and the blood layer thickness) are shown in Table 1. The average aggregate sizes determined for each of the RBC-suspensions, based on the image processing method to detect the area of the RBC aggregates, are shown in Figure 9, as a function of the corresponding shear rate. An example of the distribution of the percentage of RBCs within each aggregate is shown in Figure 6. The aggregate sizes are represented as an estimated number of RBC in the aggregates.
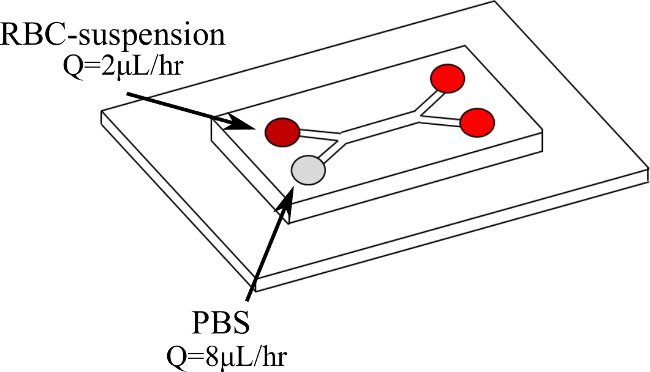
Figure 1. Double Y-microchannel configuration and entry fluids. Blood enters the first branch at Q = 2 µl/hr while PBS enters the second branch at Q = 8 µl/hr. Please click here to view a larger version of this figure.
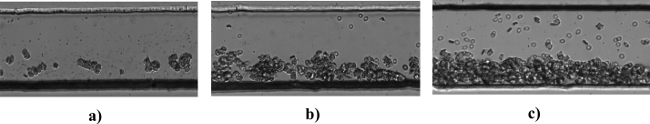
Figure 2. Human RBC-suspension at different hematocrit. The figure represents captured frames of the human RBC-suspensions flowing at Q = 10 µl/hr at (A) 5% (B) 10% and (C) 15% hematocrit. Please click here to view a larger version of this figure.
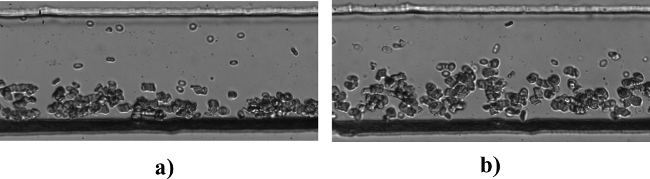
Figure 3. Human RBC-suspension at different flowrates. The figure represents captured frames of the human RBCs suspended at 10% hematocrit H flowing (A) Q = 10 µl/hr and (B) Q = 5 µl/hr. Please click here to view a larger version of this figure.
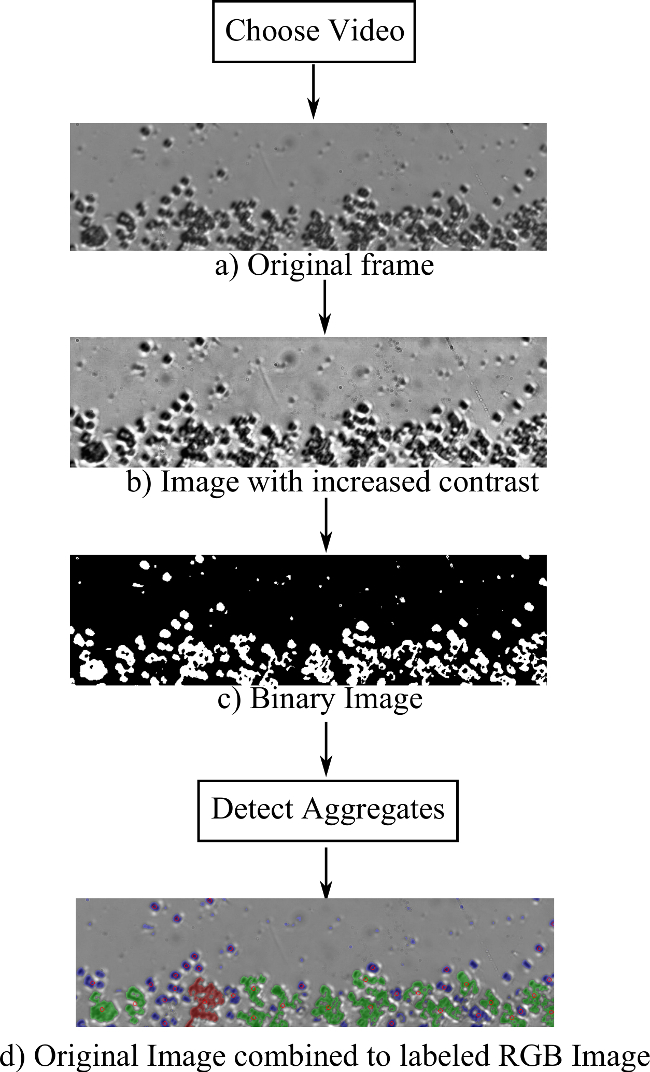
Figure 4. Flow chart of the image processing program used for aggregate detection. The steps shown describe the basic methodology used. The quality of the image is enhanced to be converted to a binary image. The aggregates are detected and labeled based on their respective sizes. Please click here to view a larger version of this figure.
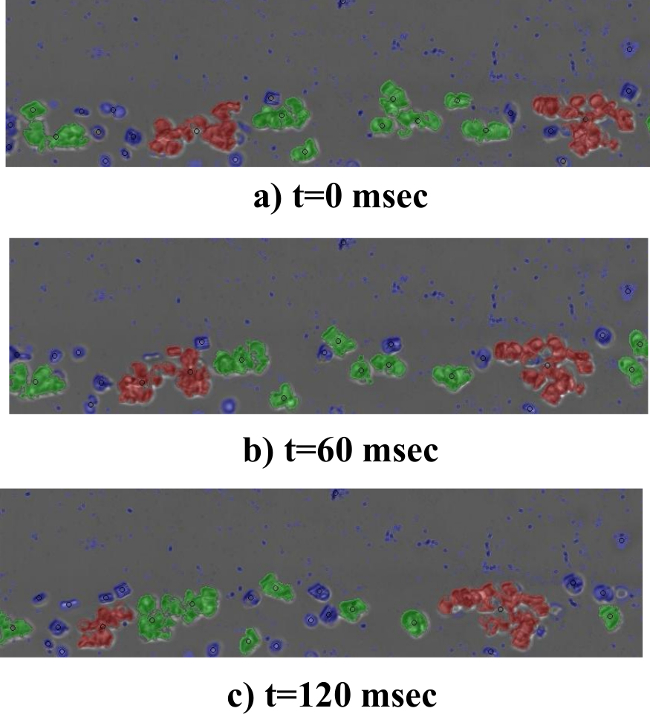
Figure 5. RGB coloring and net motion of the several human RBC aggregates for three consecutive frames. The figure shows the net motion of four aggregates detected in three consecutive frames at (A) t = 0 msec, (B) t = 60 msec and (C) t = 120 msec. The large aggregates (> 30 estimated RBCs), medium aggregates (9-30 estimated RBCs) and small aggregates (<8 estimated RBCs) are shown in red, green and blue respectively. Each of the aggregates detected are marked with a black circle. Please click here to view a larger version of this figure.
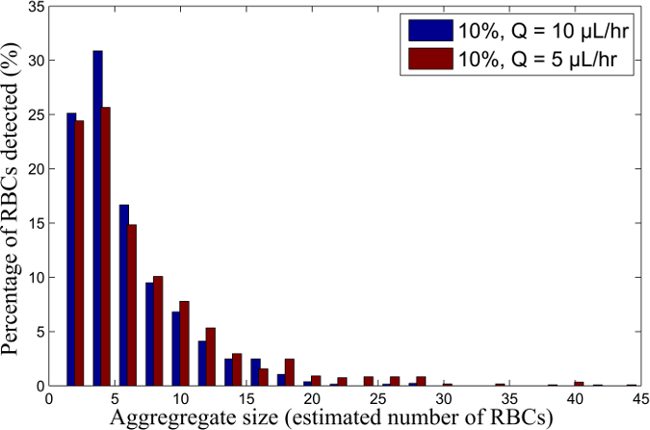
Figure 6. RBC aggregate size distribution for 10%H RBC-suspension for different flow rates. Aggregate size distribution for blood samples suspended at 10% H, flowing at Q = 10 and 5 µl/hr. Please click here to view a larger version of this figure.
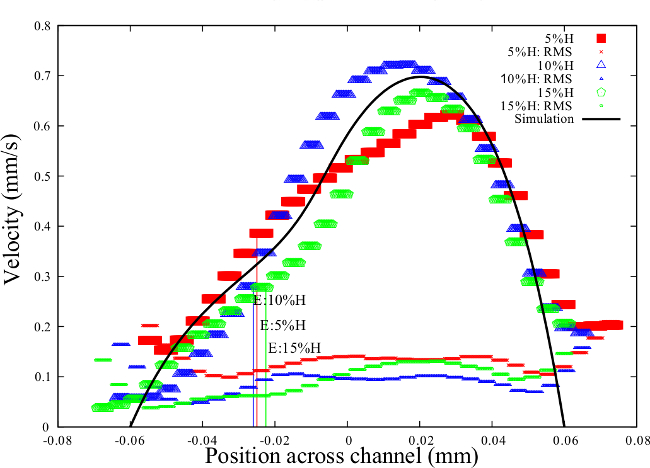
Figure 7. Velocity profile comparison for different hematocrit. The velocity profiles are shown for RBCs in plasma suspended at 5% H (Red), 10% H (blue), 15%H (green) and simulation20 (solid line) for the 120 x 60 µm double Y-microchannel with a Q = 10 µl/hr. The interface location is denoted by E for the experiments. The corresponding RMS errors of the different velocity profiles are displayed. Please click here to view a larger version of this figure.
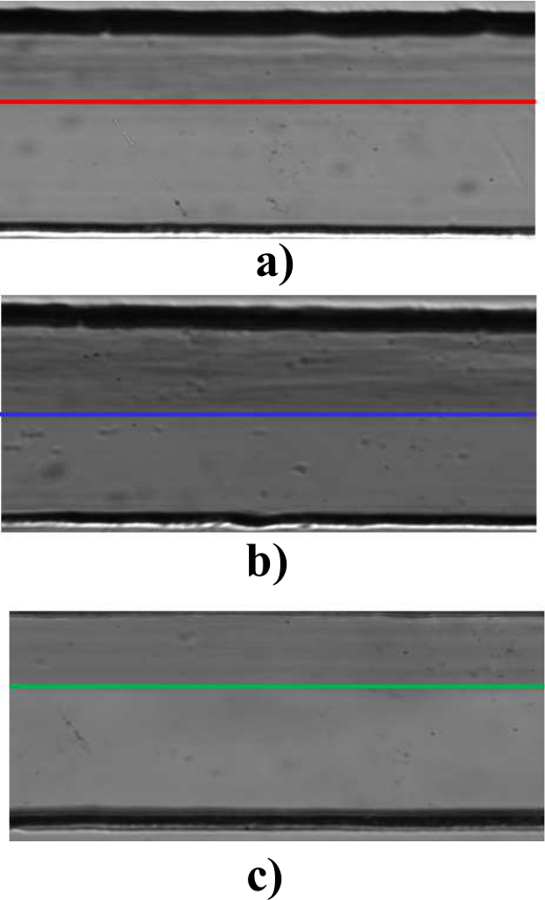
Figure 8. Image background for the different RBC-suspensions and delimitation of the blood layer thickness. The figure shows the delimitation of the blood layer thickness of the RBC-suspensions flowing at 10 µl/hr suspended at (A) 5%, (B) 10% and (C) 15% H. Please click here to view a larger version of this figure.
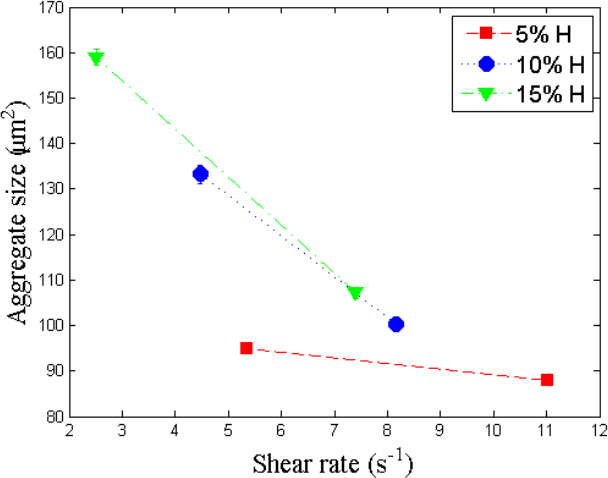
Figure 9. Average aggregate sizes as a function of the corresponding shear rates. The results are obtained for the different RBC-suspensions flowing at Q = 10 µl/hr at 5% (A), 10% (B) and 15% H (C). Please click here to view a larger version of this figure.
Hematocrit | Flow rate (µl/hr) | Shear rate (sec-1) |
5% | 10 | 11.02 |
5% | 5 | 5.36 |
10% | 10 | 8.17 |
10% | 5 | 4.47 |
15% | 10 | 7.41 |
15% | 5 | 2.51 |
Table 1. Shear rate values for different blood flow cases. The shear rate values are obtained using the µPIV data and image processing results for different RBC-suspensions with 5%, 10% and 15% H, flowing at Q = 10 µl/hr and Q = 5 µl/hr.
Using the present methodology, it is possible to analyze qualitatively and quantitatively the RBC aggregates under different flow conditions and hematocrits. For successful testing and aggregate detection, it is crucial to determine the appropriate velocity ratio between the two fluids at the microchannel entry. This ratio is very important to obtain an optimal blood layer thickness where the velocity profile is quasi-linear20.
Another key factor for successful testing is a good image quality. In fact, since the method is based on image processing, it is very important to have a contrast between the image background (the fluid inside the channel) and the particles to be detected. Here, as shown in Figures 2 and 3, the particles appear to be darker than the background, which helps in the aggregate detection. The most important parameter to consider for the image processing technique is the threshold value. Therefore, based on the contrast obtained it is crucial to choose the optimal threshold value where all the aggregates will be taken into consideration, as shown in Figure 5. The present image segmentation, used for this study, is widely used for cell detection and counting26- 28. If the quality of the image is not as desired and a global threshold value is not appropriate, one can use a different algorithm to determine the optimal threshold value such as Otsu’s method29 or an adaptive thresholding method (discretizing the image and obtaining a local threshold for each discretized window).
Another factor to take into account is the scale factor for a proper conversion from pixels to µm.
Using the proper conversion factor, one can determine the diameter and thickness of one RBC that will serve to determine the aggregate size distribution (based on the estimated number of RBCs in each aggregate). Depending on the orientation of the aggregates, properly calculate the area on one RBC (frontal or side view). As mentioned in section 4 (step 4.4.1), it is important to determine the proper camera exposure time and the frame rate to ensure that the dynamic properties of the aggregates are captured between each consecutive frame. This value is based on the flow rate used when acquiring the measurements. Several other factors need to be taken into consideration when acquiring results using the µPIV system and are discussed clearly in the study of Pitts and Fenech21.
The methodology was tested successfully on several RBC-suspensions flowing at different hematocrit. However, due to the limitation of the image processing technique and the lack of contrast between the image background and the aggregates, it is difficult to detect the RBC aggregates for higher hematocrits (from 20% to 45%). Indeed as mentioned previously, the image quality is crucial for this methodology.
Using this protocol, the RBC aggregate sizes can be measured in a controlled microfluidic device and hence it is possible to obtain information on RBC aggregation dynamically in microcirculation and obtain the RBC aggregate sizes for a range of physiological shear rates. It is also possible to complement numerical and experimental studies of blood rheology and relate the aggregate sizes and behavior to clinical and pathological studies.
The authors have nothing to disclose.
This work was supported by the Natural Sciences and Engineering Research Council of Canada. Microfabrication was performed with the support of the McGill Nanotools Microfab facility at McGill University and the Department of Electronics at Carleton University.
SU8-50 epoxy based negative Photo-resist | MicroChem Corp. | ||
SU8-50 developer | MicroChem Corp. | ||
Poly(dimethylsiloxane) (PDMS) Sylgard-184 | Dow-Corning | 3097358-1004 | |
PE-50 series Plasma system | Plasma Etch | PE-50 series | |
Blood collection tubes with K2 EDTA (ethylenediaminetetraacetic acid) | FisherSci | B367861 | |
Centrifuge, i.e. Thermo Scientific CL2 | Thermo Scientific | 004260F | |
Poshpate buffered saline (PBS) | Sigma Aldrich | P5368-10PAK | |
Tracer fluorescent particles solution (15 mL) | FisherSci | R800 | |
Aggregometer | RheoMeditech | Rheo Scan AnD300 | |
Glass syringes (50 µL) | Hamilton | 80965 | |
Tubing (Tygon) | FisherSci | AAA00001 | |
High speed camera (Basler) | Graftek Imaging Inc. | basler acA2000-340km | A camera capable of recording 18 frames per seconds could be used. |
Double pulsed camera | LaVision | Imager Intense | |
Microscope MITAS | LaVision | MITAS | |
Nd:YAG laser | New Wave Research | Solo-II | |
Syringe pump (Nexus3000 and PicoPlus) | Chemyx Inc. and Harvard Apparatus | Nexus3000 and PicoPlus | |
DaVis software | LaVision | Davis |