Cardiac pressure-volume loop analysis is the most comprehensive way to measure cardiac function in the intact heart. We describe a technique to perform and analyze cardiac pressure volume loops, using conductance catheters.
Cardiac pressure-volume loop analysis is the “gold-standard” in the assessment of load-dependent and load-independent measures of ventricular systolic and diastolic function. Measures of ventricular contractility and compliance are obtained through examination of cardiac response to changes in afterload and preload. These techniques were originally developed nearly three decades ago to measure cardiac function in large mammals and humans. The application of these analyses to small mammals, such as mice, has been accomplished through the optimization of microsurgical techniques and creation of conductance catheters. Conductance catheters allow for estimation of the blood pool by exploiting the relationship between electrical conductance and volume. When properly performed, these techniques allow for testing of cardiac function in genetic mutant mouse models or in drug treatment studies. The accuracy and precision of these studies are dependent on careful attention to the calibration of instruments, systematic conduct of hemodynamic measurements and data analyses. We will review the methods of conducting pressure-volume loop experiments using a conductance catheter in mice.
Cardiac pressure volume loop analysis provides detailed information of cardiac function and are the gold standard for functional assessment 1. While imaging techniques such as echocardiography or cardiac MRI provide functional measures, these measures are highly dependent on loading conditions. Load-independent measures of cardiac contractility and relaxation require dynamic measurements of the ventricular pressure and volume relation over a range of preload and afterload. This understanding of the pressure-volume relation arises from the groundbreaking work of Sagawa and colleagues 2,3. They demonstrated in ex vivo perfused canine hearts that the pressure-volume loop derived contractility measures were independent of loading conditions 4.
In vivo application of these analyses became possible with the development of conductance catheters in the 1980s. This technical advance allowed Kass and colleagues to perform pressure-volume loop analysis in humans 5,6. Miniaturization of conductance catheters and improvements in surgical techniques in the late 1990’s 7 made analysis of rodent cardiac function feasible, allowing for genetic and pharmacologic studies to be performed. This advance has since lead to the widespread use of pressure-volume loop analysis and has generated a great deal of insight into mammalian cardiac physiology.
A key concept in the use of conductance catheters and the interpretation of data obtained from it is the relationship between volume and conductance. Conductance is inversely related to voltage, which is measured using a catheter with electrodes placed proximally, usually placed below the aortic valve, and distally, at the LV apex 8. Changes in voltage or conductance are measured by changes in current flowing from proximal to distal electrode. Although the blood pool contributes significantly to conductance, the contribution of the ventricular wall, termed parallel conductance (Vp), to measured conductance must be subtracted to obtain absolute LV volume measurements.
The methods to perform this correction, called a saline calibration, are discussed in the protocol below. The mathematical relationship between conductance and volume, described by Baan and colleagues, is that volume=1/α; (ρL2)(G-Gp), where α=uniform field correction factor, ρ=blood resistivity, L=distance between the electrodes, G=conductance and Gp=non-blood conductance 9. Of note, the uniform field correction factor in mice approaches 1.0 due to small chamber volumes10. Coupled with pressure transducers, the conductance catheter provides real time simultaneous pressure and volume data.
Cardiac pressure-volume analysis presents particular advantages over other measures of cardiac function, as they allow for measurement of ventricular function independent of loading conditions and of heart rate. Specific load-independent cardiac indices of contractility include: end-systolic pressure volume relation (ESPVR), dP/dtmax–end-diastolic volume relation, maximal elastance (Emax) and preload recruitable stroke work (PRSW). A load-independent measure of diastolic function is the end-diastolic pressure volume relationship (EDPVR) 11. The following protocol describes the conduct of cardiac pressure volume loop analysis, using both a carotid and an apical approach. While the methodology to perform these studies have been described in detail previously 8,11, we will review key steps to obtain precise pressure-volume measurements, including both saline and cuvette calibration correction, and provide a visual demonstration of these procedures. Research with animals carried out for this study was handled according to approved protocols and animal welfare regulations of Duke University Medical Center’s Institutional Animal Care and Use Committee.
1. Conductance Catheter Preparations and Pressure Calibration
2. Anesthesia/Intubation
3. Placement of Conductance Catheter in LV chamber
4. Varying Afterload Using Transient Aortic Occlusion
5. Varying Preload Using Transient Inferior Vena Cava Occlusion (IVC)
6. Saline Calibration
7. Cuvette Calibration
8. Euthanasia
9. Data Analysis using Pressure Volume Loop Analysis Software
Pressure-volume loop analysis can be used to measure cardiac function in genetically modified mice 14,15 or mice undergoing drug studies16. Representative pressure volume loops are provided from previously published work 16 investigating the effect of ß-Arrestin biased AT1R ligand, TRV120023. To test whether TRV120023 affects cardiac function in vivo, pressure-volume loop analysis was performed on wild type mice receiving conventional and novel angiotensin receptor blockers. Intravenous infusion of TRV120023 increased cardiac contractility significantly (Figure 6 and Table 1, Figure modified from Kim et al. AJP 201216). Contractility measures were derived from aortic constriction.
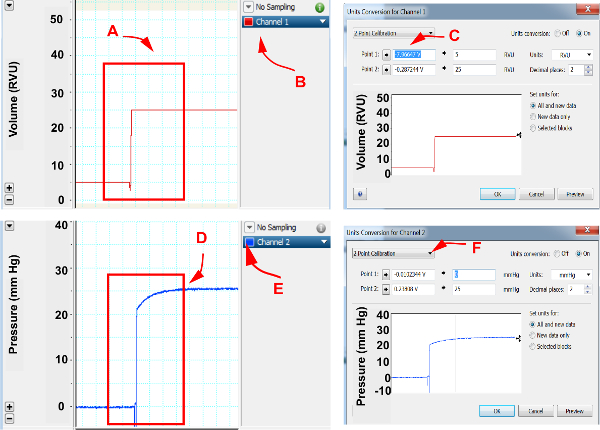
Figure 1. Cardiac pressure and volume calibration. Please click here to view a larger version of this figure.
In pressure volume loop software, assign channels for pressure and volume recordings. (A) Using hemodynamic catheter module, set volume setting to 5 RVU and 25 RVU and select both volumes, (B) Open option under the channel exhibiting volume recordings, (C) Select unit conversion and open “2 point calibration”, select “point 1” and assign as 5 RVU and select “point 2” and assign as 25 RVU , (D) Set pressure to 0 mm Hg and 25 mm Hg, (E) Open options under the channel exhibiting pressure recordings, (F) Select unit conversion and open “2 point calibration”, select “point 1” and assign as 0 mm Hg and select “point 2” and assign as 25 mm Hg. Accept assignments by selecting “OK”.
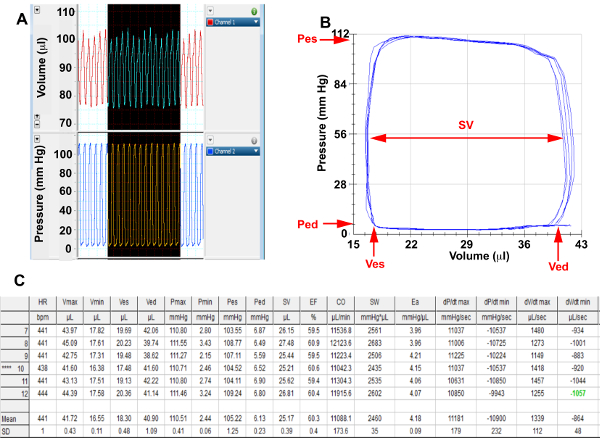
Figure 2. Baseline Hemodynamics Please click here to view a larger version of this figure.
(A) Screenshots from pressure and volume channels of representative cardiac cycles in a basal state, (B) Selected end expiratory baseline pressure-volume loops that have been corrected for parallel conductance for analysis. (C) Baseline hemodynamic summary table calculated from selected loops; Pes, End systolic pressure; Ped, End diastolic pressure; Ves, End systolic volume; Ved, End diastolic volume; SV= Stroke Volume
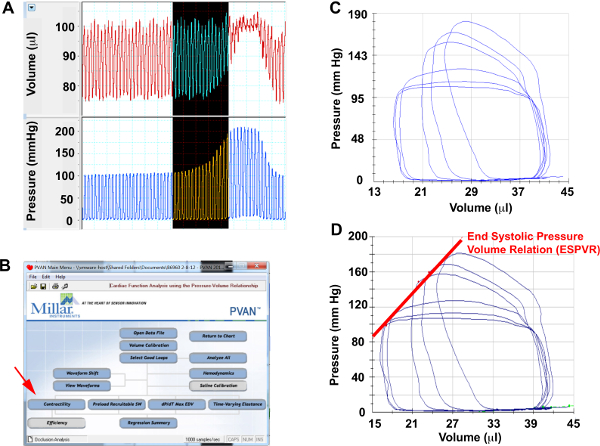
Figure 3. Aortic Constriction Hemodynamics Please click here to view a larger version of this figure.
(A) Screenshots from pressure and volume channels of representative cardiac cycles during aortic constriction, (B) Menu selection to perform contractility analysis, (C) Selected pressure-volume loops during aortic constriction for analysis. (D) ESPVR measured from aortic constriction loops.
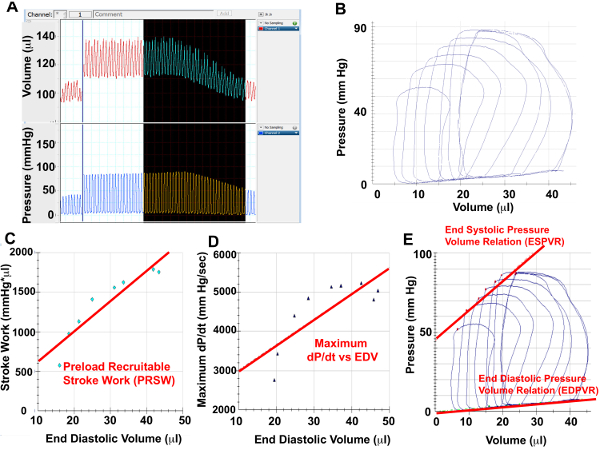
Figure 4. IVC Constriction Hemodynamics Please click here to view a larger version of this figure.
(A) Screenshots from pressure and volume channels of representative cardiac cycles during IVC constriction, (B) Selected pressure-volume loops during IVC constriction for analysis. Using the PV loops from IVC constriction, Preload Recruitable Stroke Work (C), Maximal dP/dt vs EDV (D) as well as ESPVR and EDPVR can be measured.
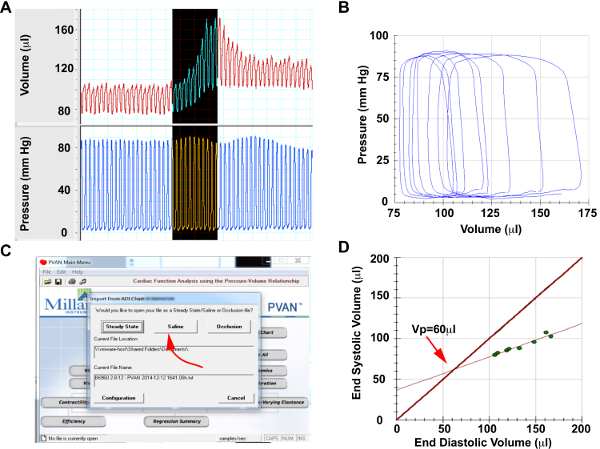
Figure 5. Saline Calibration Please click here to view a larger version of this figure.
(A) Screenshots from pressure and volume channels of representative cardiac cycles during hypertonic saline injection (B) Selected saline injection pressure-volume loops for analysis. Note that pressure will remain constant, while volume will increase significantly, (C) Menu selection to perform saline calibration, (D) Generated lines of measure end-systolic vs end-diastolic volume during saline injection and end-systolic volume=end-diastolic volume. The intersection of these lines provides the parallel conductance of Vp.
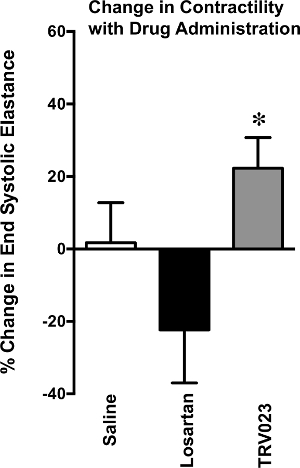
Figure 6. Change in Contractility with Drug Administration
Change in cardiac contractility, measured by end systolic elastance, assessed in wild type mice treated with saline, Losartan 5mg/kg/hr or TRV023 100μg/kg/hr for 5 min. TRV023 treated mice developed a significant increase in end systolic elastance in comparison to Losartan treated mice. *p < 0.05 vs Losartan by 1-way ANOVA.
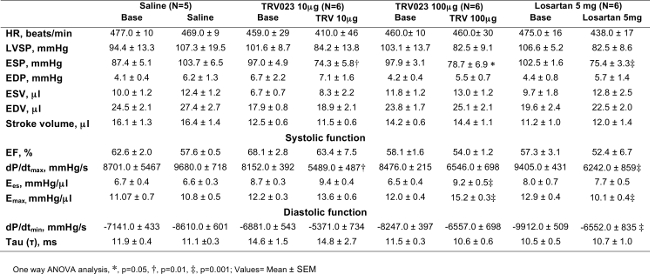
Table 1. Wild type Mice; Hemodynamic Profile in Response of β-arrestin 2 Biased AT1R Agonist
End-systolic pressure (ESP) was decreased significantly after TRV120023 (TRV) and losartan infusion. Cardiac contractility, Ees and Emax was increased significantly in TRV120023 100 μg · kg-1 · min-1 infusion group. (*p < 0.01; †p<0.05; ‡p< 0.001; n=5–6/group). p values reflect comparisons with basal condition within the same treatment group with the use of 1-way ANOVA. Cardiac contractility parameters were derived using an aortic constriction protocol. AT1R, ANG II type 1 receptor; HR, heart rate; EDP, end-diastolic pressure; ESV, end-systolic volume; EDV, end-diastolic volume; Ees, end-systolic elastance; EF, ejection fraction; Emax, maximal elastance; dP/dtmax and dP/dtmin, maximum and minimum rate of pressure change in the ventricle, respectively; τ, isovolumic relaxation constant. Please click here to view a larger version of this table.
We describe a method for perfoming pressure-volume loop analysis using a conductance catheter in mice, to derive comprehensive analyses of both cardiac contractility and relaxation. Suga, Sagawa and colleagues utilized pressure-volume loops to define measures of cardiac contractility, specifically the slope of the ESPVR, or the end-systolic elastance (Ees), and Emax. Elastance, defined by the ratio of pressure to volume (P/V), varies over the duration of systole. During each systole, the instantaneous elastance is dependent on heart rate and cardiac contractility, but is largely independent of preload or afterload 3,17. Thus, the peak elastance or Emax is used to define cardiac contractility that is mostly independent of loading conditions from individual cardiac cycles18. A closely related contractility term, Ees is defined by the slope of the ESPVR over a series of cardiac cycles in a stable condition. While Ees appears linear over a limited range of loads, Ees can be curvilinear and curvilinearity is correlated with contractile state19. An increase in Ees or Emax indicates increased contractility and a decrease denotes diminished contractility. In addition to Ees or Emax, pressure-volume loop data can be used to derive alternative contractility indices such as: dP/dtmax-EDV relation 20, preload-recruitable stroke work (PRSW) 21 or maximal power-EDV relations 22. These alternative parameters examine the cardiac response over a range of preloads and can be obtained with IVC constriction. It is worth noting that while ESPVR is relatively load-independent, this is not absolute. There are differences in ESPVRs derived from aortic or IVC constriction 23, with aortic constriction having a larger impact on the duration of systole and the extent of shortening 8.
Similar to the ESPVR, the end-diastolic pressure-volume relation (EDPVR) provides a load independent measure of cardiac compliance. This relation is derived by identifying end-diastolic pressures over a range of loading conditions, which is then fit to either an exponential model defined as P=α(eßV-1) +P0 (α is a stiffness and scaling coefficient,ß=chamber stiffness coefficient and P0 = pressure at a 0 volume)8 or a linear model (shown in Figure 4C). Pressure-volume loop analysis can provide additional information about diastolic function. A measure of active relaxation is derived from the decline of ventricular pressure during isovolumic relaxation. The monoexponential decay from the peak rate of relaxation to the onset of LV filling is expressed as time constant t8.
The measurement of parallel conductance is critical to the assessment of cardiac volume. While we have described the use of saline calibration to assess parallel conductance, a growing body of literature has identified alternative methods to assess parallel conductance. Saline calibration utilizes Baan’s equation 9, in which α is uniform field correction factor. However, the moving heart wall changes the electrical field thus raising the issue of a dynamic α constant 24. Moreover, the contribution of the ventricular wall to conductance varies during systole and diastole, however the saline calibration uses a fixed value for parallel conductance 24. To address this, the concepts of time varying field correction, termed Wei’s equation, and instantaneous parallel conductance, termed “admittance”, have been devised 25. Newer micro-catheters that measure admittance have been created and successfully utilized in cardiac injury models 1. These technologies represent a significant advance in the assessment of pressure-volume loop analysis.
The systolic and diastolic parameters obtained from pressure-volume loop analysis provides a comprehensive evaluation of cardiac function. The accuracy and precision of these analyses depend on attention to experimental detail. To obtain good quality cardiac pressure-volume loops in mice, a skillful operator is crucial. Additionally, care must be taken in the selection of anesthesia, proper ventilation, body temperature, and positioning of the catheter into the LV. The correct analysis of obtained data will depend on consistent instrument, saline and cuvette calibration. These aspects are highlighted in these written methods and the accompanying video should provide a framework upon which to embark on these cardiac physiology studies.
Trouble Shooting
1. Hypotension or bradycardia in a basal state: Normal mouse blood pressure and heart rate have been summarized by in previous reviews of this topic 11.
a) Ensure that body temperature is above 36 ºC using a rectal thermometer. If below 36 ºC, a heating pad or heating lamps can be used to raise the mouse body temperature.
b) Assess for bleeding during the surgical procedure. Hemostasis can be achieved with manual pressure or with cautery. Significant volume loss can be treated with saline fluid boluses.
c) Assess whether the mouse is over-anesthetized. If this is suspected, saline fluid boluses can be used to treat hypotension. Of note, ketamine/xylazine, which is used for the demonstrated experiments, can be cardiodepressive. Alternatively, inhaled anesthesia using isoflurane (Induction 3-4%, maintenance 1.5% mixed with 95% oxygen & 5% CO2) can be substituted. Alternative anesthetic agents such as urethane (800 mg kg-1)/etomidate (5-10 mg kg-1)/ morphine (2 mg kg-1) or pentobarbital sodium (40-80 mg kg-1) can be administered intraperitoneally11.
2. Noise in the pressure or volume channels: This may result from electromagnetic interference or a broken/dirty conductance catheter. Make a careful assessment of electronic devices that may contribute to interference. If noise persists, examine the conductance catheter under a microscope to assess for adherent material or damage to the catheter tip. If available, try a fresh conductance catheter to see if it remedies the problem.
3. Volume recording drifts over time: This may be due to an inadequate warm-up time for the hemodynamic module. Allow the module to warm up for 30 min before calibration steps and analysis.
5. Volume reading is larger than expected: This can occur if the measured volume has not been corrected for parallel conductance. Perform the saline calibration outlined in protocol step 6 to obtain the parallel conductance.
6. Poor quality pressure volume loops: The ideal pressure-volume loop has a square or rectangular appearance (see Figure 2 for example). If the shape of the loop is irregular, gently manipulate or twist the conductance catheter in the LV cavity to see if it changes the shape of the loop. Our preferred approach to accessing the LV is through the carotid artery (Protocol step 3.1) as this does not require opening the chest, which can affect hemodynamics. However, the carotid approach can be prone to catheter artifact an irregular loops. Thus, an apical approach (Protocol step 3.2) can be used to address this issue.
The authors have nothing to disclose.
This work is supported by the American Heart Association 14FTF20370058 (DMA) and NIH T32 HL007101-35 (DMA).
AnaSed (xylazine) | Lloyd Laboratories | NADA no. 139-236 | Anesthetic |
Ketaset (ketamine) | Pfizer | 440842 | Anesthetic |
VIP3000 | Matrx Medical Inc. | Anesthesia machine | |
Ventilator | Harvard Apparatus | Model 683 | Surgical Equipment |
Tubing kit | Harvard Apparatus | 72-1049 | Surgical Equipment |
Homeothermic Blanket | Kaz Inc. | 5628 | Surgical Equipment |
Stereo microscope | Carl Zeiss Optical Inc. | Stemi 2000 | Surgical Equipment |
Illuminator | Cole–Parmer | 41720 | Surgical Equipment |
Dumont no. 55 Dumostar Forceps | Fine Science Tools Inc | 11295-51 | Surgical Instruments |
Graefe forceps, curved | Fine Science Tools Inc | 11052-10 | Surgical Instruments |
Moria MC31 forceps | Fine Science Tools Inc | 11370-31 | Surgical Instruments |
Mayo scissors | Fine Science Tools Inc | 14512-15 | Surgical Instruments |
Iris scissors | Fine Science Tools Inc | 14041-10 | Surgical Instruments |
Halsey needle holder | Fine Science Tools Inc | 12501-13 | Surgical Instruments |
Olsen–Hegar needle holder | Fine Science Tools Inc | 12002-12 | Surgical Instruments |
spring scissors | Fine Science Tools Inc | 15610-08 | Surgical Instruments |
disposable underpads | Kendall/Tyco Healthcare | 1038 | Surgical Supplies |
Sterile gauze sponges, sterile | Dukal | 62208 | Surgical Supplies |
Cotton-tipped applicators, sterile | Solon | 368 | Surgical Supplies |
Surgical suture, silk, 6-0 | DemeTECH | FT-639-1 | Surgical Supplies |
1 cc Insulin syringes | Becton Dickenson | 329412 | Surgical Supplies |
Access-9™ Hemostasis Valve | Merit Medical | MAP111 | Hemodynamic equipment |
Sphygmomanometer | Baumanometer | 320 | Hemodynamic equipment |
Millar PV system MPVS-300/400 or MPVS Ultra (includes calibration cuvette) | ADInstruments Inc | Hemodynamic equipment | |
1.4F conductance catheter | ADInstruments Inc | SPR-839 | Hemodynamic equipment |
PowerLab 4/30 with Chart Pro | ADInstruments Inc. | ML866/P | Hemodynamic software |
animal clipper | Wahl | 8787-450A | Miscellaneous |
Intradermic tubing PE-10 (Becton Dickinson, cat. no. ) | Becton Dickenson | 427401 | Miscellaneous |
Intradermic tubing PE-50 (Becton Dickinson, cat. no.) | Becton Dickenson | 427411 | Miscellaneous |
Needle assortment (18, 25 and 30 gauge; Thomas Scientific) | Miscellaneous | ||
0.9% (wt/vol) sodium chloride injection, USP , cat. no. ) | Hospira | NDC no. 0409-4888-50 | Miscellaneous |
Surgical tape | Miscellaneous | ||
Alconox (Alconox Inc.) for catheter cleaning | ADInstruments Inc. | Miscellaneous |