Capillaroscopy is a non-invasive, efficient, relatively inexpensive and easy-to-learn methodology for directly visualizing capillaries in the microcirculation. However, only one publication to date describes the reliability of a complex software program available for quantitating capillaroscopy data. Here, we present a simple, reliable protocol for quantitating capillaries using a standardized algorithm.
Capillaroscopy is a non-invasive, efficient, relatively inexpensive and easy to learn methodology for directly visualizing the microcirculation. The capillaroscopy technique can provide insight into a patient’s microvascular health, leading to a variety of potentially valuable dermatologic, ophthalmologic, rheumatologic and cardiovascular clinical applications. In addition, tumor growth may be dependent on angiogenesis, which can be quantitated by measuring microvessel density within the tumor. However, there is currently little to no standardization of techniques, and only one publication to date reports the reliability of a currently available, complex computer based algorithms for quantitating capillaroscopy data.1 This paper describes a new, simpler, reliable, standardized capillary counting algorithm for quantitating nailfold capillaroscopy data. A simple, reproducible computerized capillaroscopy algorithm such as this would facilitate more widespread use of the technique among researchers and clinicians. Many researchers currently analyze capillaroscopy images by hand, promoting user fatigue and subjectivity of the results. This paper describes a novel, easy-to-use automated image processing algorithm in addition to a reproducible, semi-automated counting algorithm. This algorithm enables analysis of images in minutes while reducing subjectivity; only a minimal amount of training time (in our experience, less than 1 hr) is needed to learn the technique.
Microvascular imaging is a rapidly growing field with many potential clinical applications.2 For example, oncologists are using microvessel imaging to determine the extent of tumor angiogenesis, yielding valuable information concerning the state of the tumor and insight into possible treatment options. 34 However, nailfold capillaroscopy is perhaps the most cost efficient and widely applicable form of microvascular imaging. Researchers are using video nailfold capillaroscopy to study blood flow rates and investigate capillary morphology.5 6 Both video and still-picture nailfold capillaroscopy are adjuncts to care for diagnosing and treating Raynaud’s phenomenon and various connective tissue diseases such as systemic sclerosis.2
Nailfold capillaroscopy has various potential cardiovascular applications as well. Current research using nailfold capillaroscopy suggests that diabetes mellitus Type 1 and Type 2 patients exhibit a high prevalence of abnormal capillary morphology, yet have unchanged capillary densities compared to non-diabetic individuals.7-8 Capillaroscopy has also been studied experimentally in hypertension. Structural capillary rarefaction leading to a reduced capillary density has been demonstrated in hypertensive individuals compared to non-hypertensive individuals.9-10 In contrast to these older hypertensive patients (mean age 40 and above) who exhibit structural rarefaction, more recent research has demonstrated that younger hypertensive patients (mean age under 40 years old) have functional rarefaction without structural rarefaction.11 This suggests that functional rarefaction occurs before and may progress over time to structural rarefaction.
Interestingly, hypertensive patients treated with specific antihypertensive drugs such as Perindopril/Indapamide displayed normal capillary density and endothelial function after treatment, while those treated with ACE (angiotensin-converting-enzyme) inhibitors or diuretics maintained a low capillary density despite comparable blood pressure control.12 This suggests that some antihypertensive medications may normalize capillary density by reversing the capillary rarefaction caused by hypertension. In addition, other researchers have shown that a reduction in salt intake leads to reversal of both functional and structural capillary rarefaction in hypertensive individuals.13
Despite the various potential clinical applications of this technology, there is little standardization in technique for quantitating capillary density images.2 To date, researchers have found that capillary density results are reproducible from both an intra-observer and inter-observer perspective only if the exact same area is being counted each time. 1,14 15 Of note, previous researchers have largely performed capillary counts manually using the naked eye, 9 16 17 18 which is a slow and subjective process.
Standardized, computer based algorithms for quantitation of capillary images theoretically provide more efficient and reproducible data analysis with less subjectivity, facilitating clinical applications of capillaroscopy. Some researchers have indeed used computer-based programs to quantitate the data from nailfold capillaroscopic pictures. 1,6 19 20 However, only one publication to date describes reliability of a complex software program available for quantitating capillaroscopy data,1 and this program is complicated as previously noted above by the requirement to count the exact same visual field. Here, we present a simpler, reliable protocol for quantitating capillaries using a standardized algorithm which allows for the use of multiple visual fields. The use of multiple visual fields not only simplifies the procedure, but also permits the assessment of normal biological variation in capillary count.
The aim of this study is to describe a reproducible and efficient computer based algorithm which standardizes the capillary quantitation process. While these methods are not fully automated they require very little user input, and provide rapid and reliable quantitation of the pictures.
Note: The acquisition process for obtaining capillary images has previously been published and is accomplished using a still digital camera with a corresponding image acquisition and analysis computer program. 1121 This lab utilizes still images for analysis, not videos, simplifying image acquisition for analysis. The following describes the new technique for quantitating the capillaries from the images.
1. Image Enhancement Process
2. Performing Capillary Counts / Quantitating Capillary Density
3. Creating and Using Macros to Automate Image Processing
Note: To save time, macros can be created in order to automatically perform a specific sequence of processes on one or many images. These sequences can be customized in order to make the image modifications quicker. In essence, these macros remember how the images are processed, and perform all the steps quickly and with no user input. Performing counts on 12 capillary images takes this lab between 20 to 30 min with the macros (2 to 3 min per picture), as opposed to about 8 min per picture without the macros. Therefore using the macros is 3 to 5 times more efficient than manually processing each individual image.
The goal of this image processing procedure is to differentiate the capillaries from the background image so they can be accurately quantified. Both incomplete image processing and excessive image processing are detrimental to the program’s ability to quantify the capillaries. As seen in Figure 3, incomplete image processing makes the capillaries difficult to distinguish from the background. It is critical that the user be able to readily distinguish the border of a capillary since the counting method described above depends on the user’s ability to accurately highlight a few capillaries. On the other hand, as seen in Figure 3, the application of unnecessary image processing steps can lead to blurring of the capillaries and therefore can also be detrimental to the quantification process.
An optimally processed image can be counted within 30 secs and clearly distinguishes capillaries from background as well as individual capillaries from each other. An example of a processed image is seen in Figure 2 part D, with the counted image shown in Figure 3.
Capillary density differs depending on the location of the nailbed being counted. Table 1 shows that capillary density increases with distance from the top row of capillaries at the nailbed. Standardization of the ROI placement is crucial to count reproducibility. Figure 1 shows how images can be altered with different ROI placements.
ID | T1 | T2 | T3 | T4 | Mean Top | M1 | M2 | M3 | M4 | Mean Middle | L1 | L2 | L3 | L4 | Lowest |
Patient A | |||||||||||||||
Baseline | 46 | 45 | 44 | 46 | 45.25 | 64 | 62 | 62 | 62 | 62.5 | 66 | 67 | 66 | 66 | 66.25 |
Venous Occlusion | 51 | 53 | 49 | 59 | 53 | 59 | 61 | 64 | 69 | 63.25 | 70 | 70 | 75 | 72 | 71.75 |
Patient B | |||||||||||||||
Baseline | 47 | 51 | 48 | 51 | 49.25 | 73 | 74 | 75 | 81 | 75.75 | 76 | 85 | 81 | 80 | 80.5 |
Venous Occlusion | 68 | 57 | 65 | 64 | 63.5 | 75 | 78 | 76 | 72 | 75.25 | 91 | 89 | 93 | 83 | 89 |
Patient C | |||||||||||||||
Baseline | 51 | 54 | 51 | 56 | 53 | 66 | 59 | 58 | 60 | 60.75 | 60 | 61 | 62 | 69 | 63 |
Venous Occlusion | 62 | 66 | 57 | 59 | 61 | 63 | 63 | 73 | 65 | 66 | 83 | 74 | 81 | 77 | 78.75 |
Table 1: Variation in Capillary Counts with Differential Positioning in the Fingernail Bed. This table shows the counts obtained for three different patients (A, B, C) when the ROI box is variably positioned at the top (counts T1 – T4), middle (M1 – M4), and lower regions (L1 – L4) of the fingernail bed. The mean counts increase from the top to lower regions, demonstrating the need for standardization of ROI box placement to compare counts obtained from different laboratories.
Performing counts in the area described in step 1.2, baseline counts should range from 30 to 60 capillaries/mm2 while venous occlusion counts can range anywhere from 50 to 100. As seen in Table 1, these densities differ from other literature. Capillary density counts obtained in the authors’ laboratory are most likely lower because this lab begins counts at the first row of capillaries, where the density is lowest. As seen in Table 1, performing counts in lower regions of the nailbed increase the counts toward values obtained previously by Antonios et al9 and Debbabi et al.16 This discrepancy illustrates the need for standardization in quantification of nailbed capillaroscopy by counting the first (most proximal) row of capillaries. Counting at the first row of capillaries is also optimal because the capillaries are most clearly and completely visualized in the first row and progressively become less visible with subsequent rows.
Blinded reproducibility studies using N = 10 subjects and two independent observers were conducted. Reliability results refer to the average A, B, and C counts, obtained by averaging results across 4 images for each. The A, B, and C counts represent different physiologic states within the same individual that are used to assess microvascular health, briefly summarized here. Details have been previously published 21. Capillary Density is defined as the number of capillaries per square millimeter (mm2) of finger nailfold skin. Stage A is a resting baseline stage where the capillaries are continuously perfused 16. Stage B occurs during postocclusive reactive hyperemia. These counts represent the sum of continuously perfused and intermittently perfused (functional reserve) capillaries. This stage is used as a measure of capillary function 16.
Stage C occurs during venous occlusion, therefore showing maximal capillary density including both perfused (with active red blood cell (RBC) motion) and nonperfused (filled with stagnant, non-moving RBCs) capillaries.22
For intra-rater reliability, the intraclass correlations (ICC) were 0.93 for mean A counts, 0.93 for mean B counts, and 0.94 for mean C counts. For inter-rater reliability, the ICCs were 0.94 for mean A counts, 0.98 for mean B counts, and 0.94 for mean C counts. Accordingly, the technique described here demonstrates excellent reliability with good results for both intra and inter-observer reproducibility.
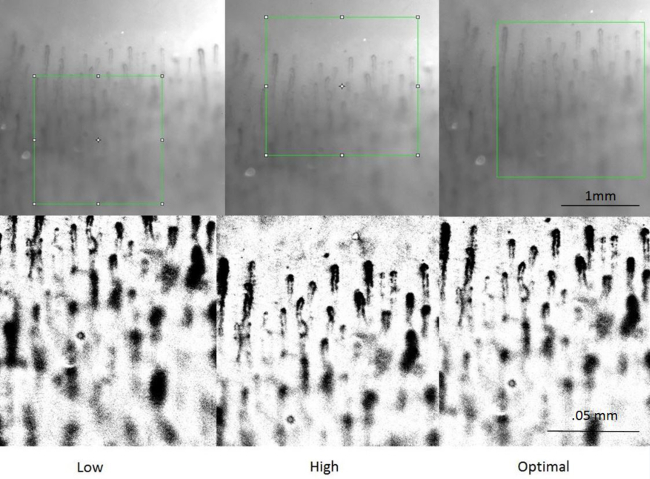
Figure 1. Standardizing the Crop Location. This figure illustrates how variable placement of the ROI box visibly alters the cropped image. On the left, the box is placed too low, cutting off the first row of capillaries. The middle box is placed too high, causing a blank space above the first row of capillaries. The box on the right is optimally placed. Its cropped image shows the first row of capillaries at the very top of the image. Please click here to view a larger version of this figure.
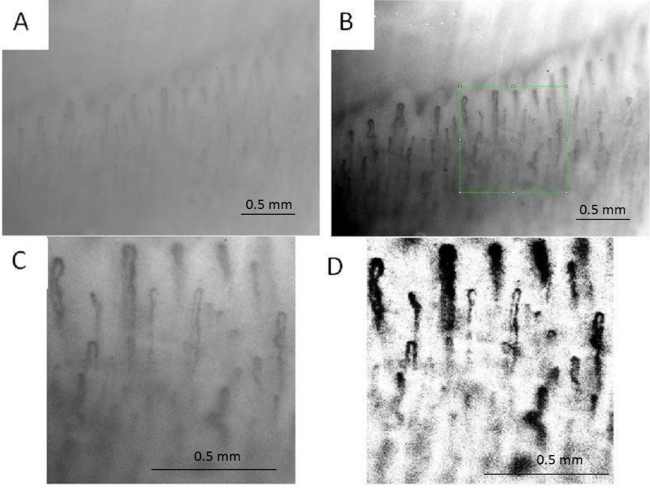
Figure 2. Stages of Image Processing.(A) Stage A shows the initial image taken from the subject’s nailbed with a monochrome camera; (B) Stage B shows the original image after the first contrast enhancement. The green box shows a 530 x 530 pixel box, which is equivalent to 1 x 1 mm box for the camera; (C) Stage C represents the 1 mm box cropped from image B; (D) Stage D shows the enhanced image after applying the enhancements discussed above. Please click here to view a larger version of this figure.
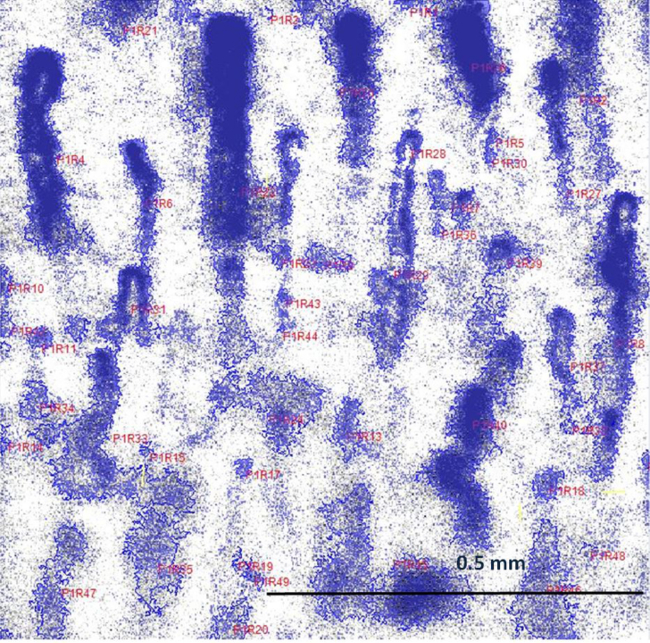
Figure 3. Final Counted Image. The enhanced, counted image. The total count determined for this image was 54 capillaries/mm2. Please click here to view a larger version of this figure.
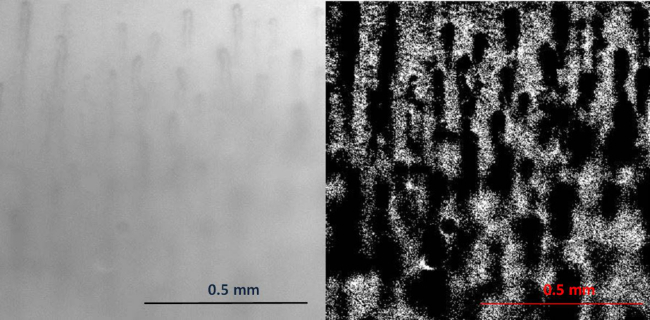
Figure 4. Improper Image Processing. Please click here to view a larger version of this figure.
The photo on the left shows a photo that is not processed enough. The capillaries are difficult to distinguish from the background and the quantitation process will be negatively affected. The photo on the right shows the same image after incorrect image processing. Individual capillaries are difficult to distinguish from their neighbors and thus the quantitation process will be negatively affected.
Nailfold capillaroscopy shows promise as a clinically useful tool in the future for various oncology, cardiovascular, and rheumatologic disease applications. The image acquisition process is fairly consistent among researchers, yet there are currently multiple methods for image processing and analysis. Methods currently include computerized and manual capillary counts. Manual counts are problematic as they are time-consuming, and subject to user subjectivity and fatigue. Current computer based methods require a high level of user input, both in the image enhancement process and the quantification process. The new method described here requires relatively little user training or involvement, as the image enhancement steps are entirely automated. User input is only required for the counting process initially to distinguish capillary from background in the processed images. Using the automated macros as described here is three to five times more efficient than manually processing each individual image.
Reliable standardized computer based algorithms to quantitate capillaroscopy data are lacking.
Reliable standardized computer based methods are needed for capillary quantitation in order to reduce subjectivity and promote efficiency. The technique described here demonstrates excellent reliability with good results for both intra and inter-observer reproducibility with intraclass correlations of 0.93 to 0.98. We have previously reported the correlation of results obtained via computerized capillary density assessment, compared to the gold standard of manual counting.21 Pearson correlations between baseline, post-ischemic, and venous congestion counts done with the software and corresponding manual counts in 10 subjects were 0.78, 0.78, and 0.71 respectively (all p <0.05), indicating reasonable agreement between the two methods.
This lab’s image manipulation steps utilize a number of computer processing tools. Step 1.3, image “flattening,” removes the various “layers” that are present in each image. This must be done first so all future image processing procedures will be applied evenly to all parts of the image. Contrast adjustment both darkens the capillaries and pales out the background, therefore making the capillaries more visible. The “despeckle” process smooths the edges of the capillaries while maintaining their size and shape. Although there appear to be no differences in a despeckled image to the naked eye, this is an important process to help ensure multiple capillaries do not blend together during the counting process. Finalizing the image using a “best fit histogram” excludes all pixels at either extreme of the histogram. This helps define the borders of the capillaries while further enhancing the contrast between the capillaries and the background. Overall there are three contrast enhancement steps, and all three are necessary to maximize the clarity of the final image for capillary counting.
Occasionally, the program will count too many or too few capillaries. The first step to fix this problem is to undo the highlighting and simply try the highlighting process again. If the capillaries are being highlighted incorrectly, adjusting the minimum capillary diameter may be necessary. The authors recommend a default minimum diameter of 5 pixels. If the program is counting too many capillaries or counting one capillary as multiple capillaries the user should increase the minimum diameter by one or two pixels. On the other hand, if the program is not counting dark pixel groups that are capillaries, the user can reduce the minimum diameter by one pixel.
There is also a need to standardize the position for these counts within the nailbed. As seen in the Table, counts in the same individual are highly position dependent, varying greatly based on which part of the nailbed is being counted.
Critical steps of the protocol include proper and optimal visualization of the capillaries. The steps allowing optimal visualization of the capillaries in this protocol are fully automated, allowing for rapid and accurate image manipulation. While these methods represent a major advancement in the reliability and ease of processing and counting capillaroscopic image, the major limitation of the technique is the semi-automated counting process. Ideally, a fully automated process will be created in the near future. Researchers should feel encouraged to build upon the methodology described in this paper in order to develop a fully automated clinically useful technology that allows rapid quantification of a patient’s nailfold capillary density.
The authors have nothing to disclose.
This project was supported by Grant Numbers HL96593 from NIH and D56HP20783 from HRSA/ HHS. Its contents are solely the responsibility of the authors and do not necessarily represent the official views of the NIH or HRSA / HHS.
Image-Pro Premier | Media Cybernetics, Inc | 9.1 | Image processing software |