Summary
This manuscript describes a detailed protocol for the collection of pressure-volume data from the mouse.
Abstract
Understanding the causes and progression of heart disease presents a significant challenge to the biomedical community. The genetic flexibility of the mouse provides great potential to explore cardiac function at the molecular level. The mouse's small size does present some challenges in regards to performing detailed cardiac phenotyping. Miniaturization and other advancements in technology have made many methods of cardiac assessment possible in the mouse. Of these, the simultaneous collection of pressure and volume data provides a detailed picture of cardiac function that is not available through any other modality. Here a detailed procedure for the collection of pressure-volume loop data is described. Included is a discussion of the principles underlying the measurements and the potential sources of error. Anesthetic management and surgical approaches are discussed in great detail as they are both critical to obtaining high quality hemodynamic measurements. The principles of hemodynamic protocol development and relevant aspects of data analysis are also addressed.
Introduction
Cardiovascular disease continues to be a significant cause of mortality and morbidity throughout the world 1. Diseases of the heart present particularly difficult challenges in developing new therapies. Advances in genetics provide for the possibility to identify a multitude of potential genetic contributors to the development of heart disease. The integrative nature of the cardiovascular system requires that these genetic targets be validated in intact animal models. The genetic flexibility and low housing costs of the mouse have brought it to the forefront for the assessment of the physiological role of a given gene. The small size of the mouse presents some unique challenges for the assessment of cardiac function. There are several modalities that can provide information regarding cardiac function, but only the simultaneous measurement of ventricular pressure and volume allows pressure-volume (PV) loop analysis of ventricular function. PV loops allow cardiac function to be analyzed independent of its connection to the vasculature; an important factor in determining the functional role of a particular genetic element.
The assessment of pressure-volume loops has been used both experimentally and clinically for many years and extensive literature exists regarding the analysis of these data sets 2,3. The adaptation of PV loop technology to the mouse has been an important advancement for the understanding of murine cardiac physiology 4-6. Catheter based PV loop technologies couple a pressure transducer and the use of conductance to estimate ventricular volume. The ventricular volume is determined by examining changes in an electrical field generated by the catheter. This method models the ventricle as a cylinder, the height of which is defined by the distance between the electrodes on the catheter and the radius is calculated from conduction of an electrical field through the blood in the ventricle 7-9. The conductance signal measured by the catheter has two components. The first is the conduction through the blood; this varies with the volume of the ventricle and constitutes the primary signal used to determine ventricular volume. The second component results from conduction through and along the wall of the ventricle. This is called parallel conductance and must be removed in order to determine the absolute ventricular volume. There are two commercially available systems for the collection of pressure-volume data in the research laboratory and the method used to calculate and remove the parallel conductance is the primary difference between them 6,10,11. Conductance catheters require the injection of hypertonic saline for the calculation of parallel conductance. This injection transiently changes the conductivity of the blood in the ventricle, while the conductivity of the wall remains constant. From this data it is possible to determine the component of the conductance signal that originates from the blood and what comes from the ventricular wall. This approach assumes that parallel conductance does not vary during the cardiac cycle. The admittance method relies on phase changes in the electrical field to assess the contribution of the ventricular wall to the overall volume signal. This method relies on a variety of predetermined constants for the conductivity of the blood and myocardium to determine the final volume, but makes continuous measures of parallel conductance during the cardiac cycle. Both of these systems provide good estimates of left ventricular volume and the differences between them are not likely to be physiologically significant. The cylindrical model of the ventricle and other assumptions render these catheter-based approaches not as accurate as other modalities, but this data is provided on a beat-by-beat basis that is essential for the assessment of load independent measures of cardiac function.
The procedure outlined here is used in my laboratory and has provided data for a large number of studies examining the basic pathophysiological mechanisms of dystrophic cardiomyopathy 12-18. The procedure outlined below is one of two that can be used to obtain PV loop data. While many of the principles are applicable for either approach, this protocol will focus on an open-chest apical approach; a closed chest protocol has been detailed elsewhere 19,20. While the procedure will be described in detail, the important overarching principles are to expose the heart with minimal damage to either the heart or the lungs. Throughout the protocol it is important to remember that this is a non-survival procedure and that having a good exposure of the heart is critically important for the proper placement of the catheter.
Protocol
Before performing any of the procedures described in this protocol, obtain approval by the local institutional animal care and use committee.
1. Setting Up the Experimental Rig
Note: This procedure is performed on anesthetized animals and the quality of the data is proportional to the quality of the anesthetic support offered to the animal. This first section will detail the equipment and procedures necessary to provide anesthesia to the mouse while performing this protocol.
- Select an anesthetic protocol. Inhalant anesthetics have many beneficial properties for performing PV-loop analysis, although some injectable protocols have been used as well. See the discussion for more information on choosing an anesthetic regime.
- Secure compressed oxygen tanks to the surgical table or wall near the surgical site.
- If using inhalant anesthetics, use a vaporizer to insure proper dosing. Calibrate vaporizers annually to ensure they are providing the appropriate dose of anesthetic gas. Connect vaporizers to a flow meter which allows control of the rate at which gas enters the anesthetic circuit. Set at 0.5 – 1.0 L/min.
- Use a manifold to allow directed flow of anesthetic gas to 1) the induction chamber, 2) a mask, and 3) the ventilator. Scavenging anesthetic gas is critically important and should be performed by an active system that either vents into a fume hood (or other similar building infrastructure) or through a canister designed to remove anesthetic gases.
Note: Check with local occupational health officials to ensure compliance with all local regulations. - Maintain core body temperature by using heating pads and/or warming lamps. Continuously monitor body temperature with a rectal thermometer. This will allow for proactive increases or decreases in heating to ensure a physiological body temperature (≈ 37 °C) during the collection of hemodynamic data.
- Provide fluid support to counteract blood loss and insensible volume loss.
- Prepare a 10% solution of albumin in 0.9% NaCl by taking 1 ml of 25% albumin and adding 1.5 ml of 0.9% NaCl in a syringe.
- Prepare a low residual volume intravascular catheter.
- Use pliers to crush the plastic hub of a 0.5 inch 30 gauge needle. Using needle holders, grasp the needle and remove the hub. Scrape the remaining adhesive from the needle using a hemostat. Insert the blunt end of the needle into a length of microbore tubing. Use less than 20 inches of length for the tubing.
- Use a syringe pump to allow accurate volumes to be delivered.
- Ensure proper ventilation for the collection of high quality PV data. There are a variety of mouse ventilators available for purchase. Pressure-controlled ventilators provide the closed environment required for inhalant anesthetic gases and provide better control of the ventilation during the procedure.
- Ensure that inspiratory pressures are limited to <15 cm H2O to prevent barotrauma. Set the ventilator to deliver the inspiratory pulse during 35% of the respiratory cycle. The use of positive end-expiratory pressure (PEEP) at a level of 4 – 5 cm H2O will greatly improve the ventilation of the mouse, by preventing atelectasis of the lung and supporting gas exchange.
- Limit the dead space distal to the Y-joint in the ventilatory circuit. This is critical because the mouse's tidal volume is very small and any dead space subtracts from the delivery of fresh inspired air.
- Create a mouse sized endotracheal (ET) tube by cutting the tip off of a 20 gauge indwelling intravascular catheter. This provides a tapered point for easier insertion. Place the cut end into the Y-joint of the anesthetic circuit.
- Use flexible tubing in the respiratory circuit. Any structural memory in the tubing will create external forces that have the potential to pull the endotracheal tube out of the mouse's airway.
- Let the mouse determine the respiratory rate by using the lowest rate that suppresses the endogenous respiratory drive. Start at a relatively slow respiratory rate of around 60 breaths per minute.
Note: With appropriate ventilation the mouse should make very little effort to breathe. However, if ventilation is inadequate, the buildup of CO2 in the blood will initiate respiratory effort by the mouse. If this is observed, increasing the respiratory rate is a straight-forward way to increase alveolar ventilation. It is often necessary to increase respiratory rate in response to elevations in cardiac workload associated with beta-adrenergic receptor stimulation. - Once the respiratory circuit is prepared, pressure test the system by plugging the tip of the endotracheal (ET) tube with a finger. Ensure an airway pressure of ≈10 cmH2O. This test should be performed prior to each procedure.
2. Surgical Approach
- Use small forceps and scissors and other equipment from Table 1. All instruments are quite small to allow for easy use in the magnified surgical field. Use a surgical stereomicroscope to provide adequate magnification for several aspects of the surgical procedure.
- Use a cautery to maximize hemostasis during the procedure.
Note: There are a couple of broad classes of cautery. Thermocautery heats a thin metal element that will cut through muscle tissue and stop bleeding. These systems are initially relatively inexpensive; however it is important to note that the wire tips are both fragile and relatively costly. Electrocautery systems are more costly to purchase initially, but the tips are very sturdy and will not need to be replaced. - Induction and Surgical Preparation
- Obtain the body weight of the mouse.
- Place the mouse into an induction chamber that is filled with 5% isoflurane.
Note: The mouse cannot survive more than a few minutes in this environment. Only 45 – 60 sec are required for the mouse to lose its righting reflex (efforts to flip over when placed on its back or side). - Once the righting reflex is lost, reduce the isoflurane concentration to 2% and open the anesthetic gas to the mask.
- Quickly transfer the mouse to the operating table and place it in dorsal recumbency with its nose within the mask.
- If using electrocautery, use saline soaked gauze to electrically couple the mouse to the grounding pad of the electrocautery system.
- Secure the limbs with surgical tape. This tape provides adhesive properties even when wet.
- Insert a rectal thermoprobe for monitoring core body temperature. Secure with tape.
- Apply a depilatory to the neck and chest of the mouse. Wait 2 – 3 min for the depilatory to work, and then remove the fur from these areas using a cotton-tipped applicator and/or laboratory wipes.
Note: Draping of the surgical field is not required, as this is a non-survival procedure, but may be desired to limit the surgeon's exposure to the cautery grounding pad, if used. - Once the mouse is prepped for surgery, assess the surgical plane of the mouse by performing a toe-pinch. Once assured of an appropriate anesthetic depth the mouse is ready for the first incision.
- Obtain control of the airway through oral intubation or tracheotomy. Tracheotomy is a convenient approach that is relatively simple to perform.
Note: Throughout this procedural description all directions and orientations will be relative to the surgeon.- Make an incision at the level of the sternal notch extending from ≈ 5 mm right of the mid-line to ≈ 5 mm left of the midline.
- Make a second incision extending along the right edge of the first incision, extending rostrally to a level ≈ 2 mm caudal to the end of the mandible.
- Make a third incision extending from the rostral end of the second incision over to ≈ 5 mm left of mid-line. Retract the resulting skin flap to the left to expose the underlying tissues.
- Separate the parotid and submandibular salivary glands at the midline by blunt dissection. This will expose the underlying musculature overlying the trachea.
- Bluntly separate the right and left sternohyoideus muscles to expose the trachea.
- Pass a ≈10 cm piece of 3-0 silk suture under the trachea, taking care to not include the esophagus.
- Identify location for the tracheotomy: just caudal to the larynx there is a gap before the first tracheal ring, this is an ideal location to perform the tracheotomy.
- Adjust the manifold to provide anesthetic gas to the ventilator and turn on the ventilator.
- Check for leaks by plugging the tip of the endotracheal (ET) tube with a finger. Ensure an airway pressure of ≈10 cmH2O.
- Using a 20 gauge needle as a scalpel, incise the trachea. Make the incision relatively wide, as the ET tube will fill much of the tracheal lumen.
- Moving quickly, remove the mask and carefully insert the ET tube into the trachea. Do not force it as the tissues are very fragile and breaking through the wall of the trachea can result in a pneumothorax.
Note: Immediately upon insertion, chest excursions should become evident. - Secure the ventilatory circuit with tape to prevent the ET tube from being pulled out.
- Tie a single overhand knot in the 3-0 suture to form a seal around the ET tube.
Note: At this point chest excursions should be clearly evident. If not it is usually the positioning of the ET tube within the trachea that is the problem. Pull the ET tube back and try to reposition it, focusing on the orientation of the trachea as a guide.
- Preparation of the Jugular Vein Site
- Retract the left salivary glands rostral-laterally exposing the external jugular vein.
- Bisect the thin muscle (sternomastoideus) covering the vein with blunt dissection. This will expose the outer surface of the jugular vein.
- Carefully clear off any major pieces of tissue, although caution must be used as the walls of the vein are very thin. Once this task is complete, cover the jugular vein with the salivary glands to preserve it for cannulation later.
- Thoracotomy; entering the pleural space without damaging the heart or lungs
- Remove much of the skin covering the chest extending the right edge of the original skin incision down to the level of the xiphoid process, then across the midline to ≈ 1.5 cm left of the midline.
Note: Care should be taken when cutting through the external mammary vessels, which can be a significant source of bleeding. Cauterizing these vessels before cutting them will largely prevent this bleeding. - Using blunt dissection, retract the skin flap laterally to expose underlying musculature.
- Isolate the insertion of the pectoralis major on the right side near the caudal aspect of the sternum using vessel dilating forceps. Cauterize and cut the muscle.
- Cut through the pectoralis major along its attachment to the sternum. Cauterize the cut edges to ensure hemostasis.
- Next undermine the latissimus dorsi on the same side, which is a large sheet of muscle covering the lateral aspect of the mouse. Cauterize and cut this muscle and then retract the cut end cranially. This may require some blunt dissection.
Note: The ribs are now clearly evident and the heart may also be visible in some mouse strains. In most mice, entering the chest in the caudal half of the fourth intercostal space will provide good access to the heart. The fourth intercostal space is the second most caudal space. - To enter the chest, use a pair of sharp forceps to carefully dissect down through the intercostal muscle layers.
- Once the pleural space has been opened, carefully insert the blunt-tipped vessel dilators. Using the vessel dilators to provide gentle upward force on the chest wall, use the blunt end spring scissors to carefully incise the remainder of the intercostal muscles.
- First cut laterally, being careful not to cut the lung lobe underneath. Next extend the incision medially, but stay 3 – 4 mm lateral of the midline to avoid the internal mammary artery.
Note: The internal mammary vessels run parallel to the sternum and can result in significant blood loss if cut accidentally. - Carefully cauterize the cut edge of the intercostal muscles, using a small cotton tipped applicator to roll the tissue upward to allow cautery contact with cut tissue without coming in contact with the lungs or the heart.
- Place a saline soaked small cotton tipped applicator through the incision pointing toward the midline. Provide a gentle upward traction to pull the chest wall away from the underlying structures. Begin cauterizing the chest wall at the medial edge of the incision and ending ≈ 1 cm lateral of the midline on the left side.
- Advance the applicator to the left so that it is continuously under the cautery tip.
- Once the tissue is thoroughly cauterized, use scissors to carefully cut through the sternum. The apex of the heart should be clearly visible at this point.
- Using blunt dissection, disrupt the pericardium and identify the caudal vena cava.
- Check for evidence of any bleeding and cauterize it now. Once all bleeding has been addressed, carefully remove any draping, the cautery grounding pad, and the saline soaked gauze.
- Remove much of the skin covering the chest extending the right edge of the original skin incision down to the level of the xiphoid process, then across the midline to ≈ 1.5 cm left of the midline.
- Placing the Jugular Vein Catheter
- Connect the catheter made in step 1.6.2 to the syringe containing 10% albumin by carefully slipping the tubing over a 30 gauge needle.
- Begin infusing the albumin through the catheter.
- Orient the catheter such that the needle lies upon the jugular vein on its own, with the needle bevel up. If necessary, use a needle holder to rotate the needle in the tubing to move the bevel to the proper orientation.
- When the catheter is fully flushed stop the infusion.
- Grasp the catheter needle with a forceps. With the other hand, use a tissue forceps to retract the salivary gland to allow visualization of the jugular vein. Apply gentle traction to the tissues surrounding the distal jugular vein creating tension on the vessel wall. Using a shallow angle of approach, carefully insert the needle into the vein. Advance the tip of the needle 3 – 4 mm into the vessel.
- Before releasing the catheter needle secure the catheter tubing with a piece of tape, this will limit any movement of the needle once released.
- Release the needle and gently pull back on the syringe plunger to confirm that the catheter is in the lumen of the vessel, by visualizing blood in the line.
- Once positioned properly secure the catheter with surgical glue to attach the needle to the underlying salivary glands.
- Calculate the total volume to be infused. If there was not significant blood loss a volume of 5 µl/g body weight will be sufficient. If there was significant blood loss infusing 6 – 6.5 µl/g may be required. Set the flow rate such that the entire infusion will be complete in 10 – 15 min.
- PV Catheter Placement in the Left Ventricle
- During the surgical procedure described above, place the PV catheter in a syringe containing a saline solution to allow it to equilibrate.
- Just prior to placement, move the syringe and catheter next to the mouse. With the catheter tip at roughly the same height as the heart, zero the pressure reading.
- Using a saline soaked small cotton tipped applicator, maneuver the heart to allow visualization of the apex.
- Using a 25 gauge needle, make a stab incision as close to the center of the apex as possible.
- Following the removal of the needle, quickly insert the catheter through the incision. It does not take much force to insert the catheter, so show restraint when advancing the catheter into the ventricle. Occasionally it is necessary to perform an additional stab incision. If this is necessary, try to perform the subsequent incision near the initial location to minimize damage to the heart.
Note: Once the catheter is advanced into the ventricle the final placement is critically important. The ventricular pressure tracing will be evident by a low diastolic pressure (<10 mmHg) and a high systolic pressure (>80 mmHg at this point). Ideally, the catheter will be centered in the ventricle with the outer electrodes just within the ventricle. Fine adjustments in catheter position can be performed by observing the PV-loop data, looking for a box-shaped tracing with ≈ 90° angles between the sides.
3. Procedural Details
Note: Once the catheter is in place a brief stabilization period (10 – 15 min) is necessary to allow the animal to recover from some of the acute surgical stress and to allow time for the infusion of fluids. After this stabilization period the actual protocol can begin.
- Once the PV catheter is placed and surgical manipulation has ceased, turn down the isoflurane to ≈ 1% as the need for a deep surgical plane of anesthesia is lessened.
- During this period, carefully monitor the mouse to ensure that an appropriate level of anesthesia is maintained. Carefully assess any movement; movement of the respiratory muscles suggests a level of hypoventilation and can be addressed by increasing the respiratory rate of the ventilator. Movement of limbs or twitching of whiskers are signs that the mouse is getting too light and requires more anesthetic.
Note: There are a wide variety of permutations of treatments that can be used in combination with this protocol. Many of these treatments will require infusion of drugs. It is essential to manage the dead-space volume effectively. Solution switches can be accomplished by sliding the catheter tubing from the needle of one syringe pump to the other. Doing this shortly before the end of the earlier infusion allows the catheter tubing to be loaded with the next drug. It is necessary to know the volume within the catheter tubing to determine the timing of the solution switch. The introduction of a small air bubble in the line allows the precise timing of the infusion switch to be determined; this bubble infused into the venous circulation is well tolerated.
- During this period, carefully monitor the mouse to ensure that an appropriate level of anesthesia is maintained. Carefully assess any movement; movement of the respiratory muscles suggests a level of hypoventilation and can be addressed by increasing the respiratory rate of the ventilator. Movement of limbs or twitching of whiskers are signs that the mouse is getting too light and requires more anesthetic.
- Alter the loading conditions of the heart by lowering preload and increasing afterload.
- Reduce preload by blocking the venous return to the heart. In this preparation, visualize and occlude the caudal vena cava as it passes from the diaphragm to the heart. Perform this occlusion smoothly and relatively quickly, lasting no more than 2 – 3 sec. Increase left ventricular afterload transiently by performing a gentle abdominal compression lasting 1 – 2 sec.
- During these changes in loading of the heart, pause respirations to eliminate any artifact introduced by the ventilator.
- Calibrate the volume signal using the conductance catheters. These procedures are not necessary with catheters using admittance technology.
- After the experimental protocol inject 5 – 10 µl of hypertonic saline (20% NaCl) to calculate the parallel conductance.
- Collect blood by removing the catheter and drawing blood from the left ventricle into a heparinized syringe. Place this blood into cuvettes of known volume and use the catheter to measure the conductance.
- Use the cuvette conductance measures to convert the conductance signal to volume and the parallel conductance is necessary to define the absolute volume measured by the catheter.
- Once the protocol is complete, euthanize the mouse by removing the heart following transection of the vena cava and aortic attachments.
Representative Results
By convention, volume is plotted on the X-axis and pressure on the Y-axis as in Figure 1. The pressure-volume loops resulting from plotting pressure against volume should resemble a rectangle, the vertical edges representing isovolumic changes in pressure (i.e., when both mitral and aortic valves are closed). The bottom horizontal represents ventricular filling through the mitral valve and the upper horizontal portion represents ventricular emptying through the aortic valve. In a healthy wild type mouse left ventricular pressures of 90 – 110 mmHg are expected with maximal dP/dt of 8,000 – 12,000 mmHg/sec (see Table 1 for ranges of normal hemodynamic parameters). The normal ranges provided in the table are based on values obtained from wild type C57BL/10 and C57BL/6 mice; however, it is important to note that there are significant differences between strains 21. The procedure outlined here focuses on the use of an apical stab incision to position the catheter within the left ventricle. Another popular approach is to insert the catheter retrograde through the aortic valve following catheter insertion in the right carotid artery. The retrograde approach as the advantage in that it can be performed with a closed chest, resulting in the maintenance of normal intra-thoracic pressures; however, animals are frequently ventilated during this procedure which limits this advantage. The closed chest approach limits control over the catheter orientation within the ventricle, while the open chest approach provides greater ability to maneuver the catheter within the ventricle. A potential problem with retrograde insertion of the catheter is the potential for outflow track obstruction. The diameter of the mouse aorta varies from 0.8 to 1.2 mm 22,23, the diameter of commercially available pressure-volume catheters ranges from 0.33 (1.0 French) to 0.47 mm (1.4 French). The relative sizes of these catheters in the context of a large and small aorta are depicted in Figure 2. The fraction of the outflow tract blocked by the catheter crossing the aorta can become a significant issue in smaller hearts and should be taken into account when performing PV loop studies in small hearts. There are several artifacts of measurement that can complicate the analysis of PV data, one of the most common is catheter entrapment. This is evident as a spike in pressure at the end of systole likely resulting from direct compression of the pressure transducer by a papillary muscle or other dynamic structure within the ventricle (Figure 3). This is problematic, because most methods for determining systolic function use the maximum pressure. The systolic pressure and maximum derivative of pressure (dP/dt) from data sets with catheter entrapment need to be examined closely and the analysis may need to be altered to obtain meaningful data.
Pressure-Volume loops can be used in a wide variety of protocols to assess cardiac function. These include assessments of cardiac reserve via β-adrenergic stimulation 12,14,16,17. A wide variety of drugs may be infused to assess any acute effects on cardiac physiology. Control of the airway also allows for the administration of altered gas mixtures allowing the effects of hypoxia and/or acidosis on cardiac function to be addressed directly 24-27. Furthermore, analysis of this PV data can also provide a detailed assessment of the passive properties of the left ventricle, which can be altered significantly in various disease states 12.
| Parameter | Normal Range |
| Systolic Pressure | 90 – 110 mmHg |
| Diastolic Pressure | 4 – 10 mmHg |
| Maximum dP/dt | 8,000 – 12,000 mmHg/sec |
| Minimum dP/dt | -8,500 – -12,000 mmHg/sec |
| Tau | 5 – 6 sec |
| Heart Rate | 550 – 600 bpm |
| Cardiac Output | 10 – 13 ml/min |
| Ejection Fraction | 40 – 60% |
Table 1. Normal Values for Selected Hemodynamic Parameters.
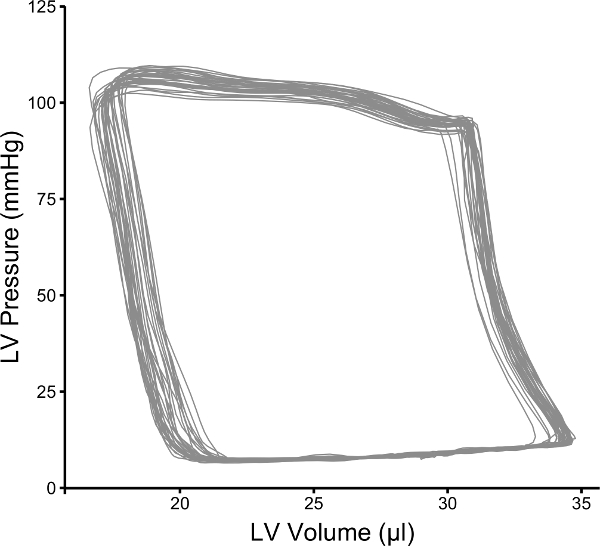
Figure 1: Representative Pressure-volume Loops from a Wild Type C57BL/10 Mouse. Representative data that was collected using the procedures described in this manuscript. Please click here to view a larger version of this figure.
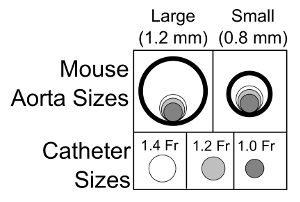
Figure 2: Schematic Representation of the Importance of Aortic Diameter and Potential Outflow Track Obstruction. Schematic drawing of the relative sizes of the mouse aorta and the commercially available pressure-volume catheters for mice. These data underscore the importance of considering outflow track obstruction when assessing smaller mice using a retrograde catheter insertion approach. Please click here to view a larger version of this figure.
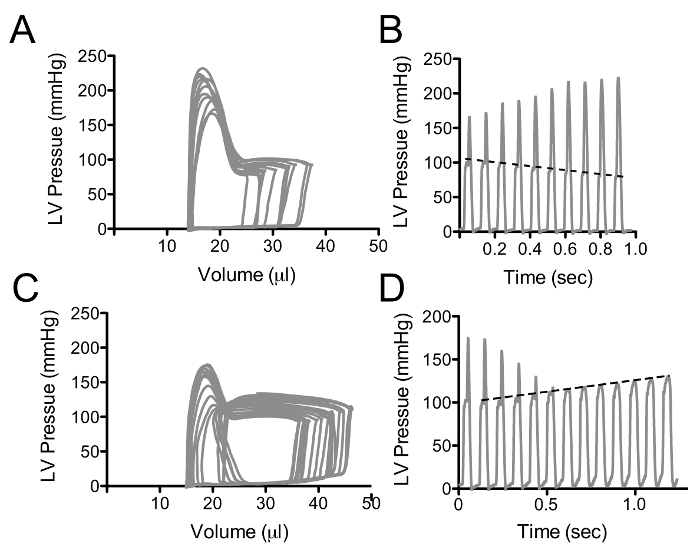
Figure 3: Pressure-volume Loops with Catheter Entrapment. These data represent an example of a pressure spike in late systole, likely resulting from direct compression of the catheter by an internal cardiac structure. Declines in end-diastolic volume (A) result in an increase in the pressure peak as the ventricle gets smaller, however the systolic pressure prior to the peak declines as expected, depicted as a dashed line in B. (C and D) represent the pressure-volume loops (C) and pressure-time (D) curves following abdominal compression. As the left ventricular volume increases, the pressure spike gets smaller and the underlying increases in systolic function becomes apparent; dashed line in D. Please click here to view a larger version of this figure.
Discussion
There are three critical steps in this procedure: 1) the placement of the endotracheal tube and appropriate ventilation, 2) placement of the jugular IV catheter, and 3) the proper placement of the PV catheter in the left ventricle. Determining the appropriate respiratory rate is an important part of providing ventilatory support. Conscious mice generally maintain alveolar ventilation with rapid shallow breaths. In general, ventilated mice will have much larger tidal volumes. Thus a slower respiratory rate is required. This is important as too little ventilation will result in respiratory acidosis and too much ventilation will lead to respiratory alkalosis, both conditions that will alter cardiac function. A simple way of optimizing the respiratory rate is to take cues from the mouse's respiratory effort and use the lowest respiratory rate that eliminates respiratory effort from the anesthetized mouse.
A critical feature of PV loop analysis is to maintain a sufficient level of anesthesia without significant depression of cardiac function. There are many anesthetic regimes that can be successfully applied to perform PV loop analysis. These can be divided into two broad categories: inhalant and injectable anesthetics. Within this latter group are a variety of mixtures that can be used, however, many of these mixtures have potential cardio-depressive effects 19. Of the injectable cocktails, urethane based anesthetics have the least cardio-depressive effects 4,19. Take care to limit exposure of personnel to urethane as it is a suspected carcinogen 28. Isoflurane and sevoflurane are the currently available inhalant anesthetic agents. Both of these agents have cardio-depressive effects at doses sufficient for surgical manipulation. Importantly, inhaled anesthetic agents can be titrated to effect. This allows a higher analgesic dose during the surgical preparation and then a lower sedative dose for the measuring of cardiac function, thus minimizing the cardio-depressive effects of these compounds.
If the hemodynamic parameters are below the normal levels, there are several common causes. First is low blood volume, secondary to blood loss or evaporation. This complication is generally addressed with the fluid administration outlined in section 2.7. As noted in section 1.5, maintenance of core body temperature is also very important for the assessment of hemodynamic function. Thus careful monitoring is essential, a digital feedback system can be useful for maintaining core body temperature during recording. Ensuring that the anesthetic has been properly reduced during the measurement phase is also an important aspect of improving cardiac performance.
Measuring load-independent parameters of contractility is one of the primary advantages of PV loop analysis. The real-time simultaneous collection of pressure and volume data provides the unique capacity to measure the hemodynamic changes in response to varying loading conditions on the heart. This analysis allows the contractile function of the heart to be isolated from the actions of the vessels. Reductions in preload through occlusion of venous return have been used to assess load-independent measures of contractility in many animal models and man 4,7,12-16,18,29-32. In small rodents, this procedure results in a curvilinear end-systolic pressure-volume relationship 4,31,33. This likely results from the reduction in coronary perfusion that dramatically accelerates the decline in systolic function 34. In the mouse, 2 – 3 sec of gentle abdominal compression results in a rightward shift of the PV loops. This results from both an increase in afterload and preload 12. Prolonged increases in afterload result in an increase in contractile function, a phenomena called the Anrep effect 35. However the short duration of the abdominal compression used in these studies indicates that the Anrep effect does not affect cardiac function with this procedure. In other studies, acute aortic constriction in dogs was demonstrated to increase contractile function, but this was hypothesized to result from the effects of reduced systemic perfusion 36. Again the duration and severity of the disruption of aortic flow resulting from abdominal compression, as described here, is not sufficient to significantly increase contractile function secondary to hypo-perfusion of systemic tissues. Analysis of PV loops obtained by abdominal compression align well with PV loops obtained shortly after caudal vena cava occlusion. Together, these observations demonstrate that the transient abdominal compression described here does not significantly alter the contractility of the heart. Furthermore, this procedure provides an important method to assess the passive properties of the heart over a broader range of end-diastolic volumes.
The analysis of load-independent measures requires the selection of specific PV loops to be included in the analysis. It is critically important that this be done consistently across an experimental data set. Positive pressure ventilation creates a hemodynamic artifact through respiratory dependent alterations of preload to the left ventricle 37. To avoid this artifact, PV loops should be collected during short periods of apnea (3 – 4 sec). Pauses in respiration are particularly useful as they provide better control of experimental changes in loading on the heart. It is important to keep these periods of apnea short to avoid hypoventilation. The procedures described in this manuscript collect load-independent data from two distinct procedures, caudal vena cava occlusion and abdominal compression, collected at roughly the same time. The loops isolated from these two procedures should be combined and analyzed together as they both measure the function of the same heart under, roughly, the same conditions. There are several principles to consider when selecting loops for analysis. Avoid arrhythmic beats. The beat following a dropped beat is always abnormally large and premature beats are abnormally small; both will disrupt the analysis of the data. Avoid beats where the pressure is declining but volume is constant. These are common in the mouse following the occlusion of the caudal vena cava and are likely secondary to poor perfusion of the myocardium. Finally, include only data from beats directly after the change in loading; the beats during the recovery period are likely affected by alterations in sympathetic nervous activity secondary to changes in systemic blood pressure resulting from manipulation of the loading conditions of the heart.
PV loop analysis provides an extremely detailed assessment of cardiac function. When applied in conjunction with the genetic flexibility and low housing costs of the mouse it can provide a practical means of assessing cardiac physiology on the molecular level. There are several important limitations that must be considered when deciding to perform these assays. First, this is an invasive procedure in which mice are anesthetized, which may impact important aspects of cardiac function. Furthermore, interpretation of PV loop data requires a detailed understanding of cardiac physiology both to identify patterns within the data and potential confounding variables. Additionally, because these assays are terminal they cannot be used to assess the same mouse repeatedly. The ventricular volumes derived from PV catheters tend to be less accurate than the anatomical ventricular volumes provided by MRI. This is not surprising as PV catheters model the ventricle as a cylinder, which is clearly an estimate of the overall volume of the ventricle. The real strength is the ability to collect this volume information at a high frequency, thus allowing beat-to-beat analysis of changes in ventricular volume.
The collection and analysis of PV data from the mouse can be challenging, but the method provides information regarding cardiac function that is not available through any other methodology. This procedure provides the most complete picture of cardiac function available and its utilization in the murine model will provide an important platform for the determination of the molecular underpinnings of complex cardiac disease states such as heart failure and inherited cardiomyopathies. This manuscript provides detailed information on the most critical aspects of performing this procedure. However, like all complicated procedures, this requires practice to build the microsurgical skills that are necessary to successfully perform these experiments.
Declarações
The authors have nothing to disclose.
Acknowledgements
The author would like to acknowledge funding from NHLBI (K08 HL102066 and R01 HL114832).
Materials
| Dumont 5/45 (2) | Fine Science Tools | 11251-33 | |
| Vessel Dilating Forceps | Fine Science Tools | 18153-11 | |
| Castroviejo Micro Dissecting Spring Scissor | Roboz Instruments | RS-5668 | |
| Octogon Forceps – Serrated/Curved | Fine Science Tools | 11041-08 | |
| Octogon Forceps – Serrated/Straight | Fine Science Tools | 11040-08 | |
| Dissector Scissors- Heavy Blade | Fine Science Tools | 14082-09 | |
| Transpore Surgical Tape | 3M | 1527-1 | |
| 3-0 Silk Suture | Fine Science Tools | 18020-30 | |
| TOPO Ventilator | Kent Scientific | TOPO | |
| Martin ME 102 Electrosurgical Unit | Harvard Apparatus | PY2 72-2484 | |
| Syringe Pump | Lucca Technologies | GenieTouch | |
| Stereomicroscope with boom stand | Nikon | SMZ-800N | |
| Thermocouple Thermometer | Cole Parmer | EW-91100-40 | |
| T/Pump Warm Water Recirculator | Kent Scientific | TP-700 | |
| ADVantage Pressure-Volume System | Transonic | ADV500 | |
| Data Acquision and Analysis | DSI | Ponemah ACQ-16 |
Referências
- Mozaffarian, D., et al. Heart disease and stroke statistics–2015 update: a report from the American Heart Association. Circulation. 131 (4), e29-e322 (2015).
- Katz, A. M. Influence of altered inotropy and lusitropy on ventricular pressure-volume loops. J Am Coll Cardiol. 11 (2), 438-445 (1988).
- Kass, D. A., Maughan, W. L. From "Emax" to pressure-volume relations: a broader view. Circulation. 77 (6), 1203-1212 (1988).
- Georgakopoulos, D., et al. In vivo murine left ventricular pressure-volume relations by miniaturized conductance micromanometry. Am J Physiol Heart Circ Physiol. 274 (4 Pt 2), H1416-H1422 (1998).
- Kass, D. A., Hare, J. M., Georgakopoulos, D. Murine cardiac function: a cautionary tail. Circ Res. 82 (4), 519-522 (1998).
- Feldman, M. D., et al. Validation of a mouse conductance system to determine LV volume: comparison to echocardiography and crystals. Am J Physiol Heart Circ Physiol. 279 (4), H1698-H1707 (2000).
- Baan, J., et al. Continuous measurement of left ventricular volume in animals and humans by conductance catheter. Circulation. 70 (5), 812-823 (1984).
- Salo, R. W., Wallner, T. G., Pederson, B. D. Measurement of ventricular volume by intracardiac impedance: theoretical and empirical approaches. IEEE Trans Biomed Eng. 33 (2), 189-195 (1986).
- Wei, C. L., et al. Volume catheter parallel conductance varies between end-systole and end-diastole. IEEE Trans Biomed Eng. 54 (8), 1480-1489 (2007).
- Kutty, S., et al. Validation of admittance computed left ventricular volumes against real-time three-dimensional echocardiography in the porcine heart. Exp Physiol. 98 (6), 1092-1101 (2013).
- Kottam, A., Dubois, J., McElligott, A., Henderson, K. K. Novel approach to admittance to volume conversion for ventricular volume measurement. Conf Proc IEEE Eng Med Biol Soc. , 2514-2517 (2011).
- Meyers, T. A., Townsend, D. Early right ventricular fibrosis and reduction in biventricular cardiac reserve in the dystrophin-deficient mdx heart. Am J Physiol Heart Circ Physiol. 308 (4), H303-H315 (2015).
- Townsend, D., Yasuda, S., Li, S., Chamberlain, J. S., Metzger, J. M. Emergent dilated cardiomyopathy caused by targeted repair of dystrophic skeletal muscle. Mol Ther. 16 (5), 832-835 (2008).
- Townsend, D., et al. Systemic administration of micro-dystrophin restores cardiac geometry and prevents dobutamine-induced cardiac pump failure. Mol Ther. 15 (6), 1086-1092 (2007).
- Strakova, J., et al. Dystrobrevin increases dystrophin’s binding to the dystrophin-glycoprotein complex and provides protection during cardiac stress. J Mol Cell Cardiol. 76, 106-115 (2014).
- Yasuda, S., et al. Dystrophic heart failure blocked by membrane sealant poloxamer. Nature. 436 (7053), 1025-1029 (2005).
- Townsend, D., Daly, M., Chamberlain, J. S., Metzger, J. M. Age-dependent dystrophin loss and genetic reconstitution establish a molecular link between dystrophin and heart performance during aging. Mol Ther. 19 (10), 1821-1825 (2011).
- Townsend, D., Yasuda, S., McNally, E., Metzger, J. M. Distinct pathophysiological mechanisms of cardiomyopathy in hearts lacking dystrophin or the sarcoglycan complex. FASEB J. 25 (9), 3106-3114 (2011).
- Pacher, P., Nagayama, T., Mukhopadhyay, P., Bátkai, S., Kass, D. A. Measurement of cardiac function using pressure-volume conductance catheter technique in mice and rats. Nat Protoc. 3 (9), 1422-1434 (2008).
- Zhang, B., Davis, J. P., Ziolo, M. T. Cardiac Catheterization in Mice to Measure the Pressure Volume Relationship: Investigating the Bowditch Effect. J Vis Exp. (100), e52618-e52618 (2015).
- Barnabei, M. S., Palpant, N. J., Metzger, J. M. Influence of genetic background on ex vivo and in vivo cardiac function in several commonly used inbred mouse strains. Physiol Genomics. 42A (2), 103-113 (2010).
- Guo, X., Kono, Y., Mattrey, R., Kassab, G. S. Morphometry and strain distribution of the C57BL/6 mouse aorta. Am J Physiol Heart Circ Physiol. 283 (5), H1829-H1837 (2002).
- Weiss, R. M., Ohashi, M., Miller, J. D., Young, S. G., Heistad, D. D. Calcific aortic valve stenosis in old hypercholesterolemic mice. Circulation. 114 (19), 2065-2069 (2006).
- Palpant, N. J., Day, S. M., Herron, T. J., Converso, K. L., Metzger, J. M. Single histidine-substituted cardiac troponin I confers protection from age-related systolic and diastolic dysfunction. Cardiovasc Res. 80 (2), 209-218 (2008).
- Palpant, N. J., D’Alecy, L. G., Metzger, J. M. Single histidine button in cardiac troponin I sustains heart performance in response to severe hypercapnic respiratory acidosis in vivo. FASEB J. 23 (5), 1529-1540 (2009).
- Palpant, N. J., et al. Cardiac disease in mucopolysaccharidosis type I attributed to catecholaminergic and hemodynamic deficiencies. Am J Physiol Heart Circ Physiol. 300 (1), H356-H365 (2011).
- Townsend, D. Diastolic dysfunction precedes hypoxia-induced mortality in dystrophic mice. Physiol Rep. 3 (8), e12513 (2015).
- Schmähl, D., Port, R., Wahrendorf, J. A dose-response study on urethane carcinogenesis in rats and mice. Int J Cancer. 19 (1), 77-80 (1977).
- Freeman, G. L., Little, W. C., O’Rourke, R. A. The effect of vasoactive agents on the left ventricular end-systolic pressure-volume relation in closed-chest dogs. Circulation. 74 (5), 1107-1113 (1986).
- Reyes, M., et al. Enhancement of contractility with sustained afterload in the intact murine heart: blunting of length-dependent activation. Circulation. 107 (23), 2962-2968 (2003).
- Segers, P., et al. Conductance catheter-based assessment of arterial input impedance, arterial function, and ventricular-vascular interaction in mice. Am J Physiol Heart Circ Physiol. 288 (3), H1157-H1164 (2005).
- Townsend, D., et al. Chronic administration of membrane sealant prevents severe cardiac injury and ventricular dilatation in dystrophic dogs. J Clin Invest. 120 (4), 1140-1150 (2010).
- Sato, T., Shishido, T., et al. ESPVR of in situ rat left ventricle shows contractility-dependent curvilinearity. Am J Physiol Heart Circ Physiol. 274 (5 Pt 2), H1429-H1434 (1998).
- Sunagawa, K., et al. Effects of coronary arterial pressure on left ventricular end-systolic pressure-volume relation of isolated canine heart. Circ Res. 50 (5), 727-734 (1982).
- Cingolani, H. E., Pérez, N. G., Cingolani, O. H., Ennis, I. L. The Anrep effect: 100 years later. Am J Physiol Heart Circ Physiol. 304 (2), H175-H182 (2013).
- Baan, J., van der Velde, E. T. Sensitivity of left ventricular end-systolic pressure-volume relation to type of loading intervention in dogs. Circ Res. 62 (6), 1247-1258 (1988).
- Rankin, J. S., Olsen, C. O., et al. The effects of airway pressure on cardiac function in intact dogs. Circulation. 66 (1), 108-120 (1982).
