Here, we describe a rapid and flexible protocol for the formation of 3D cell spheroids through cell aggregation. This is easily adapted to multiple cell types and is suitable for use in a variety of applications including cell migration, invasion, or anoikis assays, and for imaging and quantifying cell-matrix interactions.
Monolayer cell culture does not adequately model the in vivo behavior of tissues, which involves complex cell-cell and cell-matrix interactions. Three-dimensional (3D) cell culture techniques are a recent innovation developed to address the shortcomings of adherent cell culture. While several techniques for generating tissue analogues in vitro have been developed, these methods are frequently complex, expensive to establish, require specialized equipment, and are generally limited by compatibility with only certain cell types. Here, we describe a rapid and flexible protocol for aggregating cells into multicellular 3D spheroids of consistent size that is compatible with growth of a variety of tumor and normal cell lines. We utilize varying concentrations of serum and methyl cellulose (MC) to promote anchorage-independent spheroid generation and prevent the formation of cell monolayers in a highly reproducible manner. Optimal conditions for individual cell lines can be achieved by adjusting MC or serum concentrations in the spheroid formation medium. The 3D spheroids generated can be collected for use in a wide range of applications, including cell signaling or gene expression studies, candidate drug screening, or in the study of cellular processes such as tumor cell invasion and migration. The protocol is also readily adapted to generate clonal spheroids from single cells, and can be adapted to assess anchorage-independent growth and anoikis-resistance. Overall, our protocol provides an easily modifiable method for generating and utilizing 3D cell spheroids in order to recapitulate the 3D microenvironment of tissues and model the in vivo growth of normal and tumor cells.
Biologically relevant assessment of tumor cell behavior is challenging using traditional two-dimensional (2D) cell culture methodologies, in part because these do not adequately reflect the cell microenvironment found in vivo. Alternative approaches incorporating extracellular matrix components into the culture (e.g., Boyden chamber assays) are more physiologically representative of the in vivo tissue environment. However, they can be limited to assessment of individual cell behavior, and do not recapitulate the complex in vivo combinations of cell-matrix and cell-cell interactions that contribute to tissue or tumor growth1,2,3.
The use of multicellular spheroids is a recent approach that more accurately reproduces the compact architecture of in vivo cell growth1,4. Spheroids can be used to investigate cell-matrix interactions of normal cells, but can also act as tumor analogues to model characteristics of tumor progression, such as metastatic growth or drug resistance4.
Spheroids may be formed by the proliferation of single cells embedded in a matrix5, or more rapidly, by promoting the aggregation of multiple cells to form a single cell cluster (e.g., hanging drop, centrifugation methods)6,7. Existing cell aggregation techniques may require costly materials or specialized equipment. In addition, these spheroids have a wide range of sizes and morphologies and may be difficult to produce in large quantities, making comparisons between growth conditions or treatments difficult. Finally, spheroids generated by these methods can be difficult to isolate from the proteinaceous extracellular matrix in which they are embedded for use in other applications.
Here, we describe a robust and easily modifiable cell aggregation methodology for the rapid formation of consistently sized cell spheroids using commercially available U-bottom cell-repellent plates and an inert adhesion-promoting matrix, methyl cellulose. Once formed, these multicellular spheroids are readily isolated for use in a wide range of applications. The protocol is also easily adapted to generate spheroids through cell proliferation, which may be used to assess other cell processes. Here, we show cell invasion assays, quantified by immunofluorescence staining, and an anoikis assay, as example applications of these two different spheroid formation protocols.
NOTE: All reagents and consumables are listed in the Materials List.
1. Spheroid Production by Cell Aggregation
2. Spheroid Invasion Assay (Figure 4)
3. Quantification of Invasion: Brightfield Microscopy
4. Quantification of Invasion: Fluorescence Microscopy with Live Cell Stain
5. Quantification of Invasion: Immunofluorescence
NOTE: All solutions and buffers should be passed through a 0.45 µm filter before use to remove debris, which can negatively affect staining.
6. Anoikis Assay
NOTE: The spheroid formation protocol is easily adapted to quantify anchorage-independent growth and anoikis resistance in a variety of cell types.
We describe a flexible and efficient method to generate discrete spheroids using cell-repellent plates and spheroid formation media supplemented with MC. Under the appropriate conditions of MC and serum, individual cells settle and adhere together at the center of the well to form spheroids with minimal adherence to the well bottom. Using this protocol, spheroids were generated from a variety of cell lines (Figure 2B). Titration of MC and serum concentrations is required for each cell line to identify optimal conditions where only a single spheroid is formed that is robust enough to allow manipulation without fragmenting. Optimally, the spheroids were between 200 to 500 µm in diameter, and consisted of tightly adherent cells with minimal cell debris. Spheroids survived gentle handling without damage, allowing them to be collected and used in a wide variety of assays.
Spheroid formation could be compromised by bacterial or other microbial contaminants (Figure 3A), which resulted in aggregates of dead cells. In the presence of dust or other fiber contamination, multiple or irregularly shaped cell clusters that were only weakly aggregated formed, and the resultant spheroids easily broke apart when handled. Spheroid formation was also affected by suboptimal concentrations of MC or serum in the spheroid formation medium (Figure 3B). In our testing, many cell lines were able to adhere to cell-repellent plates in the absence, or at low concentrations, of MC, and resulted in the formation of a spheroid surrounded by a cell monolayer (Figure 3B-ii). BxPC-3 cell growth in suboptimal MC conditions is shown as an example. In general, higher concentrations of MC prevented cells from adhering to the well, but too high a concentration of MC reduced cell-cell adhesion, and prevented cells from settling to the bottom of the well, resulting in the formation of loose aggregates and numerous satellite spheroids (Figure 3B-i). The concentration of serum also affected cell survival, and cell-cell, and cell-plastic adhesion and needed to be optimized for different cell lines. For cell lines such as HCT-116 and PANC-1, too high a serum concentration resulted in excessive cell proliferation and production of oversized spheroids that were easily damaged by handling, or promoted cell adhesion to the plastic well and the formation of a monolayer (Figure 3B-iii). Interestingly, the effects of insufficient serum differed between cell lines. HCT-116 cell survival was reduced and the spheroids formed were small, containing a large proportion of dead cells in low serum. In contrast, PANC-1 cells were viable in the absence of serum, but became more adherent, and formed multiple aggregates as well as a cell monolayer (Figure 3B-iv, v).
In invasion assays, pre-formed spheroids were resuspended in neutralized collagen to generate a rigid extracellular matrix (Section 2.2, Figure 4). Subsequent addition of a chemoattractant induced individual cells to move outwards from the spheroid and invade into the surrounding matrix (Figure 4B). The number of invading cells and distance invaded can be quantified through brightfield microscopy, or by fluorescence microscopy in the presence of a live cell stain such as DAPI or Calcein AM (Sections 3, 4). In our testing, morphological changes, such as the formation of protrusions, were visible within 6 h of treatment with chemoattractant, and numerous cells could be observed completely detaching from the spheroid and invading into the collagen within 18 to 48 h. For our experiments, we found that 12 to 18 h of invasion was ideal, as longer incubation times resulted in cells moving too far from the spheroid for optimal imaging. Fixed collagen-embedded spheroids could be imaged by brightfield, to quantify the distance and number of cells invading, or immunofluorescence microscopy (Sections 3-5), for visualization of invasive structures formed by the cells (Figures 5B, 5C).
A modification of the described spheroid formation protocol, in which individual cells are suspended in higher concentration MC (30 mg/mL) can be used to monitor anoikis resistance. At these MC concentrations, medium can still be transferred by pipette while cool, but thickened into a solid gel at 37 °C. Anoikis-resistant cells resuspended into this medium remained in suspension and proliferated over a period of 2-4 weeks, forming suspended spheroids of varying sizes (Figure 6B). Anchorage-dependent cells do not form spheroids under these conditions. We were able to quantify anoikis-resistance by counting the number of spheroids formed in each well.
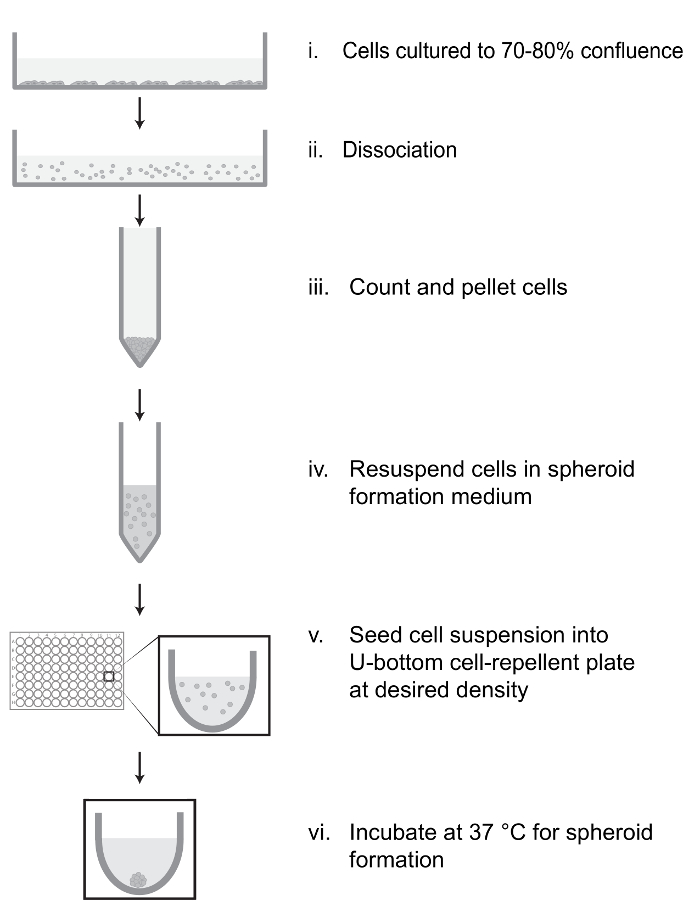
Figure 1: Overview of 3D Spheroid Formation Protocol. Cells grown in monolayer culture are dissociated, counted, pelleted, and resuspended in spheroid formation medium supplemented with methyl cellulose (MC) and serum (i-iv). The suspension is seeded into a U-bottom cell-repellent plate at desired density to allow formation of spheroids of the desired size (v), and the plate is incubated to produce a single, discrete cell spheroid in each well (vi). Please click here to view a larger version of this figure.
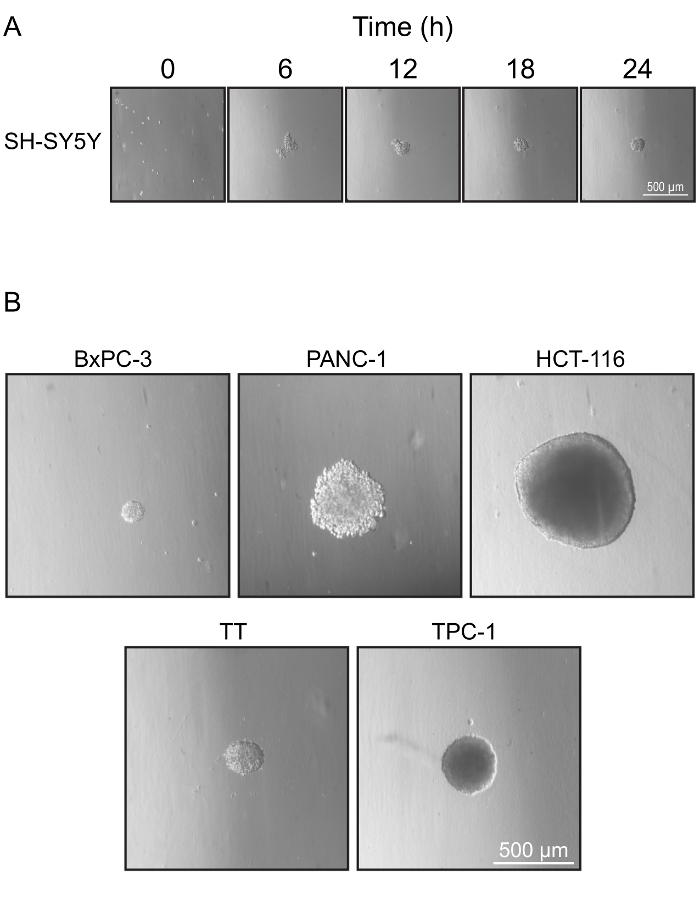
Figure 2: Optimized Spheroid Formation Conditions. (A) Spheroid formation under optimal conditions for SH-SY5Y cells. 1,000 cells seeded into U-bottom cell-repellent plates in media supplemented with 5% serum and 1 mg/mL MC aggregated into compact spheroids within 24 h. (B) Representative images of spheroids formed by various cell lines under optimal conditions shown in Table 1. Please click here to view a larger version of this figure.
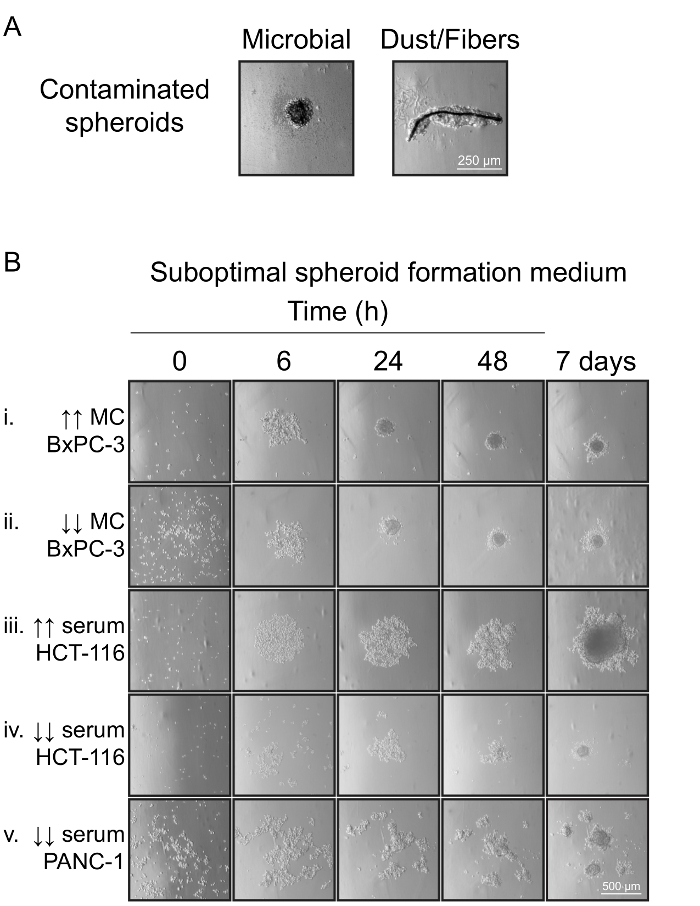
Figure 3: Spheroid Formation Under Suboptimal Conditions. (A) Spheroids formed in the presence of contaminants. Microbial contamination resulted in cell death and loosely aggregated spheroids. In the presence of insoluble contaminants, such as dust or fibers, cells adhered to these materials and did not aggregate. (B) Spheroid formation in suboptimal spheroid formation medium. BxPC-3 cells seeded in the presence of excess MC (10 mg/mL) formed numerous satellite spheroids (i), while insufficient MC (0 mg/mL) resulted in cell aggregates that adhered to the well bottom and formed a monolayer (ii). Similar results were observed for other tested cell lines (not shown). Excess serum (20%) resulted in increased HCT-116 cell proliferation and monolayer formation (iii). Insufficient serum (0%) had cell line-specific effects ranging from cell death in HCT-116 (iv) to the formation of satellite spheroids in PANC-1 (v). Please click here to view a larger version of this figure.
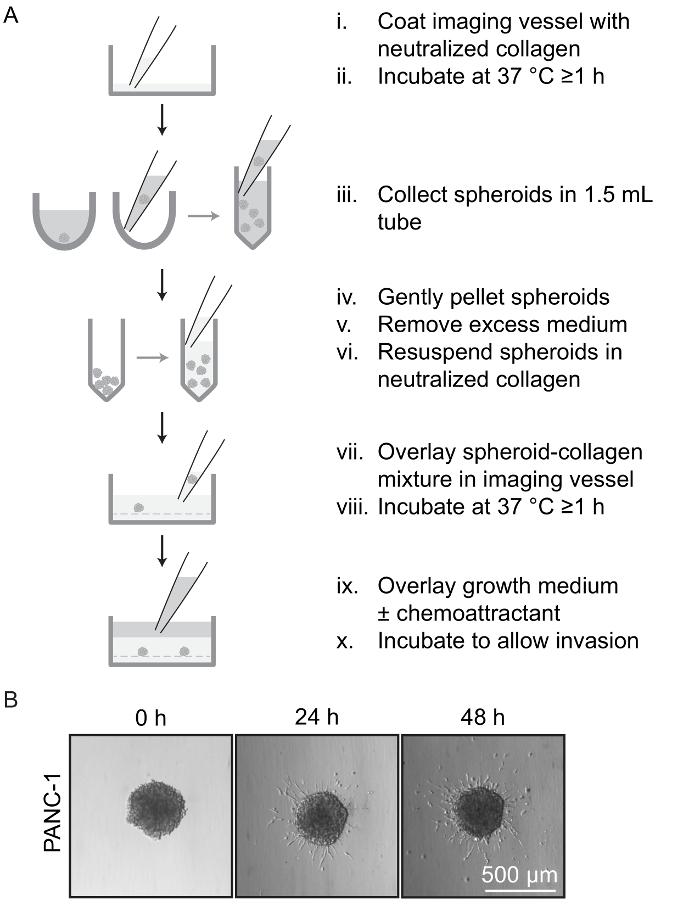
Figure 4: Invasion Assay Using Spheroids. (A) Overview of spheroid invasion assay. The imaging vessel is pre-coated with a layer of neutralized collagen and incubated to polymerize the collagen (i-ii). Pre-formed spheroids are collected in 1.5 mL tubes and resuspended in neutralized collagen (iii-vi). The spheroid-collagen mixture is overlaid on the collagen base-layer and incubated to polymerize the collagen (vii-viii). Growth medium containing desired compounds is then overlaid onto the polymerized spheroid-collagen layer and incubated to allow cell invasion (ix-x). (B) In the presence of a chemoattractant, cells are shown invading into the surrounding collagen matrix from an embedded PANC-1 spheroid at the indicated time points. Each panel shows a phase contrast image acquired using a 10X objective. Please click here to view a larger version of this figure.
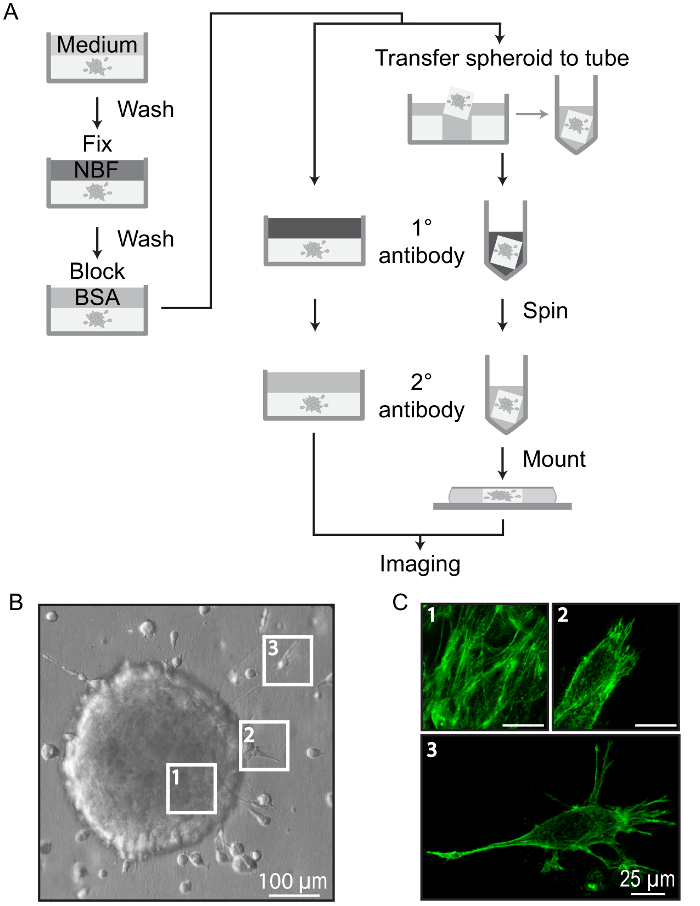
Figure 5: Immunofluorescence Staining of Collagen-embedded Spheroids. (A) Overview of protocol for immunofluorescence staining of spheroids. Embedded spheroids are washed, fixed (NBF), and blocked (BSA) directly in the imaging vessel. Spheroids can be stained directly, or excised and stained in a smaller volume, such as a 1.5 mL tube. Spheroids should be washed with excess buffer following each stain to minimize background fluorescence. Stained spheroids can be imaged directly in the vessel or mounted under a coverslip for imaging and storage. (B) Immunofluorescence images of a TPC-1 cell spheroid embedded in collagen and allowed to invade for 24 h. (C) Images showing phalloidin stained cells typical of regions indicated in B. Each panel shows a 20 µm Z-projection (0.2 µm steps) acquired using a 60X objective: Cells within the spheroid body approximately 20 µm from the surface (1), cells protruding into collagen (2), and cells invading through collagen (3). Scale bars = 25 µm. Please click here to view a larger version of this figure.
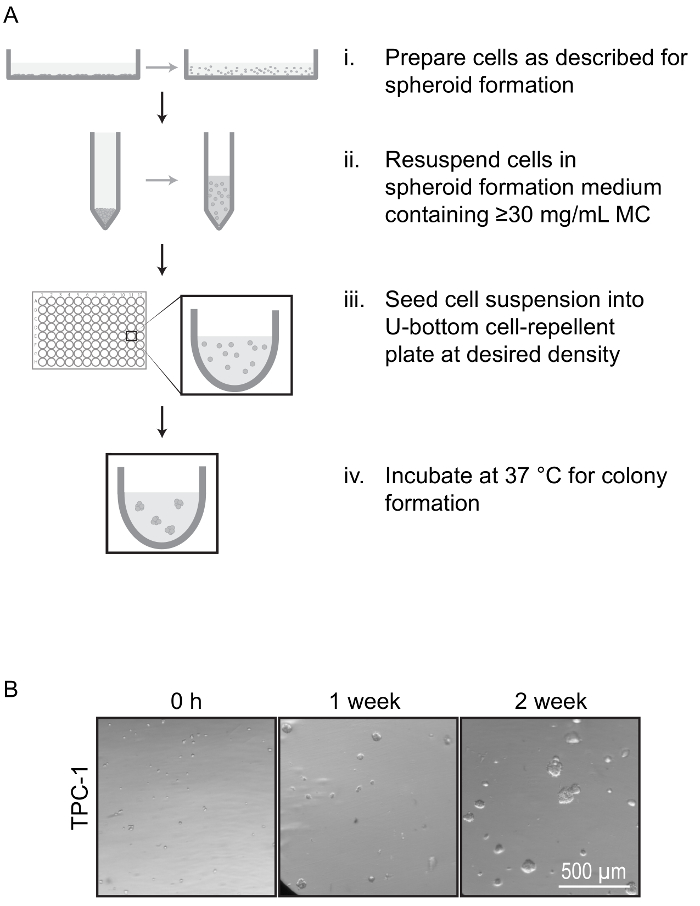
Figure 6: Spheroid Formation Anoikis Assay. (A) Overview of protocol for anoikis assay. Cells are prepared as described in Figure 1, but are resuspended in spheroid formation medium containing a minimum of 30 mg/mL MC which forms a thick layer to hold individual cells in suspension and prevent cell aggregation (i-ii). The cell suspension is seeded into U-bottom cell-repellent plates and incubated (iii-iv). The suspended cells can be monitored for spheroid formation by proliferation, indicating anoikis resistance. (B) Representative images of colony formation during anoikis assay. TPC-1 cells were held in suspension with 30 mg/mL MC and imaged at the indicated time points. Cells that are able to resist anoikis proliferate to form spheroids. Please click here to view a larger version of this figure.
Cell Line | MC (mg/mL) | Serum (%) | Approximate incubation time |
SH-SY5Y | 1 | 5 | 24 hours |
BxPC-3 | 5 | 5 | 3 to 5 days |
PANC-1 | 5 | 5 | 5 to 7 days |
HCT-116 | 3 | 10 | 2 to 4 days |
TT | 1 | 10 | 7 to 10 days |
TPC-1 | 3 | 5 | 1 to 2 days |
Table 1: Optimal Spheroid Formation Medium Composition and Incubation Times for Validated Cell Lines.
We present a rapid and flexible method for producing 3D cell spheroids to model the architecture of in vivo tissues using inexpensive and widely available reagents. Our protocol exploits the non-cytotoxic and adhesion-promoting properties of MC8,9 to mediate cell aggregation and minimize cell monolayer formation. Unlike protein-based matrices isolated from animal sources, MC is inert, contains no growth factors, and is easily removed by washing, allowing isolation of spheroids for use in a variety of applications without the presence of residual matrix. Our protocol uses rapid aggregation of consistent cell numbers to generate homogenously sized spheroids, allowing direct comparisons of spheroids grown under various experimental conditions. This method can be adapted for mixed cultures to model in vivo tumor growth by combining fixed numbers of multiple tumor-associated cell types (e.g. fibroblasts, leukocytes, stromal cells) to more accurately represent the tumor environment.
Modifications of our protocol using cells seeded in high concentrations of MC can be made to monitor anchorage-independent growth of cells able to proliferate in suspension, and may be employed as an anoikis assay (Section 6) to identify or quantify cell transformation. Spheroids generated by our protocol are ideal for applications such as drug screening, allowing comparison of cell growth, metabolism, survival, and invasiveness between treatment conditions. Isolated spheroids may also be embedded into an extracellular matrix, such as collagen, to assess and quantify cell invasiveness in a 3D-microenvironment (Section 2.2, Figure 4) that more accurately models in vivo tumor growth. Further, our protocol can be used to isolate large quantities of spheroids from the MC matrix for protein or RNA preparation, allowing users to evaluate cell signal or gene expression changes in response to treatment or growth conditions.
Our spheroid formation protocol requires optimization of serum and MC concentrations, and the number of cells seeded for each cell line. Cell line-specific characteristics, such as cell viability, cell-cell and cell-plastic adhesiveness, can significantly affect the ease with which spheroids are formed. In general, cell lines with poor viability in monolayer culture required higher serum concentrations to promote spheroid formation, while higher MC concentrations were preferred for highly adhesive cell lines. We therefore recommend that titrations of serum and MC be performed to determine the optimal conditions for cell survival (serum concentration), while minimizing monolayer and satellite spheroid formation (MC concentration). These conditions should result in generation of a single discrete spheroid per well without satellites. Optimal spheroid size for analysis is application-dependent and is affected by the number of cells seeded and serum concentration (Step 1.4.7). Seeding fewer cells produces smaller aggregates that are more easily homogeneously stained, but may not reproduce in vivo cell-cell and cell-microenvironment interactions. Increasing the number of cells seeded generates larger spheroids, which may contain a physiologically representative hypoxic core10 that can affect cell behavior and alter interpretations of growth or survival assays. However, when too large, spheroids may be fragile and are easily broken apart or damaged during isolation. Larger spheroids are also much harder to visualize without specialized imaging platforms for optical sectioning (e.g. light sheet fluorescent microscope) or by embedding or cryosectioning and staining of cross sections through the spheroid11. We recommend a target spheroid size of 200-500 µm for flexibility and ease of handling for most applications. Overall, it is critical to optimize the conditions for spheroid formation in both a cell line-specific and application-specific manner.
Spheroid production protocols require particular attention to avoid contamination of spheroids by dust and other particulates. Cells adhere to dust and other insoluble contaminants, resulting in irregularly shaped, loosely adherent cell aggregates unsuitable for use in analyses (Figure 3A). Sources of contamination can be minimized by passing all solutions through a 0.45 µm filter, rinsing the cell monolayer with filtered medium prior to dissociation (Step 1.4.1), and rinsing multichannel pipette reservoirs with filtered ultrapure water immediately before use (Step 1.4.6.1). Further, cotton-filtered serological pipettes, which can shed fibers into solutions, should be avoided. Although not critical, dust can be further reduced by passing dissociated cells through a 100 µm cell strainer prior to seeding (Step 1.4.6). Evaporative loss of medium is an additional technical consideration, particularly for incubation times exceeding 1 week, such as those required by certain cell lines for spheroid formation (Table 1) or during anoikis assays (Section 6). Evaporation can be minimized by seeding cells in wells in the center region of multi-well plates, filling perimeter wells with ultrapure water, and loosely sealing the edges of the plate or enclosing the plate in a humidified chamber.
3D cell spheroids are a valuable model for the study of both normal and tumor cell behavior and physiology. Our protocol is a rapid and economical method for generation of consistently sized 3D cell spheroids that can be used in an assortment of assays and applications. These spheroids represent valuable tools for characterization of tumor growth and microenvironment interactions as well as models for preclinical evaluation of novel therapies.
The authors have nothing to disclose.
The authors thank M. Gordon of the Queen’s University Biomedical Imaging Centre for assistance. This work was supported by operating grants from the Cancer Research Society of Canada (19439) and the Canadian Institutes for Health Research (MOP-142303) (LMM), and by Ontario Graduate Scholarships and studentships from the Terry Fox Research Institute Training Program in Transdisciplinary Cancer Research (SMM, EYL), and by a Craig Jury Summer Studentship (SMM).
Buffers | |||
10x Phosphate buffered saline | Thermo Fisher Scientific | AM9625 | |
Calcium Chloride Solution | Sigma-Aldrich | 21114 | Used for PBS* wash buffer; Do not autoclave PBS* wash buffer upon addition of calcium chloride |
Magnesium Chloride Solution | Sigma-Aldrich | M1028 | Used for PBS* wash buffer; Do not autoclave PBS* wash buffer upon addition of magnesium chloride |
Name | Company | Catalog number | Comments |
For Spheroid Formation | |||
96-well U-bottom Cell-Repellent Plate | Greiner Bio-One | 650970 | |
Dulbecco's Modified Eagle's Medium | Sigma-Aldrich | D5546 | For culturing SH-SY5Y, PANC-1, TPC-1 cell lines |
F12K Medium | Thermo Fisher Scientific | 2112722 | For culturing TT cell line |
Fetal Bovine Serum | Sigma-Aldrich | F1051 | Filter prior to use to remove particulate contaminants |
Methyl cellulose | Sigma-Aldrich | M7027 | Prepare in water to 100 mg/mL |
Roswell Park Memorial Institute Medium | Sigma-Aldrich | R8758 | For culturing HCT-116, BxPC-3 cell lines |
TrypLE Express | Thermo Fisher Scientific | 12605028 | Dissociation buffer |
Name | Company | Catalog number | Comments |
For Invasion Assay | |||
Bovine Type I Collagen | Corning Incorporated | 354231 | Stock 3.1mg/ml; Maintain on ice when in use |
DMEM Phenol Red Free Low Glucose | Thermo Fisher Scientific | 11054-20 | Less background fluorescence compared to Phenol Red supplemented medium |
Glial Cell Line Derived Neurotrophic Factor | Peprotech | 450-10 | Chemoattractant |
Name | Company | Catalog number | Comments |
For Immunofluorescence Microscopy | |||
#1.5 Coverglass | Electron Microscopy Sciences | 72225-01 | For mounting excised spheroids |
Alexa-Fluor 488 Phalloidin | Thermo Fisher Scientific | A12379 | Used to stain actin at 1:200 |
Bovine Serum Albumin | Bioshop Canada Incorporated | ALB001 | Used in BSA blocking buffer |
Dabco 33-LV | Sigma-Aldrich | 290734 | Antifade |
Glycerol | Bioshop Canada Incorporated | GLY001 | Used in MOWIOL mounting medium |
ImageJ Software | Freeware, NIH | – | Used for image analysis |
Microslides | VWR International | 48312-024 | For mounting excised spheroids |
MOWIOL 4-88 | EMD-Millipore | 475904 | Used in MOWIOL mounting medium |
Paraformaldehyde | EMD-Millipore | PX0055-3 | Used in fixation buffer |
Triton X-100 | Bioshop Canada Incorporated | TRX777 | Used in permeabilization buffer |