Science Education
>

Assessing Stem Cell DNA Integrity for Cardiac Cell Therapy

PREPARAÇÃO DO INSTRUTOR
CONCEITOS
PROTOCOLO DO ALUNO
JoVE Journal
Genética
É necessária uma assinatura da JoVE para visualizar este conteúdo.  Faça login ou comece sua avaliação gratuita.
JoVE Journal Genética
Assessing Stem Cell DNA Integrity for Cardiac Cell Therapy

1. Comet Assay

  1. Reagent preparation
    1. For low-melting-point agarose, place 500 mg of low-melting agarose in 100 mL of DNA-/RNA-free water. Heat the bottle in a microwave oven until the agarose dissolves. Place the bottle in a 37 °C water bath until needed.
      NOTE: For further reading, see Azqueta et al., who studied the effects of agarose concentration on the DNA-unwinding time and several electrophoresis factors23.
    2. Dilute SYBR green DNA dye in Tris-EDTA (TE) Buffer at a 1:10,000 ratio to obtain a 1x working stock dye solution. This dye is light-sensitive, so store it in a dark place.
    3. For the cell lysis buffer, dissolve 100 mL of lysis buffer (2.5 M NaCl, 0.1 M EDTA, 10 mM Tris, 1% Triton X-100) in deionized water (DI H2O). Then, add 10 M NaOH to adjust the pH to 10.0. Cool the buffer to 4 °C.
    4. For the alkaline DNA-unwinding/electrophoresis running buffer, dissolve 1 L of alkaline solution (0.3 M NaOH, 1 mM EDTA) in DI H2O. Cool the buffer to 4 °C. Make sure the pH >13.
    5. For precoated comet slides, place a few drops of 0.5% agarose on a glass slide. Immediately, using the flat surface of another slide, spread the agarose to form a thin layer of agarose coating.
      NOTE: Dry the slides before using.
    6. For iPS cell culture, briefly culture iPS cells in basement-membrane-matrix-coated (see Table of Materials) culture plates in mTESR1 culture medium until confluency is reached.
      NOTE: Human-cardiac-fibroblast-derived iPS cells were used in this protocol. The reprogramming of iPS cell derivation and culture conditions is described in recent articles from our research group12,13,21.
  2. Sample preparation
    1. Discard the culture medium and wash the cells. Dissociate the cells using detachment solution (see Table of Materials). Wash the cell pellet with phosphate-buffered saline (PBS) and resuspend the cells in PBS at 1 x 10⁵ cells/mL.
  3. Sample slide preparation
    NOTE: Perform the following steps under low-light conditions to avoid ultraviolet-light-induced cell damage.
    1. Mix 10 μL of cell suspension and 90 μL of agarose solution (1:10 ratio) in a tube. Place the tube in a 37 °C water bath to prevent the agarose from solidifying.
    2. Mix the solutions without introducing air bubbles and pipette 70 μL/spot onto the precoated comet slide. Using a pipette tip, spread the cell agarose mixture to form a thin layer. Place the slide in 4 °C for 15 min.
    3. In a container, completely submerge the slide in cold lysis buffer. Place the container in the dark at 4 °C for 1 h.
    4. Replace the lysis buffer with cold alkaline solution. Make sure the slides are completely submerged. Place the container in the dark at 4 °C for 30 min.
  4. Electrophoresis
    1. Place the slide in a horizontal electrophoresis tank. Fill the tank with cold alkaline electrophoresis buffer until the slides are completely submerged. Apply voltage at 1 V/cm for 15 to 30 min.
      NOTE: Total voltage = distance between the electrodes x 1 V
    2. In a container, completely submerge the slide in cold DI H2O. After 2 min, remove the DI H2O and add fresh DI H2O. Repeat this step.
    3. Replace the DI H2O with cold 70% ethanol. Wait 5 min. Gently remove the slide, do not tilt it, and let it air-dry.
    4. Once dried, add 100 μL of diluted DNA dye to each spot. Wait 15 min at room temperature. Using a FITC filter in an epifluorescence microscope, take images of 50 to 100 comets in total per sample.
  5. Image analysis and calculation of the results
    1. For scoring the comets, use the National Institutes of Health’s (NIH) ImageJ with comet assay plugin (download ImageJ here: https://imagej.nih.gov/ij/download.html; download the plugin here: https://www.med.unc.edu/microscopy/resources/imagej-plugins-and-macros/comet-assay/).
      NOTE: The plugin comes with a PDF instruction which contains all details to perform the analysis. Additionally, screenshots of the comet analysis are shown in Figure 2A-C. Representative comet images of control and doxorubicin (Doxo)-treated iPS cells and the quantification of the comets are shown in Figure 3A-C.

2. DNA Damage Response

  1. Sample and reagent preparation
    1. For an iPS-CM cell culture, culture iPS-CM cells in basement-membrane-matrix-coated (see Table of Materials) culture plates in RPMI medium supplemented with B-27 (CMM) until confluency is reached.
      NOTE: Human-iPS-cell-derived cardiomyocytes were used in this protocol. The protocol for iPS cell differentiation into cardiomyocytes can be found in recent articles from our research group12,13,21.
    2. Seed iPS-CMs in chamber slides.
      1. Discard the culture medium from the iPS-CM wells. Wash the cells three times with PBS.
      2. Add 1 mL of 0.25% trypsin per well and incubate at 37 °C for 5 min. Check the plate under a microscope for cell detachment. Add 1 mL of CMM to stop the trypsin.
      3. Place cell suspension in a 15 mL tube and centrifuge for 5 min at 4 °C and 200 x g. Discard the medium, add 1 mL of CMM, and resuspend the cells. Count the cells and adjust the cell count to obtain 20 x 105 cells in 1.6 mL of CMM.
      4. Seed 200 µL of cell suspension per well of the 8-well chamber slide (see Table of Materials). Tap the slide gently to spread the cells around the well and incubate at 37 °C.
    3. For the iPS-CM doxorubicin treatment, discard the culture medium from the iPS-CM wells. Wash the cells with PBS. Treat the cells with 1 μM doxorubicin and CMM for 4 h. Aspirate the medium and wash the cells with PBS.
    4. For the blocking buffer, prepare 10 mL of bovine serum albumin (BSA) solution containing 3% BSA and 0.05% Triton X-100. To prepare 10 mL of blocking buffer, add 1 mL of normal donkey serum to 9 mL of prepared BSA solution.
    5. For the primary antibody solution, add 1 μL of anti-rabbit phospho-histone H2A.X (Ser139) antibody to 200 μL of blocking buffer.
    6. For the secondary antibody mix, add 1 μL each of fluorochrome-conjugated anti-rabbit secondary antibody, DAPI, and fluorochrome-conjugated phalloidin to 200 μL of blocking buffer.
  2. Immunolabeling
    1. Wash the cells three times with PBS and add 200 μL of freshly prepared 4% paraformaldehyde (PFA) to each well. Fix the cells for 20 min in the dark at room temperature. Wash the cells with PBS.
    2. Remove the PBS and add 200 μL of blocking buffer per well and block for 30 min in a humidified chamber at room temperature. Remove the blocking buffer and add 200 μL of primary antibody solution. Incubate for 45 min in a dark, humidified chamber at room temperature. Then, wash the wells three times with PBS.
    3. Remove the PBS and add 200 μL of secondary antibody mix. Incubate for 45 min in a dark, humidified chamber at room temperature. Then, wash the wells three times with PBS. Wash with DI H2O before mounting them with antifade. Place a coverglass and store the slides in the dark at 4 °C.
    4. Using an epifluorescence microscope, take three to five images of random fields per sample, as shown in Figure 4A, and proceed to image analysis.
  3. Counting of the DDR foci
    1. Download and install CellProfiler24 (http://cellprofiler.org).
    2. NOTE: Image processing in this study was performed using CellProfiler version 2.1.1. Tutorials for CellProfiler that were used can be found elsewhere (https://www.youtube.com/watch?v=PvhRL9xpduk&list=PL7CC87670239B4D10). If a newer version of CellProfiler is being used, the pipeline might require minor adaptations.
    3. Download the pipeline punctae_gH2AX.cpipe. Select File > Import > Pipeline from the file and choose punctae_gH2AX.cpipe.
    4. Drag-and-drop the folder containing the acquired images of γH2A.X foci to the File list window in the Input modules/Images section for analysis (Figure 5A). Then, follow the instructions as shown in Figure 5A-L.
    5. Set the following parameters for the images:
      1. Drag the desired image for analysis onto the File list. Under Input modules, select Images (see Figure 5A for module settings). In Input modules, select Metadata (see Figure 5B for module settings). In Input modules, select NamesAndTypes (see Figure 5C for module settings).
      2. For Groups, select no. In Analysis modules, select ColorToGray (see Figure 5D for module settings).
    6. In Analysis modules, select Smooth (see Figure 5E for module settings).
      NOTE: This value may need to be optimized, depending on the image resolution.
    7. In Analysis modules, select IdentifyPrimaryObjects (see Figure 5F for module settings).
      NOTE: Optimize these values to make sure the whole nucleus is selected. After this step, the computer may lag.
    8. In Analysis modules, select Smooth (see Figure 5G for module settings).
      NOTE: This value may need to be optimized, depending on the image resolution.
    9. In Analysis modules, select EnhanceOrSuppressFeatures (see Figure 5H for module settings).
    10. In Analysis modules, select IdentifyPrimaryObjects (see Figure 5I for module settings).
      NOTE: Optimize these values to make sure the punctae are selected. After this step, the computer may lag again.
      1. In Analysis modules, select RelateObjects (see Figure 5J for module settings). In Analysis modules, select ClassifyObjects (see Figure 5K for module settings). In Analysis modules, select ExportToSpreadsheet (see Figure 5L for module settings).
      2. Click Analyze Images at the bottom left panel to perform image analysis. At the successful completion of the analysis, several images are generated (Figure 6A-F).
        NOTE: Users should save these images for future reference.
      3. Note the .csv file containing the quantitative data for further analysis that is generated and saved in the appropriate location on the computer. In the spreadsheet called MyExpt_Image, columns B and D will have the number of nuclei that have up to five and more punctae, respectively. Add columns B and D to get the total number of nuclei.
    11. Repeat step 2.3.3 – 2.3.8 for all images (change the MyExpt_ filename before every analysis). Plots can be made for assessing DNA integrity, as shown in Figure 4C.

Assessing Stem Cell DNA Integrity for Cardiac Cell Therapy

Learning Objectives

Human induced pluripotent stem cells were cultured, and the DNA damage and the tail moment, which were used as a measure of DNA integrity, were analyzed by comet assay. iPS cells were embedded in low-melting-point agarose and placed on a glass slide. The cells were, then, treated with lysis buffer, followed by an alkaline solution, to obtain supercoiled DNA. Nucleoids were electrophoresed and comets were visualized by DNA dye (Figure 1A-D). The comets were, then, analyzed with ImageJ, using the comet assay plugin (Figure 2A-C).

Human iPS cells were treated with Doxo to induce DNA damage and to be used as a positive control. Representative micrographs of comets from Doxo-treated and nontreated iPS cells are shown in Figure 3A. A basal amount of DNA damage was found in iPS cells, expressed as a fraction of DNA damage and tail moment. However, the Doxo treatment increased the DNA damage in iPS cells as expected (Figure 3B,C). This shows that the comet assay can be used to assess DNA integrity not only in somatic cells18,19 but also in pluripotent stem cells21.

Freshly differentiated iPS cardiomyocytes (iPS-CMs), iPS-CMs cultured for 6 months (prolonged culture [PC]), and iPS-CMs treated with Doxo were subjected to γH2A.X immunolabeling. Representative micrographs of γH2A.X immunolabelling are shown in Figure 4A (lower-magnification) and Figure 4B (higher-magnification). The number of γH2A.X foci (DDR foci) (punctae) in each nucleus are quantified, using CellProfiler with custom pipeline modules (Figure 5A-L). The percentage of cells that are positive for γH2A.X are classified into nuclei with zero to five punctae and nuclei with more than 10 punctae. In the control iPS-CM, more than 90% of the cells had less than five DDR foci per nuclei, and a total of less than 10% of the cells had more than six DDR foci per nuclei (Figure 4C, control [Ctrl]). iPS-CMs cultured for 6 months had less than 90% cells with less than five DDR foci per nuclei, and a total of more than 13% of the cells had more than six DDR foci per nuclei (Figure 4C, PC), whereas the Doxo-treated iPS-CM showed less than 80% of the cells with less than five DDR foci per nuclei, and a total of about 24% of the cells had more than six DDR foci per nuclei (Figure 4C, Doxo). This data clearly shows that prolonged cell culture and Doxo treatment induce significant DNA damage in iPS-CMs and are not suitable for cell transplantation.

Figure 1
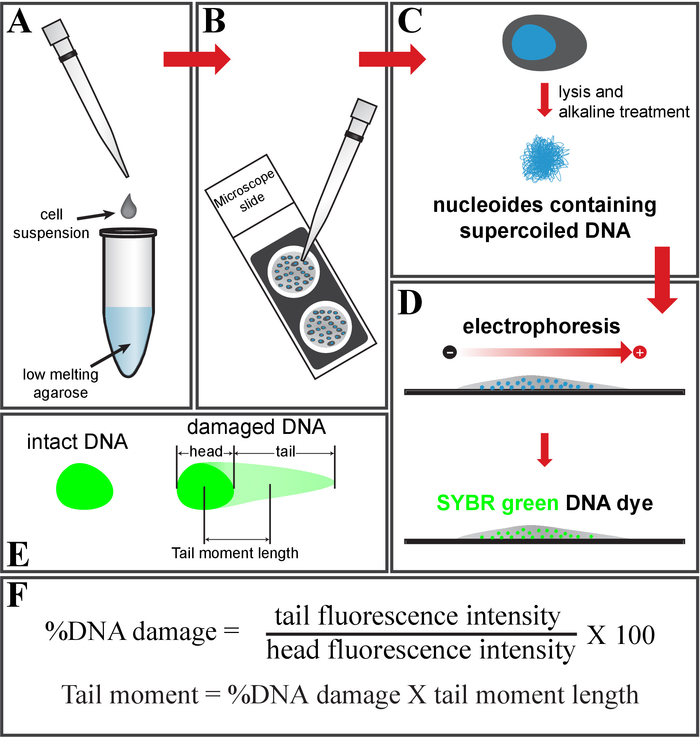
Figure 1: Schematic of the comet assay. (A) Mix the cell suspension with low-melting-point agarose and (B) place it on a glass slide. (C) Treat it with cell lysis buffer, followed by an alkaline solution, to get nucleoids containing supercoiled DNA. (D) Electrophorese and stain the DNA using SYBR green DNA dye. (E) Schematic of intact (left) and damaged DNA (right, comet shape). (F) Formula to calculate a fraction of the DNA damage and tail moment. Please click here to view a larger version of this figure.

Figure 2
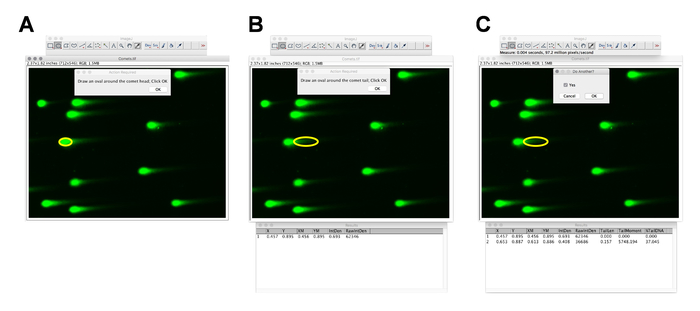
Figure 2: DNA damage and tail moment quantification by ImageJ. (AC) Screenshots of ImageJ, with the comet analysis plugin showing a selection of the comet head and tail. Please click here to view a larger version of this figure.

Figure 3
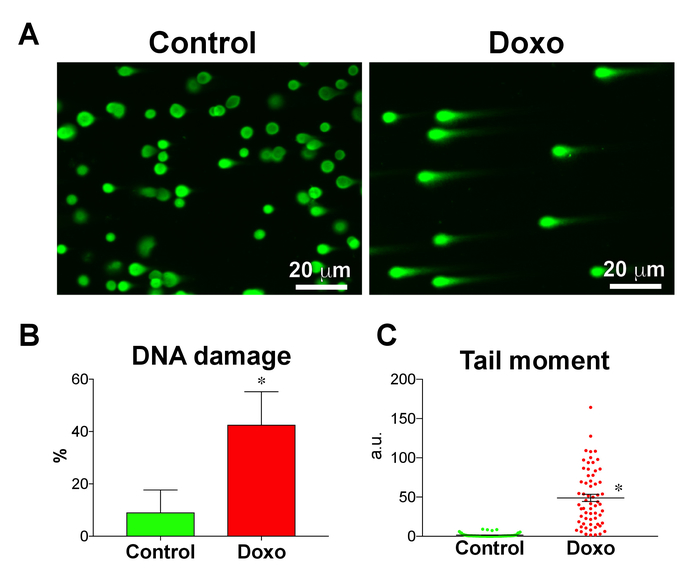
Figure 3: Doxorubicin induces DNA damage in human iPS cells. (A) DNA damage in doxorubicin-treated (Doxo) and nontreated (control) iPS cells, analyzed using the comet assay. (B) Fraction of DNA damage (n = 3) and (C) tail moment (n = 63 comets) quantified using the comet assay. Treatment with doxorubicin, a DNA-intercalating agent, significantly increased the fraction of DNA damage and tail moment in iPS cells. Data are means ± SEM. *P < 0.05, Student's unpaired t-test. Please click here to view a larger version of this figure.

Figure 4
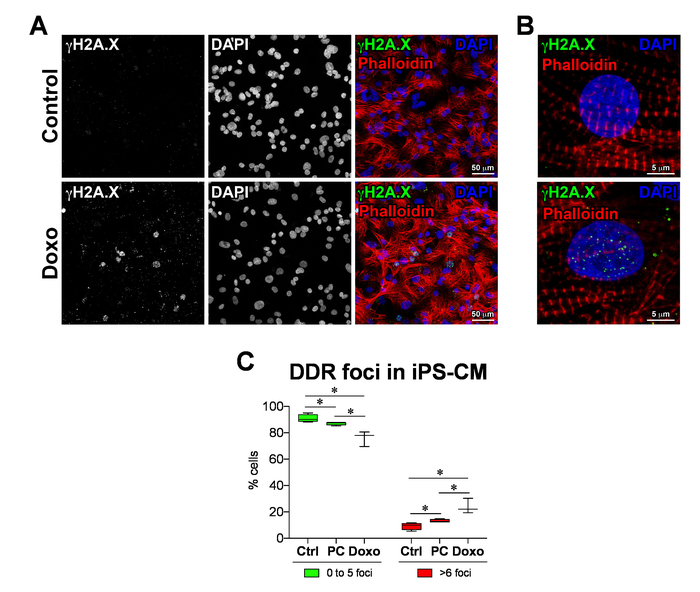
Figure 4: DNA damage response in iPS-derived cardiomyocytes. (A) DNA damage response marker γH2A.X identified by immunofluorescence in doxorubicin-treated (Doxo) and nontreated (control) iPS-cardiomyocytes as well as prolonged culture iPS-cardiomyocytes (PC). (B) Higher magnification of γH2A.X (green punctae) labeling at the sites of DNA damage in iPS-CMs. (C) Quantification of DDR foci, analyzed using CellProfiler with custom pipeline modules. Data are means ± SD; n = 3 to 4. *P < 0.05, Student's unpaired t-test. Please click here to view a larger version of this figure.

Figure 5
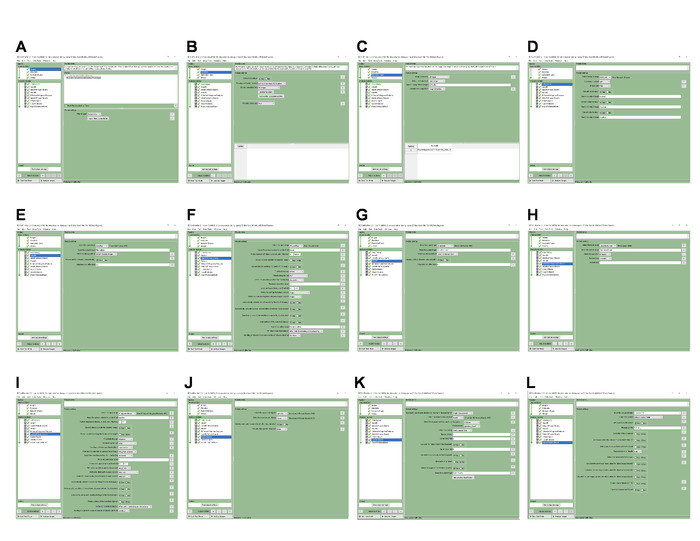
Figure 5: Automated DNA damage response analysis by CellProfiler. (AL) Screenshots of CellProfiler with specified settings for importing the images, and the automated identification and quantification of γH2A.X punctae in iPS-CMs. Please click here to view a larger version of this figure.

Figure 6
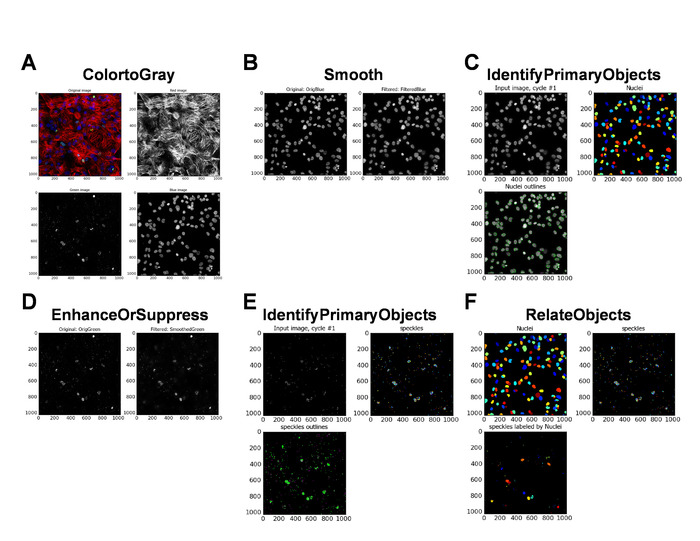
Figure 6: Automated DNA damage response analysis by CellProfiler. (AF) Data images generated by CellProfiler at the completion of the image analysis. Please click here to view a larger version of this figure.

List of Materials

0.25% Trypsin Corning 25200056
8-well chamber slide Millicell PEZGS0816
Accutase Stemcell Technologies 7920 Cell detachment solution
Alexa Fluor 488 AffiniPure
Donkey Anti-Rabbit IgG
Jackson Immuno
Research Laboratories
711-545-152
(RRID: AB_2313584)
Bovine Serum Albumin Sigma-Aldrich A7906
Cy3 AffiniPure Donkey Anti-Rabbit IgG Jackson Immuno
Research Laboratories
711-165-152
(RRID:AB_2307443)
DAPI Sigma-Aldrich D9564
Gibco B-27 Supplement, Serum Free, Gibco 17504-044
Matrigel growth factor reduced Corning 354230
mTeSR1 Stemcell Technologies 85850
PhalloidinA488 Life Technology A12379
Phospho-Histone H2A.X (Ser139) Antibody Cell Signaling Technology 2577 (RRID: AB_2118010)
RPMI Gibco 11875-093
SYBR Green I nucleic acid gel stain Sigma-Aldrich S9430
Triton X-100 Fisher scientific BP151-100
UltraPure Low melting Point Agarose Invitrogen 16520050
Vectashield Vector Laboratories H-1000 Antifade

Preparação do Laboratório

Stem and stem-cell-derived cells have immense potential as a regenerative therapy for various degenerative diseases. DNA is the storehouse of genetic data in all cells, including stem cells, and its integrity is fundamental to its regenerative ability. Stem cells undergo rapid propagation in labs to achieve the necessary numbers for transplantation. Accelerated cell growth leads to the loss of DNA integrity by accumulated metabolites, such as reactive oxygen, carbonyl, and alkylating agents. Transplanting these cells would result in poor engraftment and regeneration of the deteriorating organ. Moreover, transplanting DNA-damaged cells leads to mutations, DNA instability, cellular senescence, and possibly, life-threatening diseases such as cancer. Therefore, there is an immediate need for a quality control method to evaluate the cell’s suitability for transplantation. Here, we provide step-by-step protocols for the assessment of the DNA integrity of stem cells prior to cell transplantation.

Stem and stem-cell-derived cells have immense potential as a regenerative therapy for various degenerative diseases. DNA is the storehouse of genetic data in all cells, including stem cells, and its integrity is fundamental to its regenerative ability. Stem cells undergo rapid propagation in labs to achieve the necessary numbers for transplantation. Accelerated cell growth leads to the loss of DNA integrity by accumulated metabolites, such as reactive oxygen, carbonyl, and alkylating agents. Transplanting these cells would result in poor engraftment and regeneration of the deteriorating organ. Moreover, transplanting DNA-damaged cells leads to mutations, DNA instability, cellular senescence, and possibly, life-threatening diseases such as cancer. Therefore, there is an immediate need for a quality control method to evaluate the cell’s suitability for transplantation. Here, we provide step-by-step protocols for the assessment of the DNA integrity of stem cells prior to cell transplantation.

Procedimento

Stem and stem-cell-derived cells have immense potential as a regenerative therapy for various degenerative diseases. DNA is the storehouse of genetic data in all cells, including stem cells, and its integrity is fundamental to its regenerative ability. Stem cells undergo rapid propagation in labs to achieve the necessary numbers for transplantation. Accelerated cell growth leads to the loss of DNA integrity by accumulated metabolites, such as reactive oxygen, carbonyl, and alkylating agents. Transplanting these cells would result in poor engraftment and regeneration of the deteriorating organ. Moreover, transplanting DNA-damaged cells leads to mutations, DNA instability, cellular senescence, and possibly, life-threatening diseases such as cancer. Therefore, there is an immediate need for a quality control method to evaluate the cell’s suitability for transplantation. Here, we provide step-by-step protocols for the assessment of the DNA integrity of stem cells prior to cell transplantation.

Tags