Here, we describe a detailed and reproducible flow cytometry protocol to identify monocyte/macrophage and T-cell subsets using both extra- and intracellular staining assays within the murine spleen, bone marrow, lymph nodes and synovial tissue, utilizing an established surgical model of murine osteoarthritis.
Osteoarthritis (OA) is one of the most prevalent musculoskeletal diseases, affecting patients suffering from pain and physical limitations. Recent evidence indicates a potential inflammatory component of the disease, with both T-cells and monocytes/macrophages potentially associated with the pathogenesis of OA. Further studies postulated an important role for subsets of both inflammatory cell lineages, such as Th1, Th2, Th17, and T-regulatory lymphocytes, and M1, M2, and synovium-tissue-resident macrophages. However, the interaction between the local synovial and systemic inflammatory cellular response and the structural changes in the joint is unknown. To fully understand how T-cells and monocytes/macrophages contribute towards OA, it is important to be able to quantitively identify these cells and their subsets simultaneously in synovial tissue, secondary lymphatic organs and systemically (the spleen and bone marrow). Nowadays, the different inflammatory cell subsets can be identified by a combination of cell-surface markers making multi-color flow cytometry a powerful technique in investigating these cellular processes. In this protocol, we describe detailed steps regarding the harvest of synovial tissue and secondary lymphatic organs as well as generation of single cell suspensions. Furthermore, we present both an extracellular staining assay to identify monocytes/macrophages and their subsets as well as an extra- and intra-cellular staining assay to identify T-cells and their subsets within the murine spleen, bone marrow, lymph nodes and synovial tissue. Each step of this protocol was optimized and tested, resulting in a highly reproducible assay that can be utilized for other surgical and non-surgical OA mouse models.
Osteoarthritis (OA) is a debilitating and painful disease involving various pathologies of all tissues associated with the joint1. Affecting approximately 3.8% of the global population2, OA is one of the most prevalent musculoskeletal diseases and it is to become the 4th leading cause of disability worldwide by 20203. Post-traumatic OA occurs after a joint injury and accounts for at least 12% of all OA and up to 25% of OA in susceptible joints such as the knee4,5. Furthermore, joint injury increases the lifetime risk of OA by more than five times6. Not all injuries with apparently similar instability will go on to develop OA, and therefore defining factors that drive the long-term OA-risk remains challenging. It is crucial in order to develop effective treatments to prevent and/or treat post-traumatic OA, to investigate and better define the injury-specific pathology, causes, and mechanisms that predispose to OA1.
OA and its defining cartilage destruction was previously attributed entirely to mechanical stress and, thus, OA was considered a non-inflammatory disease2. However, more recent studies have shown an inflammatory infiltration of synovial membranes and an increase of inflammatory cells in the synovial tissue in patients with OA compared to healthy controls2, shedding light on an inflammatory component as a potential driving force in OA. Further studies indicated that abnormalities in both the CD4+ and CD8+ T-cell profile as well as monocytes/macrophages of the innate immune system may contribute to the pathogenesis of OA2,7. Detailed investigations into these abnormalities revealed relevant roles for various T cell subsets2, such as Th18, Th29, Th178 and T regulatory (Treg) populations10,11. Despite this compelling evidence, the causal relationship between the alteration of T-cell responses and the development and progression of OA is still unknown2.
In addition to specific T-cells having a role in OA, recent studies suggest that differentially polarized/activated macrophages may be associated with pathogenesis of OA12. In particular, macrophages originating from blood monocytes accumulate in the synovium and polarize into either classically activated macrophages (M1) or alternatively activated macrophages (M2) during OA development, implying a correlation between monocyte derived macrophages and OA13. In contrast, certain subsets of macrophages populate organs early during development and self-sustain their numbers in a monocyte independent matter14. Recently, a joint protective function mediated by a tight-junction barrier was shown for these synovial-tissue-resident macrophages (STRMs)14. These findings indicate that abnormalities in particular macrophage subsets may play a crucial role during development of OA. However, the interactions between this inflammatory cellular response and the structural changes in the joint subsequent to trauma is unknown.
Historically, analysis of immune cells in the synovial tissue was restricted to immunohistochemistry (IHC) or mRNA expression by reverse-transcription polymerase chain reaction (RT-PCR) approaches15,16. However, both IHC and RT-PCR lack the ability to identify multiple different cell types and their subsets simultaneously, thus, limiting the applicability of these methods. Furthermore, IHC is limited to analysis of small samples of tissue and may miss focal inflammatory cell accumulations. Over the last several years, a myriad of surface markers for various cell types have been developed, and subsets of immune cells can now be reliably identified by distinct combinations of these markers. Due to steady technical progress, flow cytometers are now capable of identifying a multitude of different fluorochromes simultaneously enabling analysis of large multicolor antibody panels.
Flow cytometry provides investigators with a powerful technique that allows simultaneous identification and quantification of a multitude of immune cells and their subsets at the single cell level. We have developed and optimized both an extracellular staining assay to identify monocytes/macrophages and their subsets as well as an extra/intracellular staining assay to identify T-cells and their subsets within murine spleen, bone marrow, lymph nodes and synovial tissue. Each step of this protocol was optimized and tested resulting in a highly reproducible assay that can be utilized for other surgical and non-surgical OA mouse models17.
Northern Sydney Local Health District Animal Ethics Committee has approved all procedures mentioned in this protocol. Mice are housed and cared for in accordance with the Guide for the Care and Use of Laboratory Animals (National Health and Medical Research Council of Australia Revised 2010). For all experiments 10-12-week-old, male C57BL/6 mice were utilized.
NOTE: To induce post-traumatic OA, surgical destabilization of the medial meniscus (DMM) in the right stifle joint was performed. Detailed information regarding this animal model was published by Glasson et al.18. In short, general anesthesia is induced in an induction chamber using isoflurane and thereafter maintained using a nose cone. The surgical leg is shaved with a razor blade and the surgical site is washed and swabbed with ethanol to minimize contamination. The animal is then moved to the operating microscope and placed on a sterile towel and the leg draped with sterile paper drape to isolate the surgical site and minimize contamination. Using the microscope, a 0.5 cm medial para-patella arthrotomy is made, the patella luxated laterally, and the infra-patella fat pad elevated to expose the medial menisco-tibial ligament, which is transected with dissecting forceps. The joint is flushed with sterile saline to remove any blood and the wound is closed in three layers – joint capsule, subcutaneous tissue (using suture material) and skin (using surgical tissue glue). Methods described in this protocol, however, can be applied to other models and methods for inducing OA. OA can be induced in either side of the animal, and when harvesting tissues, it is important to harvest the ipsilateral (draining) lymph nodes.
1. Isolation of the spleen, contralateral bone marrow, ipsilateral lymph nodes draining the stifle and synovial tissue
2. Generation of single cell suspensions from each tissue
NOTE: In order to ensure sufficient cell numbers for flow analysis synovial tissues from two mice need to be pooled. In the current protocol, pool all tissues from the same two mice in order to maintain analogy. Furthermore, iliac and inguinal lymph nodes were combined for each animal resulting in a total of 4 lymph nodes for each sample. In general, cell numbers in spleen, bone marrow and lymph nodes from one animal are sufficient to conduct flow analysis and the protocol can be applied. However, when using tissues from only one animal lysing times might need to be adjusted.
3. Allocation of cells
4. Monocyte Subset Panel
5. T Cell subset panel
6. Compensation, appropriate controls and gating
Representative results from both the monocyte subset panel and T-cell subset panel are described below.
Figure 1 illustrates the hierarchical gating strategy for the monocyte subset panel on immune cells gathered from bone marrow of DMM treated animals. The same strategy was used and verified in all other tissue types. When setting up the experiment, the Forward Scatter Area (FSC-A) and Side Scatter Area (SSC-A) voltage was determined for each tissue type to identify monocytes/macrophages and exclude T-cells and debris (G1). During each experiment, unstained controls of each tissue type were analyzed, and FSC-A and SSC-A voltage adjusted when necessary. Voltages are expected to stay similar over time, if parameters change drastically a blockage of the cytometer is likely. Furthermore, unstained controls were used to determine the true negatives for the dead/alive stain and gates were adjusted each time the experiment was conducted accordingly (Figure 2A). When designing the experiment, fluorochromes should be chosen carefully, and normally surface markers with low expression are paired with bright fluorochromes (e.g., here Alexa Fluor 647 was used for CD206). Various dead/alive stains exist that can be detected by different wavelengths; here, FVS510 was used.
Figure 3 illustrates sample data from immune cells isolated from synovial tissues and stained with extracellular surface markers 6 weeks after animals received either DMM or sham-control surgery. All subsets can easily be identified using the protocol both in study and control animals. In particular, differences between groups can be seen for macrophage subsets (higher percentage of Ly-6C+/MHC-II- macrophages (G7) in the DMM group) and the expression of M1 and M2 macrophages (higher percentage of M2 macrophages in the DMM group).
Figure 4 visualizes the hierarchical gating strategy for the extra- and intracellular T-cell panel on immune cells isolated from the spleen of DMM treated animals. Principles are identical to the ones used for the monocyte panel. However, the fixing and permeabilization process changes the size and density of cells. Thus, typical FSC and SSC parameters need to be determined using a back-gating process from CD3+ cells when first setting up the experiment for each cell type. Some fluorochromes tend to aggregate over time (e.g., PE that was used with FoxP3 here). Aggregates can potentially modify the results due to the high brightness that influences the spectral-overlap and compensation. Thus, all antibodies were vortexed and spun down each time prior to their use in order to decrease aggregates. Additionally, a gating strategy was used to further reduce the influence of aggregates (G2). While setting up the experiments fluorescence minus one controls (FMOs) were performed for each antibody. Sample data is shown in Figure 2B,2C.
Figure 5 and Figure 6 show immune cells that were isolated from lymph nodes (Figure 5) and synovial tissue (Figure 6) and stained using the T-cell panel protocol 4 weeks after animals received either DMM or sham-control surgery. The data shows a higher percentage of Th1 cells in DMM animals (G9) in both tissues. Furthermore, intracellular staining for T-regulatory cells (G11) and Th17 cells (G12) is successful using the protocol and differences can be detected between groups.
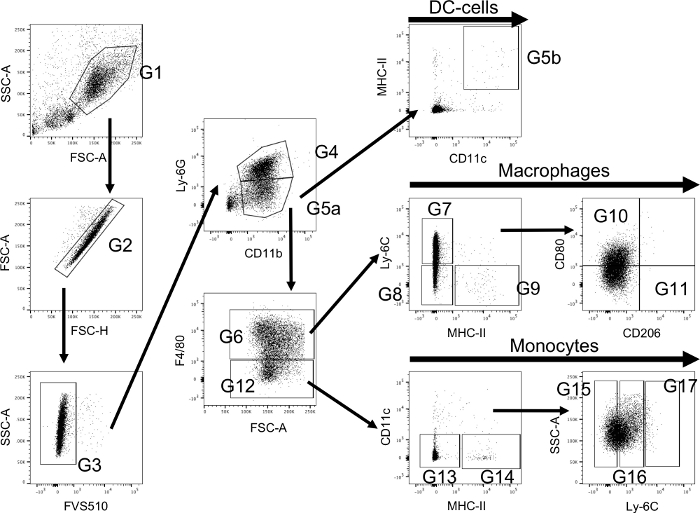
Figure 1: Flow cytometry hierarchical gating strategy using extracellular staining to identify monocytes/macrophages and their subsets. Myeloid cells are primarily identified using a forward/side scatter (FSC-A and SSC-A) dot plot (G1). Thereafter, singlets are detected using FSC-A and FSC-H (G2) and afterwards live cells are selected (G3). Cells from G3 are further classified using Ly-6G to identify neutrophils (G4) and CD11b for monocyte/macrophages (G5a). MHC-II is used to identify dendritic cells (G5b) amongst CD11b positive cells and F4/80 is used to select between macrophages (G6) and monocytes (G12). Macrophages are further classified into their subsets using Ly-6C and MHC-II (Ly-6C+/MHC-II- macrophages (G7); Ly-6C-/MHC-II- tissue resident macrophages (G8); Ly-6C-/MHC-II+ blood originated macrophages (G9)). More subsets can be selected from the entirety of macrophages and its respective subsets using CD206 and CD80 (M1: CD80+/CD206- (G10); M2: CD80-/CD206+ (G11)). Monocytes are further classified using MHC-II and CD11c (MHC-II-/CD11c- monocytes (G13); MHC-II+/CD11c- monocytes (G14)). The level of activation is then classified using the expression of Ly-6C and divided into low (G15), medium (G16) and high (G17). Please click here to view a larger version of this figure.
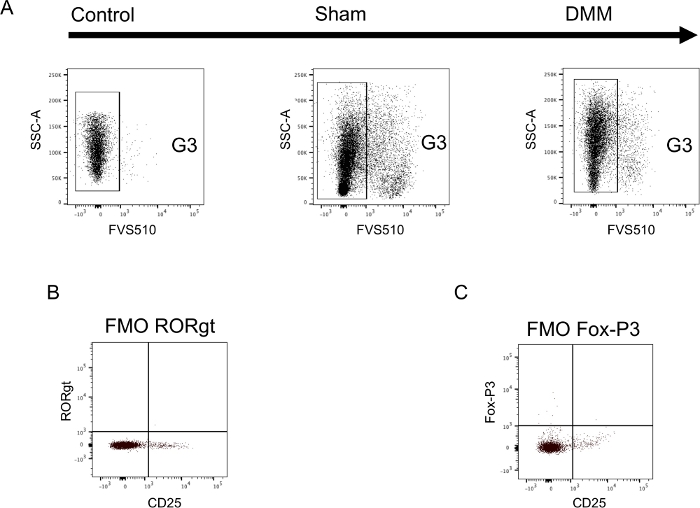
Figure 2: Sample data illustrating appropriate controls in both the monocyte and T-cell panel. (A) Synovial tissue was harvested 6 weeks after either DMM-surgery (DMM) or sham-control-surgery (sham) and a single cell suspension was stained using extracellular surface markers. During each experiment unstained cells were used to determine true negatives for the dead/alive stain and to set gates (Control). Setting of gates using unstained cells is shown in panel A. (B+C) Spleen cells were harvested from untreated control animals, a single cell suspension generated and stained using both extra- and intracellular markers. Fluorescents-minus-one (FMO) controls were generated by staining cells with the entire antibody panel missing only one antibody. Sample data is shown for both intracellular antibodies. (B) FMO -RORgt and (C) FMO -Fox-P3. FMOs were performed for both panels and used to set each gate. Please click here to view a larger version of this figure.
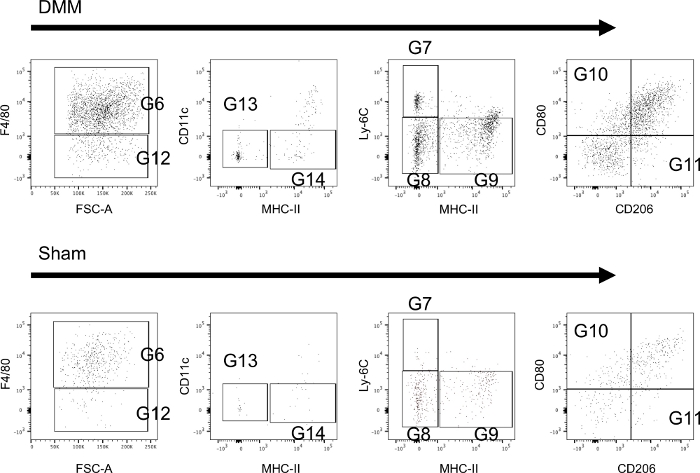
Figure 3: Extracellular staining of monocytes/macrophages isolated from the synovium of mice. Sample tissues were collected 6 weeks after mice received either DMM-surgery (DMM) or sham-control-surgery (sham). Further information regarding the utilized gates can be found in Figure 1. Sample data shows that all subsets can be reliably identified and differences can be seen between groups. Please click here to view a larger version of this figure.
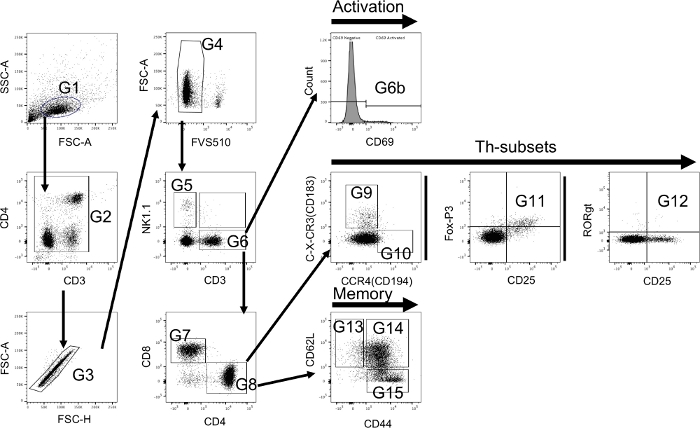
Figure 4: Flow cytometry hierarchical gating strategy using both extra- and intracellular staining to identify T-cells and their subsets. T-cells are primarily identified using a forward/side scatter (FSC-A and SSC-A) dot plot (G1). Due to the nature of the utilized antibodies aggregates should be excluded using CD3 and CD4 (G2). Thereafter, singlets are detected using FSC-A and FSC-H (G3) and afterwards live cells are selected (G4). Cells from G4 are further classified using NK1.1 to identify natural killer cells (G5) and CD3 to identify T-cells (G6). The level of activation is determined using CD69 (G6b). Thereafter, CD4 and CD8 are used to identify T-killer cells (CD4-/CD8+ (G7)) and T-helper cells (CD4+/CD8- (G8)). T-helper cells are classified into Th-1 (C-X-CR3+/CCR4- (G9)) and Th-2 cells (C-X-CR3-/CCR4+ (G10)) using C-X-CR3 (CD183) and CCR4 (CD194). In addition, Th-17 cells (CD25+/RORgt+ (G11)) and T-regulatory cells (CD25+/Fox-P3+ (G12)) are identified using intracellular markers. Furthermore, memory cell subsets are identified from T-helper cells using CD44 and CD62L (CD44-/CD62L+ naïve T-memory cells (G13); CD44+/CD62L+ central T-memory cells (G14); CD44+/CD62L- effector T-memory cells (G15)). Please click here to view a larger version of this figure.
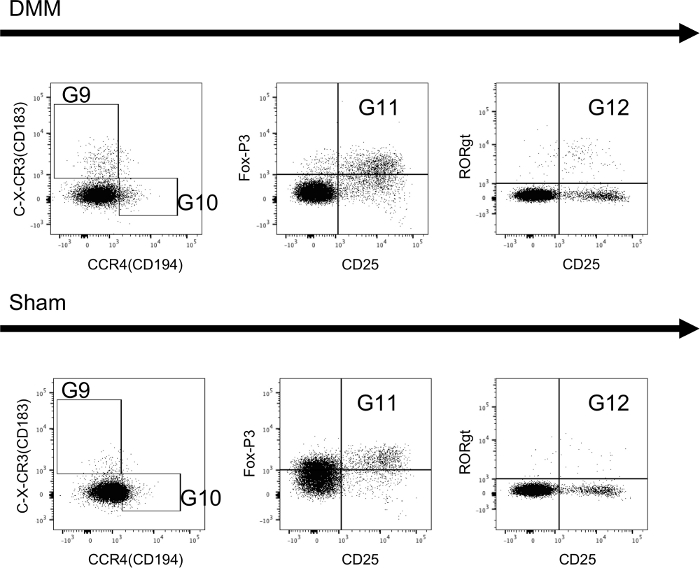
Figure 5: Extracellular and intracellular staining of T-cells isolated from draining lymph nodes of mice. Sample tissues were collected 4 weeks after mice received either DMM-surgery (DMM) or sham-control-surgery (sham). Further information regarding the utilized gates can be found in Figure 4. Sample data shows that all subsets can be reliably identified and differences can be seen between groups. Please click here to view a larger version of this figure.
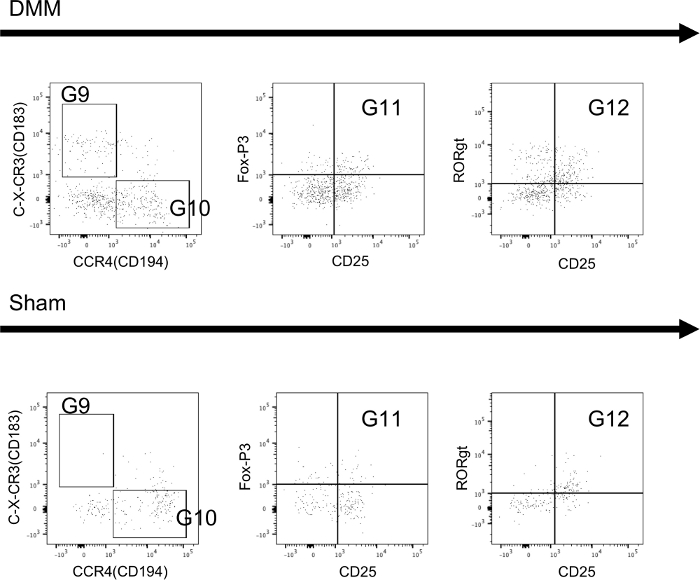
Figure 6: Extracellular and intracellular staining of T-cells isolated from synovial tissue of mice. Sample tissues were collected 4 weeks after mice received either DMM-surgery (DMM) or sham-control-surgery (sham). Further information regarding the utilized gates can be found in Figure 4. Sample data shows that all subsets can be reliably identified and differences can be seen between groups. Please click here to view a larger version of this figure.
The methods described in this protocol have been designed and tested to reliably identify various subsets from both monocytes/macrophages and T-cells within the murine spleen, bone marrow, lymph nodes, and synovial tissue in a murine model of osteoarthritis (OA). The current protocol can easily be modified to investigate different tissue types, or other cell types by exchanging antibodies, and can be used for alternative murine models of OA. When testing other tissue types, it is critical to test the specificity of each antibody as expression of surface markers of immune cells vary in each tissue20. In addition, when exchanging antibodies, it is necessary to perform a dose titration curve to establish the optimal concentration of antibody as well as repeating the compensation process to address changes in spectral overlap.
In the current protocol, OA was induced using the DMM mouse model18. The most commonly used and established animal models are in the mouse, because this species provides multifold advantages in investigating the pathophysiology of post-traumatic OA17. In the mouse in particular, surgical and non-surgical OA models have been described17: the most common being destabilization of the medial meniscus (DMM), surgical transection of the anterior cruciate ligament (ACLT) and non-surgical ACL rupture (ACLR), respectively21. All these animal models are well suited for the investigation into the role of cellular inflammation in the pathology of post-traumatic OA and the current protocol has been successfully tested for all previously mentioned animal models in the laboratory. Although all the above animal models are established and have been described in the literature, each has its own strengths and limitations that have been discussed in detail elsewhere17 and so are discussed only briefly below. All surgical models are subject to the surgical approach, wound healing process and its associated inflammatory response. When assessing the contribution of inflammatory cells to the development of post-traumatic OA, this inflammatory wound healing response might serve as a confounder, especially during the early time points after the intervention. In addition, DMM and ACLT procedures need to be conducted in a very standardized manner to minimize variability between animals. The ACLT surgery is much more difficult to learn than the DMM surgery and requires a greater surgical exposure than DMM to definitively identify and ensure injury only to the ACL and avoid iatrogenic damage to other joint tissues18. Non-surgical ACL rupture is a standardized and very efficient way of inducing post-traumatic OA. However, a specialized device that applies a controlled single compressive load to the tibia of the flexed knee is necessary. This device has to be calibrated and tested in order to get comparable and reliable results. Additionally, the ACLR model induces very severe and progressive joint damage in mice with marked erosion of the posterior medial tibial plateau22 that is not seen with ACL injury in other species including humans.
In order to comprehensively characterize the inflammatory process and its cellular component during development of OA, it is desirable to not only investigate the synovial tissue but also the local lymph nodes as well as secondary lymphoid organs, such as the spleen and bone marrow. Lymphatic drainage patterns of the knee joint have been characterized in mice and lymph fluid from the knee joint drains through both the iliac and inguinal lymph node at a varying dispersion23,24. In order to facilitate comparability between animals, we decided in this protocol to pool the inguinal and iliac lymph node. In contrast, while in close proximity to the knee, the popliteal lymph node drains the hindfoot and does not play a role during inflammatory processes of the knee.
Mice have a small volume of intra-articular synovial tissues25 and isolation of the immune cells herein remains challenging. In the current protocol, harvesting techniques for synovial tissues were adapted to allow isolation of the maximum number of immune cells. Therefore, the harvesting technique includes the supra- and infrapatellar recesses as well as the infrapatellar fad pad, due to its high number of immune cells26. The digestion process and choice of enzyme was optimized to fully digest the synovial membrane and fatty tissue, while leaving the tendon, and the patella and its cartilage unimpaired. Thus, the current protocol introduces a reproducible method of harvesting immune cells from synovial tissue.
Flow cytometry analysis has multiple advantages when investigating cellular immune processes during the development of OA; nonetheless, this technique has limitations. Due to the small number of immune cells in the synovial tissue, it is necessary to pool tissue samples from at least two animals to obtain one sample. Due to the large number of fluorochromes and colors used in this protocol, special attention has to be paid to a meticulous compensation of a possible spectral overlap for each tissue type and compensation needs to be re-evaluated consistently throughout the use of this technique. Due to the large number of available markers and considerable variation among studies to identify a certain population, another possible limitation is the choice of markers used to identify cells19. Flow cytometry allows quantification of “events”, which does not necessarily coordinate to total cells. In order to obtain a truly quantitative analysis, one needs to either acquire counting beads concurrently when running flow analysis or count cells in single cell suspensions beforehand to obtain absolute numbers (as done here). In general, the principles of this protocol (e.g., how to design and set up a flow panel or techniques used to prepare single cell suspensions) could be potentially adapted for human samples. However, surface markers of human immune cells differ from murine cells and therefore, appropriate antibodies need to be selected and tested. In addition, duration of RBC lysis and appropriate volume of buffer needs to be determined as it is most likely different. Prior to adapting methods from this protocol to other species or tissues meticulous testing of each step is necessary to ensure that methods are working as intended.
Despite its limitations, flow cytometry analysis of immune cells remains a powerful technique that allows to identify both monocytic cell and T-cell subsets at the single cell level. In particular, the current protocol introduces a reliable and reproducible technique that can identify and quantify the cellular immune response during the development of OA in the synovial tissue and secondary lymphatic organs. In the future, this technique may help to characterize the immune response in various osteoarthritis inducing animal models and hereafter evaluate the efficacy of immune modulating drugs onto this debilitating disease.
In conclusion, this flow cytometry protocol describes a detailed and reproducible method to identify monocytes/macrophages and T cell subsets using both extra- and intracellular staining assays within murine spleen, bone marrow, lymph nodes and synovial tissue utilizing an established surgical osteoarthritis mouse model.
The authors have nothing to disclose.
We would like to thank Andrew Lim, Ph.D. and Giles Best, Ph.D. for their help in setting up the flow cytometer. This project was supported by the Deutsche Forschungsgemeinschaft (DFG) (DFG-HA 8481/1-1) awarded to PH.
APC anti-mouse CD194 (CCR4) | BioLegend | 131212 | T-Cell Panel | |
Brilliant Stain Buffer Plus 1000Tst | BD | 566385 | Buffers | |
Fixable Viability Stain 510, 100 µg | BD | 564406 | T-Cell Panel | |
Fixable Viability Stain 510, 100 µg | BD | 564406 | Monocyte Panel | |
Liberase, Research Grade | Roche | 5401127001 | Enzyme for synovial tissue | |
Ms CD11b APC-R700 M1/70, 100 µg | BD | 564985 | Monocyte Panel | |
Ms CD11C PE-CF594 HL3, 100 µg | BD | 562454 | Monocyte Panel | |
Ms CD183 BB700 CXCR3-173, 50 µg | BD | 742274 | T-Cell Panel | |
Ms CD206 Alexa 647 MR5D3, 25 µg | BD | 565250 | Monocyte Panel | |
Ms CD25 BV605 PC61, 50 µg | BD | 563061 | T-Cell Panel | |
Ms CD3e APC-Cy7 145-2C11, 100 µg | BD | 557596 | T-Cell Panel | |
Ms CD4 PE-Cy7 RM4-5, 100 µg | BD | 552775 | T-Cell Panel | |
Ms CD44 APC-R700 IM7, 50 µg | BD | 565480 | T-Cell Panel | |
Ms CD62L BB515 MEL-14, 100 µg | BD | 565261 | T-Cell Panel | |
Ms CD69 BV711 H1.2F3, 50 µg | BD | 740664 | T-Cell Panel | |
Ms CD80 BV650 16-10A1, 50 µg | BD | 563687 | Monocyte Panel | |
Ms CD8a BV786 53-6.7, 50 µg | BD | 563332 | T-Cell Panel | |
Ms F4/80 BV421 T45-2342, 50 µg | BD | 565411 | Monocyte Panel | |
Ms Foxp3 PE MF23, 100 µg | BD | 560408 | T-Cell Panel | |
Ms I-A I-E BV711 M5/114.15.2, 50 µg | BD | 563414 | Monocyte Panel | |
Ms Ly-6C PE-Cy7 AL-21, 50 µg | BD | 560593 | Monocyte Panel | |
Ms Ly-6G APC-Cy7 1A8, 50 µg | BD | 560600 | Monocyte Panel | |
Ms NK1.1 BV650 PK136, 50 µg | BD | 564143 | T-Cell Panel | |
Ms ROR Gamma T BV421 Q31-378, 50 µg | BD | 562894 | T-Cell Panel | |
Red Blood Cell Lysing Buffer | N/A | N/A | Buffers | Description in: Immune Cell Isolation from Mouse Femur Bone Marrow / Xiaoyu Liu and Ning Quan/ Bio Protoc. 2015 October 20; 5(20): . |
Transcription Factor Buffer Set 100Tst | BD | 562574 | Buffers |