We present a method to investigate early osteoarthritic changes at the cellular level in articular cartilage by using atomic force microscopy (AFM).
Biomechanical properties of cells and tissues not only regulate their shape and function but are also crucial for maintaining their vitality. Changes in elasticity can propagate or trigger the onset of major diseases like cancer or osteoarthritis (OA). Atomic force microscopy (AFM) has emerged as a strong tool to qualitatively and quantitatively characterize the biomechanical properties of specific biological target structures on a microscopic scale, measuring forces in a range from as small as the piconewton to the micronewton. Biomechanical properties are of special importance in musculoskeletal tissues, which are subjected to high levels of strain. OA as a degenerative disease of the cartilage results in the disruption of the pericellular matrix (PCM) and the spatial rearrangement of the chondrocytes embedded in their extracellular matrix (ECM). Disruption in PCM and ECM has been associated with changes in the biomechanical properties of cartilage. In the present study we used AFM to quantify these changes in relation to the specific spatial pattern changes of the chondrocytes. With each pattern change, significant changes in elasticity were observed for both the PCM and ECM. Measuring the local elasticity thus allows for drawing direct conclusions about the degree of local tissue degeneration in OA.
Articular cartilage is an avascular, aneural tissue. Sparsely scattered chondrocytes produce, organize, and maintain an expansive extracellular matrix (ECM) into which they are embedded. As a distinct and specialized part of the ECM, chondrocytes are surrounded by a thin layer of specialized matrix known as the pericellular matrix (PCM). The PCM acts as a mechanosensitive cell-matrix interface1 that protects the chondrocytes2 and modulates their biosynthetic response3. As previously described4, in healthy cartilage, chondrocytes are arranged in specific, distinct spatial patterns that are specific for each tissue layer and joint4,5 and depend on joint-specific mechanical loading mechanisms6. These patterns change from pairs and strings in healthy cartilage to double strings with the onset of osteoarthritis (OA). With further progression of the disease the chondrocytes form small clusters, increasing gradually in size to big clusters in advanced OA. A complete loss of any organizational structure and induction of apoptosis is observed in end stage OA. Thus, chondrocyte cellular arrangement can be used as an image-based biomarker for OA progression4.
Biomechanical properties of cells and tissues not only regulate their shape and function but are also crucial for maintaining their vitality. Changes in elasticity can propagate or trigger the onset of major diseases like cancer or OA. Atomic force microscopy (AFM) has emerged as a powerful tool to qualitatively and quantitatively characterize the biomechanical properties of specific biological target structures on a microscopic scale, measuring a wide range of force, from piconewton to the micronewton. The major application of AFM is to measure the surface topography and mechanical properties of samples at subnanometer resolution7. The measurement device consists of three main components: 1) An AFM probe, which is a sharp tip mounted on a cantilever and is used for the direct interaction with the surface of the sample. When force is applied to the cantilever, deformation of the latter occurs according to the measured tissue's properties. 2) An optical system that projects a laser beam onto the cantilever, which is then reflected to a detector unit. 3) A photodiode detector that catches the light deflected from the cantilever. It converts the received information regarding the laser deflection by the cantilever into a force curve that can be analyzed.
Thus, the main principle of AFM is the detection of the force acting between the AFM probe and the target structure of the sample. The force curves obtained describe the mechanical properties of the target structures on the sample surface like elasticity, charge distribution, magnetization, yield stress, and elastic plastic deformation dynamics8. An important advantage of AFM over other imaging techniques is that AFM can be used to measure the mechanical properties of live cells in medium or tissues in a native state without damaging the tissue. AFM can operate both in liquid or dry conditions. There is no requirement for sample preparation. AFM provides the possibility to image a specimen and measure its mechanical properties simultaneously in specimens that are near physiological conditions. In the present study we describe a novel approach to assess OA progression by measuring the elasticity of the PCM and ECM in native articular cartilage. The correlation of spatial organization of chondrocytes with the degree of local tissue degeneration provides a completely new perspective for early detection of OA. The functional relevance of these patterns has not been evaluated so far, however. Because the major function of articular cartilage is load bearing at low friction, the tissue must possess elastic properties. AFM allows measuring not only the elasticity of the ECM but also of the spatial cellular patterns embedded into their PCM. The observed correlation of elasticity with spatial pattern change of the chondrocytes is so strong that measuring elasticity alone may allow stratification of local tissue degeneration.
Elastic moduli of the PCM and ECM were assessed in 35 µm-thin sections using an AFM system integrated into an inverted phase contrast microscope that allowed simultaneous visualization of the cartilage sample. This protocol is based on a study already published from our laboratory9 and specifically describes how to characterize the spatial arrangement of the chondrocytes and how to measure the elasticity of their associated PCM and ECM. With each pattern change of the chondrocytes, significant changes in elasticity can also be observed for both the PCM and ECM, allowing this technique to be used to directly measure the stage of degeneration of the cartilage.
This validated approach opens up a new way to evaluate OA progression and therapeutic effects at early stages before macroscopic tissue degradation actually starts to appear. Performing AFM measurements consistently is an arduous process. In the following protocol we describe how to prepare the sample to be measured by AFM, how to perform the actual AFM measurements starting with preparation of the cantilever, how to calibrate the AFM, and then how to perform the measurements. Step-by-step instructions give a clear and concise approach to obtain reliable data and provide basic strategies for processing and interpreting it. The discussion section also describes the most common pitfalls of this rigorous method and provides helpful troubleshooting tips.
The human cartilage samples were obtained from patients undergoing total knee arthroplasty in the Department of Orthopaedic Surgery of the University Hospital of Tuebingen, Germany, and the Winghofer-hospital, Rottenburg a.N., Germany, for end-stage OA of the knee. Full departmental, institutional, and local ethical committee approval were obtained before commencement of the study (project number 674/2016BO2). Written informed consent was received from all patients before participation. The methods were carried out in accordance with the approved guidelines.
1. Sample preparation
2. Cantilever preparation (gluing the microspheres)
3. Preparing the AFM device for measurements
4. Loading the sample and calibration of the cantilever
NOTE: Here, calibration of the device is performed by running a force curve on the clean surface of the Petri dish filled with Leibovitz’s medium without any sample tissue. Calibration can also be performed by using a separate control AFM dish filled only with the AFM medium without the sample.
5. Biomechanical characterization of the ECM and PCM by performing elasticity measurements via AFM
6. Data processing
NOTE: The data analysis or determination of the elastic modulus is performed using a Hertz model as described previously11,12. The indenter’s shape was spherical due to the usage of microspheres on the tip and the Poisson’s ratio was kept at 0.5 based on previous literature13,14,15.
Along the physiopathological model from strings to double strings, to small and finally to big clusters, both ECM (Figure 3A) and PCM (Figure 3B) elastic moduli decreased significantly between each pattern change. The only exception was the difference in ECM between strings and double strings (p = 0.072). The results show that the ECM/PCM ratio (Figure 4B) did not change significantly, whereas a marked decrease in the absolute differences in elasticity between ECM and PCM was observed (Figure 4A). Furthermore, the results do not show any significant association concerning the ECM/PCM ratio or associated cellular spatial changes (r = -0.099, p = 0.281).
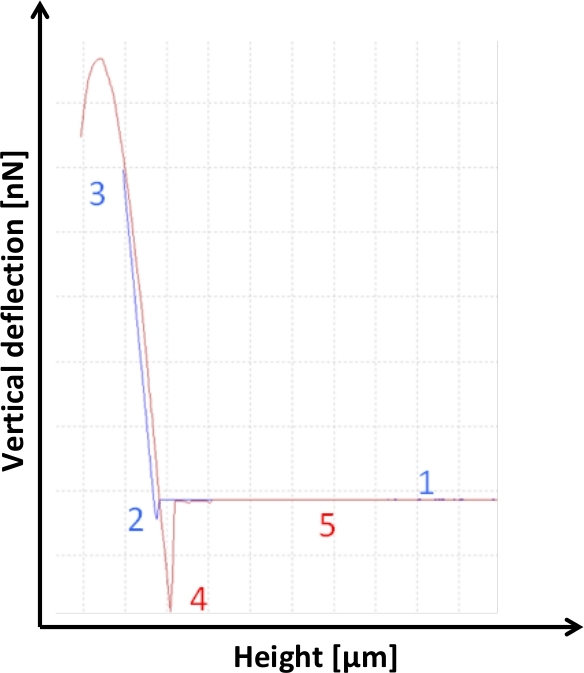
Figure 1: Schematic representation of a force-distance curve in the AFM contact mode. As the probe approaches the surface, the forces are too small to give a measurable deflection of the tip at first, thus leaving the tip in its undisturbed position (1). Then, when the cantilever is very close to the sample, due to adhesive forces active between the tip and the probe, the cantilever actually quickly snaps towards the sample (2). With the probe further approaching the sample, the repulsive deflection then faces against the movement of direction, with an almost linear function of height and deflection until the vertical deflection reaches the relative set point value (3). When retracting (4), in addition to the lowering deflecting forces, adhesion forces are also present while the cantilever is retracted in the Z-axis from the sample. As the AFM probe is pulled off the contact with the sample, it first gets “stuck” before it is able to loosen from the adhesion at the interface, even leading to a short negative deflection of the cantilever, before again reaching its unbent neutral position without contact with the probe (5). The extent of deflection is expressed in the force working on the cantilever expressed in nanonewtons. Please click here to view a larger version of this figure.
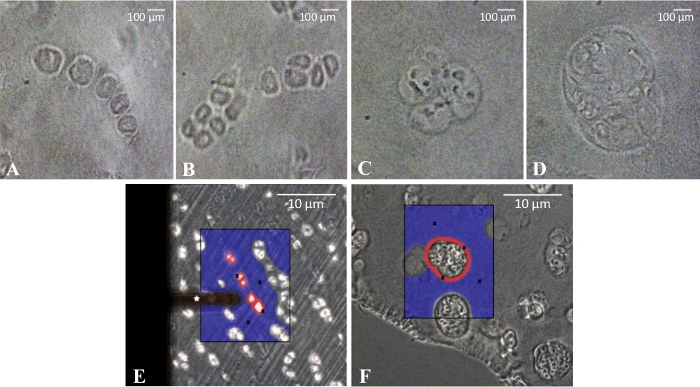
Figure 2: Representative spatial characterization of chondrocytes and AFM measurements of the extracellular matrix (ECM) and pericellular matrix (PCM). (A-D) Characterization of the cellular patterns: strings (A), double strings (B), small clusters (C), and big clusters (D). The elastic moduli of the PCM (red circles) and ECM (blue area) (E/F) were assessed for the different cellular patterns in osteoarthritic cartilage. Measurement sites for the ECM and PCM were selected by the experimenter and are graphically indicated by black crosses. The cantilever tip used for the measurements is marked by a white star. Scale bars represent 10 µm (A-D), and 100 µm (E/F). The figure is adapted and modified from Danalache et al.9. Please click here to view a larger version of this figure.
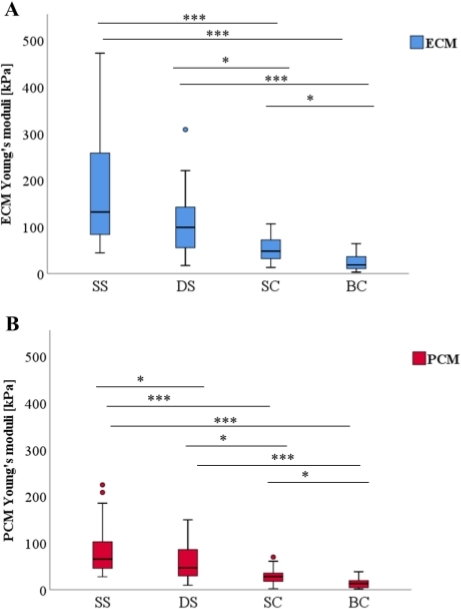
Figure 3: Comparison of the quantified Young’s moduli of the extracellular matrix (ECM) and the pericellular matrix (PCM) as a function of spatial chondrocyte organization. With progressive pathological spatial chondrocyte organization, a gradual decrease of elasticity was noted in the boxplots for both the ECM (A) and the PCM (B) (*p < 0.05, ***p < 0.001). Abbreviations: SS: single strings, DS: double strings, SC: small clusters, BC: big clusters. The figures are taken from Danalache et al.9. Please click here to view a larger version of this figure.
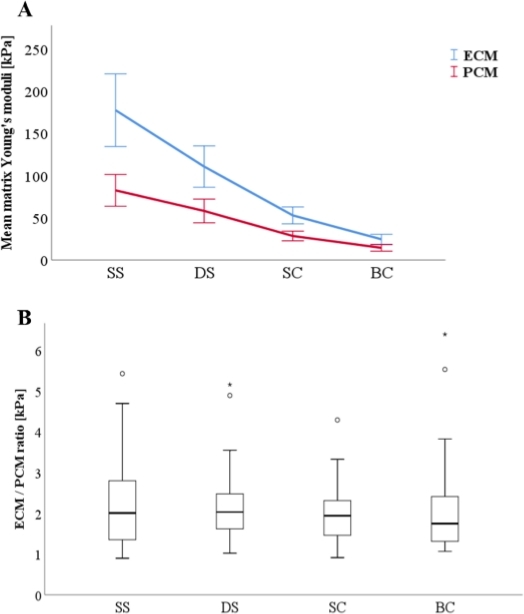
Figure 4: Relationship of the Young’s moduli of the extracellular matrix (ECM) and the pericellular matrix (PCM) as a function of cellular spatial organization. An increasingly pathological spatial chondrocyte organization was associated with a decrease of the Young’s moduli for both ECM and PCM (A). While these spatial changes took place, the ratio of ECM and PCM elasticity remained constant, showing no significant changes (B). The data are presented as a line diagram with mean ± standard error (A) and boxplots (B). Abbreviations: SS: single strings, DS: double strings, SC: small clusters, BC: big clusters. The figures are taken from Danalache et al.9. Please click here to view a larger version of this figure.
Supplemental Figure 1: Representative force curve obtained by indentation of the pericellular matrix (PCM) of a single string pattern showing the fit results (orange arrow) as well as the residual root mean square (residual RMS; black arrow). The fit results include the contact point between sample and tip, the Young’s Modulus, and the baseline. The residual RMS displayed below describes the difference between the fit and the force data, thereby representing the quality of a force curve fit. Please click here to download this figure.
Table 1. Parameters for gluing a microsphere on the AFM-probe | |
Parameters | Value |
Setpoint | 5.0 V |
Adjust baseline | 1 |
Pulling length | 90.0 µm |
Z movement | Constant speed |
Extend speed | 5.0 µm/s |
Extend time | 18.0 s |
Contact time | 90.0 s |
Delay mode | Constant force |
Sample rate | 2000 Hz |
Table 1. Parameters for gluing a microsphere on the AFM-probe.
Table 2. Approach parameters | |
Approach Parameters | Value |
Approach IGain | 5.0 Hz |
Approach PGain | 0.0002 |
Approach target height | 10.0 µm |
Approach setpoint | 5.00 V |
Approach baseline | 0.00 V |
Table 2. Approach parameters.
Table 3. Run parameters | |
Parameters | Value |
Setpoint | 1.0 V |
Adjust baseline | 1 |
Pulling length | 90.0 µm |
Z movement | Constant speed |
Extend speed | 5.0 µm/s |
Extend time | 18.0 s |
Contact time | 0.0 s |
Delay mode | Constant force |
Sample rate | 2000 Hz |
Table 3. Run parameters.
Using AFM as a novel and powerful technique to measure the biomechanical properties of biological materials at a nanoscale level, we measured the elastic properties of the ECM and PCM in human osteoarthritic articular cartilage. Cartilage samples were selected according to their predominant spatial pattern of chondrocyte organization as an image-based biomarker for local tissue degeneration. As expected, a strong decline in the values of elasticity of both ECM and PCM was observed along spatial chondrocyte reorganization. These observations clearly highlight that the deviations in spatial arrangement of chondrocytes were not only associated with changes in the elastic properties of the cellular microenvironment (PCM), but also throughout the entire cartilage (ECM). Furthermore, the ECM/PCM ratio did not show any significant changes in spite of the robust changes in the elastic moduli of PCM and ECM during OA. These findings indicate that the changes in the mechanical properties of the ECM and the PCM occurred unidirectionally and at the same time, which might mean that the nature of progressive destruction is similar for both the PCM and ECM. OA initiation and progression thus triggers significant PCM and ECM degradation and ultimately destruction. Both losses were associated with a significant loss of biomechanical properties of the articular cartilage such as its elasticity, as shown in the present study. This emphasizes the functional relevance of the spatial organization of chondrocytes as a marker for biomechanical properties. Conversely, it allows us to use local elasticity measurements to draw conclusions about the locally predominant spatial patterns and thus the local tissue degeneration of the cartilage.
Atomic force microscopy (AFM) has emerged as a high-resolution tool to study tissues in a nondestructive way. It operates by physically probing samples with a delicate and pliable cantilever that reflects a laser onto a photodiode. Any changes in this reflection are registered and converted into an electrical signal. While AFM is a powerful tool to conduct nanoscale measurements, it does not come without its limitations and pitfalls. Especially critical is the cantilever preparation by gluing the microspheres. In the context of this method, microspheres are used to modify the indentation depth and local pressure during measurements. Using small microspheres attached to the tip of the probe allows the measurement of the biomechanical properties of a fiber network rather than the elasticity of single fiber when using the tip alone. It also prevents tissue damage during the measurement process. Due to the delicate nature of the cantilever sensors, an attentive and careful mode of preparation needs to be established in order to obtain consistent and accurate measurements. In order to prevent the microspheres from detaching from the sensor’s tip, we recommend freshly mixed glue not older than one week. Furthermore, it is vital for the sensor’s functionality to place the microsphere at the tip’s center as lateral deviation in microsphere attachment easily results in inconsistent measurements.
Placing the cantilever on the glass block and fixing it with a fitting spring is a delicate and error-prone process that needs meticulous attention and steady hands. Because cantilevers are very likely to be destroyed by untrained operators, we recommend conducting several test runs and practice to comfortably handle the AFM’s easily breakable components.
A clean glass block is imperative to properly calibrate the device and obtain reliable measurements. Dirt or dust on the block’s optical surface may prevent proper laser alignment on the photodetector. Therefore, if problems during the laser alignment are encountered, washing off the glass block with ethanol a second time might be necessary.
Data analysis or determination of the elastic modulus can be performed using the Hertz model as described previously11,12. In short, the data generated by indentation are plots of force over movement of the cantilever tip. During the measurements, the cantilever is moved in the direction of the sample. This leads to the cantilever making contact with the sample and subsequently to its bending in the direction opposite to the one in which it originally moved. Simultaneously, an indentation of the sample by a certain amount occurs. In order to use the Hertz-fit model, the sample’s indentation has to be calculated and adjusted to isolate the cantilever bending parameter. The parameter describing the sample is Poisson’s ratio, which depends on the material investigated. For soft biological samples, Poisson’s ratio is often set to 0.515. As mentioned above, the shape of the used indenter is relevant to the calculation of Young’s modulus, as it dictates the extensions that have to be made to the original Hertz equation. In case of the described experiment, a spherical indenter shape is assumed due to the usage of microspheres.
While AFM may offer new and interesting possibilities of gathering data, the consistency and reliability of the yielded data strongly depend on the experience of the respective operator. Several of the steps outlined above are prone to human error and require patience and meticulousness to execute them properly.
Due to the many sensitive variables that can affect measurement results, the absolute force values reported in this study cannot be generalized but are rather specific for our experimental setup. When using this technique to evaluate the tissue degeneration of cartilage, some normalizing measurements on different spatial patterns first need to be performed to scale the results to the specific experimental measurement settings present. The relationship of the different elasticity moduli and the spatial patterns will, however, not be affected.
The authors have nothing to disclose.
We thank our co-authors from the original publication for their help and support.
Amphotericin B | Merck | A2942 | |
Atomic Force Microscope (AFM) | CellHesion 200, JPK Instruments, Berlin, Germany | JPK00518 | |
AFM head | (CellHesion 200) JPK | JPK00518 | |
Biocompatible sample glue | JPK Instruments AG, Berlin, Germany | H000033 | |
Cantilever | tip C, k ¼ 7.4 N/m, All-In-One-AleTl, Budget Sensors, Sofia, Bulgaria | AIO-TL-10 | |
Dulbecco's modified Eagle's medium (DMEM) | Gibco, Life Technologies, Darmstadt, Germany | 41966052 | |
Inverted phase contrast microscope (Integrated with AFM) | AxioObserver D1, Carl Zeiss Microscopy, Jena, Germany | L201306_03 | |
Leibovitz's L-15 medium without L-glutamine | (Merck KGaA, Darmstadt, Germany) | F1315 | |
Microspheres | Polysciences | 07313-5 | |
Penicillin-Streptomycin | Sigma | P4333 | |
Petri dish heater associated with AFM | JPK Instruments AG, Berlin, Germany | T-05-0117 | |
Scalpel | Feather | 2023-01 | |
Tissue culture dishes | TPP Techno Plastic Products AG, Trasadingen, Switzerland | TPP93040 | |
Tissue-tek O.C.T. Compound | Sakura Finetek, Alphen aan den Rijn, Netherlands | SA6255012 |