Isolation of cells from dissected implants and their characterization by flow cytometry can significantly contribute to understanding the pattern of immune response against implants. This paper describes a precise method for the isolation of cells from dissected implants and their staining for flow cytometric analysis.
The success of implanting laboratory-grown tissue or a medical device in an individual is subject to the immune response of the recipient host. Considering an implant as a foreign body, a hostile and dysregulated immune response may result in the rejection of the implant, while a regulated response and regaining of homeostasis can lead to its acceptance. Analyzing the microenvironments of implants dissected out under in vivo or ex vivo settings can help in understanding the pattern of immune response, which can ultimately help in developing new generations of biomaterials. Flow cytometry is a well-known technique for characterizing immune cells and their subsets based on their cell surface markers. This review describes a protocol based on manual dicing, enzymatic digestion, and filtration through a cell strainer for the isolation of uniform cell suspensions from dissected implant tissue. Further, a multicolor flow cytometry staining protocol has been explained, along with steps for initial cytometer settings to characterize and quantify these isolated cells by flow cytometry.
Advances in the field of medicine have led to the frequent use of implanted materials for supporting the function or re-growth of damaged tissue1,2. These include devices such as pacemakers, reconstructive cosmetic implants, and orthopedic plates used for bone fracture fixation3,4. However, the materials used to make these implants and the locations in which they are implanted play important roles in determining the success of these implants5,6,7. As foreign bodies, these implants can generate an immune response from the host that can either lead to rejection or tolerance8. This factor has driven biomaterial research to generate materials that can attract the desired immune response after implantation9,10,11,12.
The immune response is an essential requirement in the field of regenerative medicine, where a tissue or an organ is grown around a biomaterial skeleton (scaffold) in a laboratory for the replacement of a damaged tissue or organ13,14,15,16. In regenerative medicine, the goal is to replace missing or damaged tissue through the use of cells, signals, and scaffolds, each of which can be greatly modulated by immune responses17. Furthermore, even when a lack of immune response is desired, it is very rarely an absence of immune activity rather than the presence of a regulatory profile that is desired18. Techniques such as flow cytometry can play a significant role in characterizing the pattern of immune response to various biomaterials used for coating implant devices or for developing scaffolds for tissue engineering19.
This information, in turn, will ultimately help in developing biomaterials for implants that can be well-tolerated by the immune system or in developing scaffolds that can play a constructive role in tissue engineering. Proper preparation of samples for analysis by flow cytometry is an important step for avoiding inaccurate results in immune characterization via fluorescence activated cell sorting20,21. Therefore, this review presents a detailed methodology that can be utilized for the isolation of cells from scaffold tissue, staining the cell suspension, and analysis by flow cytometry.
NOTE: Figure 1 gives an overview of the flow cytometry protocol.
1) Reagent preparation
2) Setting up enzymatic digestion plates
3) Isolation of cells
4) Staining for flow cytometry
5) Intracellular staining
6) Cytometer and compensation setup
The process of development of flow cytometry panels for immune analysis often relies on the comparison of results to existing data and the literature in the field. Knowledge of how populations may present in flow cytometry is critical for proper interpretation of data. Regardless, populations and cell types can appear differently in different tissues, so some variability is to be expected. In the context of well-defined control tissues, such staining optimization can be evaluated against known tissue that has well-researched cell types. Figure 3 shows the results of a 14-color FACS on control mouse tissue. In this case, the spleen was used to identify all markers that were stained for, and to show that the staining was technically functional. From this point onwards, it became easier to test in unknown conditions, be confident of the fluorophore selection, and optimize the protocol for different tissue sources. Figure 3 also shows populations of different cell types isolated from a murine spleen19.
Here, several obvious populations, such as Ly6G+ neutrophils, and different expression levels of Ly6C on different monocyte classes could be observed. CD11chiMHCII+ dendritic cells were readily apparent when gated against CD11b to rule out macrophages and other myeloid lineage cells such as neutrophils and monocytes. A subset of CD206+CD86+ dendritic cells could be found by focusing on this CD11c+ population. CD86 and CD206 were included to phenotype myeloid cells as being in a more M1-like (CD86hi) versus in a more M2-like (CD206hi) polarization state. F4/80 showed a gradient of expression, that can be commonly observed in various macrophage populations. Siglec-F was present in two populations, F4/80+ and F4/80-, most likely corresponding to a macrophage subset and eosinophils, respectively. Although these designations of cell types can be made, it is important to note that cells expressing different markers should be viewed in a functional manner as opposed to a more binary classification. Acknowledgement that what is considered a macrophage may differ in the spleen and the foreign body capsule around an implant, is important and avoids the potential misinterpretation of results.
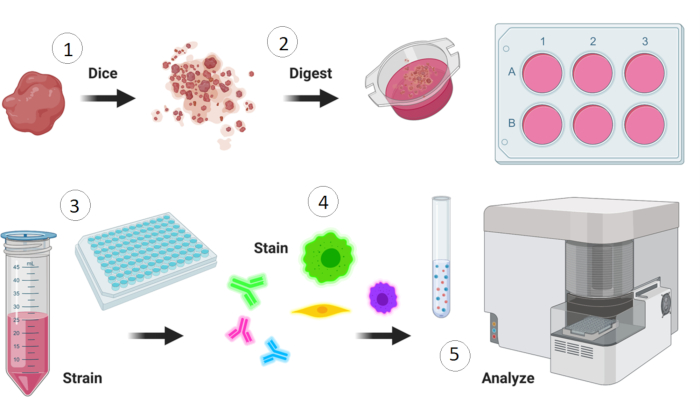
Figure 1: Overview of flow cytometry staining protocol. Preparation includes dissection of the tissue of interest followed by 1) manual dicing, 2) enzymatic digestion, 3) cell straining and washing, and 4) staining with fluorescently tagged antibodies followed by flow cytometric analysis. The illustration was made with Biorender. Please click here to view a larger version of this figure.
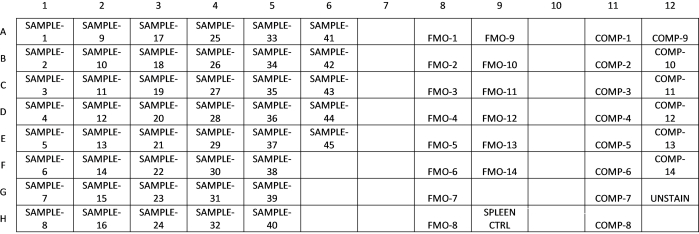
Figure 2: Example of a plate layout for flow cytometry staining. This layout includes the samples, fluorescence minus one (FMO) controls, compensation controls, and a control tissue sample (spleen). Please click here to view a larger version of this figure.
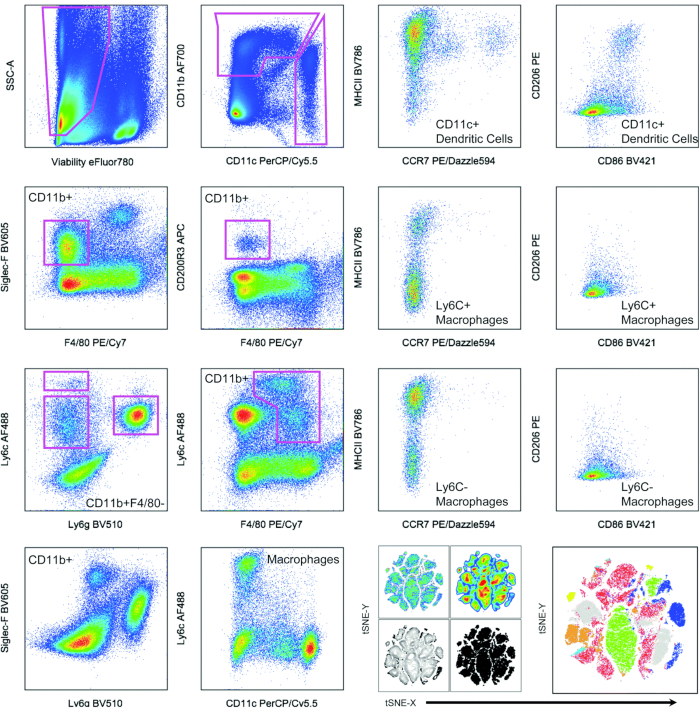
Figure 3: Representative results from 14-color FACS staining on control mouse tissue. Myeloid cell phenotyping of murine spleen cells with examples of hand-gating and automated t-stochastic neighbor-embedding (t-SNE) clustering algorithm for data display. This figure has been reproduced from Sadtler and Elisseeff19. Abbreviations: FACS = fluorescence-activated cell sorting; SSC = side scatter; CD = cluster of differentiation; PE = phycoerythrin; CCR = C-C chemokine receptor type; MHC = major histocompatibility complex; PerCP = peridinin chlorophyll protein complex. Please click here to view a larger version of this figure.
Reagent/Antibody | µL per sample |
CD86 BUV395 | 0.25 |
CD45 BUV737 | 0.5 |
CD8a BV421 | 0.25 |
Ly6g BV510 | 0.125 |
Siglec F BV605 | 0.25 |
MHCII BV786 | 0.25 |
Ly6c AF488 | 0.125 |
CD11c PerCP/Cy5.5 | 0.2 |
CD206 PE | 0.2 |
CD197 PE/Dazzle594 | 0.125 |
F4/80 PE/Cy7 | 0.25 |
CD200R3 APC | 0.25 |
CD11b AF700 | 0.25 |
Fc Block | 1 |
BD Brilliant Stain Buffer Plus | 10 |
1x PBS | 35.975 |
Total Volume: | 50 µL |
Table 1: Example of surface antibody cocktail. An example antibody cocktail for myeloid phenotyping of mouse tissue.
This review describes a detailed methodology for isolating cells from biomaterial implants to obtain a uniform cell suspension. In addition, a detailed protocol has been provided for staining the cell suspension for multicolor flow cytometry, along with the steps for configuring a flow cytometer for optimal results. Cell isolation methods can involve multiple steps, often utilizing manual tissue dissection followed by enzymatic digestion with proteolytic enzymes to dissociate the extracellular matrix in the tissue and disrupt the cell-cell junctions to liberate individual cells from the tissue. After digestion, further processing, such as cell straining, is needed to remove remaining debris and ensure a single-cell suspension. Some samples that have high levels of debris or other cell types (such as tumors) may require more thorough clean-up through the use of density separation media23. Without proper sample clean-up, data may be skewed due to debris or other cell populations obscuring the populations of interest. Excess debris can also lead to full or partial clogging of the cytometer fluidics.
While the characterization of immune cells can also be performed by other methods, such as light microscopy, by performing a differential cell count on a cell cytospin preparation, flow cytometry provides a more accurate characterization of the cells based on cell surface markers. Additionally, flow cytometry data are more precise as they can characterize and quantify millions of cells in suspension and can provide accurate estimates of distinct cell subsets much faster than manual differential counting based on only 400 cells24. The results shown in this paper rely on an iterative panel design with antibody selection done by the utilization of multiple online tools to compare the excitation and emission spectra and theoretical overlap depending on the cytometer configuration. When designing larger color experiments, it is best to start from a clean slate, as opposed to the addition to a smaller color panel, so as to fully consider antigen abundance, fluorophore brightness, and spectral overlap.
Studies analyzing distinct subsets of specific immune cells require sufficient number of overall cells to perform flow cytometry, as having a smaller number of cells can pose a significant challenge in their isolation by cell sorting or obtaining accurate estimates. This challenge can be overcome by using magnetic beads for isolating and enriching specific immune cells, such as neutrophils, in shorter periods and with limited washing25. Isolated cells from tissues of organs such as lungs can contain significant amounts of mucus, which can make the cell suspension "sticky" and result in an increased number of doublet events during flow cytometry26,27. Adding chelating agents such as 2 mM ethylenediamine tetraacetic acid to the staining buffer can prevent the aggregation of cells in such samples.
Additionally, suspending cells in an increased volume of buffer can also limit doublet creation by reducing cell-cell interactions. Staining procedures should be thoroughly optimized for each different tissue, staining protocol, flow cytometer, and antibody panel. Some fluorophores can be more sensitive to fixatives, some cell types are more sensitive to different cell isolation and processing methods, and many cell types behave differently in different tissues and different locations. With proper preparation and diligent analysis, flow cytometry can yield a detailed cellular and protein-level analysis to characterize the scaffold and biomaterial immune microenvironment.
The authors have nothing to disclose.
This research was supported in part by the Intramural Research Program of the NIH, including the National Institute of Biomedical Imaging and Bioengineering. Disclaimer: The NIH, its officers, and employees do no recommend or endorse any company, product, or service.
50 mL conical tubes | Fisher Scientific | 14-432-22 | |
6 Well Plate | Fisher Scientific | 07-000-646 | |
BD Brilliant Stain Buffer Plus | BD Biosciences | 566385 | |
BD Cytofix | BD Biosciences | 554655 | For only fixing cells |
Bovine serum albumin | Millipore Sigma | A7906 | For preparing FACS staining buffer |
CD11b AF700 | Biolegend | 101222 | Clone: M1/70 |
CD11c PerCP/Cy5.5 | Biolegend | 117325 | Clone: N418 |
CD197 PE/Dazzle594 | Biolegend | 120121 | Clone: 4B12 |
CD200R3 APC | Biolegend | 142207 | Clone: Ba13 |
CD206 PE | Biolegend | 141705 | Clone: C068C2 |
CD45 BUV737 | BD Biosciences | 612778 | Clone: 104/A20 |
CD86 BUV395 | BD Biosciences | 564199 | Clone: GL1 |
CD8a BV421 | Biolegend | 100737 | Clone: 53-6.7 |
Comp Bead anti-mouse | BD Biosciences | 552843 | For compensation control |
DNase I | Millipore Sigma | 11284932001 | Bovine pancreatic deoxyribonuclease I (DNase I) |
F4/80 PE/Cy7 | Biolegend | 123113 | Clone: BM8 |
Fc Block | Biolegend | 101301 | Clone: 93 |
Fixation/Permeabilization Solution Kit | BD Biosciences | 554714 | For fixing and permeabilization of cells. |
HEPES buffer | Thermo Fisher | 15630080 | Buffer to supplement cell media |
Liberase | Millipore Sigma | 5401127001 | Blend of purified Collagenase I and Collagenase II |
LIVE/DEAD Fixable Blue Dead Cell Stain Kit | Thermo Fisher | L23105 | Viability dye |
Ly6c AF488 | Biolegend | 128015 | Clone: HK1.4 |
Ly6g BV510 | Biolegend | 127633 | Clone: 1A8 |
MHCII BV786 | BD Biosciences | 742894 | Clone: M5/114.15.2 |
Phosphate buffer saline | Thermo Fisher | D8537 | |
RPMI | Thermo Fisher | 11875176 | Cell culture media |
Siglec F BV605 | BD Biosciences | 740388 | Clone: E50-2440 |
V-bottom 96-well plate |