The protocol describes the isolation, culture, and profiling of endothelial cells from human mesenteric artery. Additionally, a method is provided to prepare human artery for spatial transcriptomics. Proteomics, transcriptomics, and functional assays can be performed on isolated cells. This protocol can be repurposed for any medium- or large-size artery.
Endothelial cells (ECs) are crucial for vascular and whole-body function through their dynamic response to environmental cues. Elucidating the transcriptome and epigenome of ECs is paramount to understanding their roles in development, health, and disease, but is limited in the availability of isolated primary cells. Recent technologies have enabled the high-throughput profiling of EC transcriptome and epigenome, leading to the identification of previously unknown EC cell subpopulations and developmental trajectories. While EC cultures are a useful tool in the exploration of EC function and dysfunction, the culture conditions and multiple passages can introduce external variables that alter the properties of native EC, including morphology, epigenetic state, and gene expression program. To overcome this limitation, the present paper demonstrates a method of isolating human primary ECs from donor mesenteric arteries aiming to capture their native state. ECs in the intimal layer are dissociated mechanically and biochemically with the use of particular enzymes. The resultant cells can be directly used for bulk RNA or single-cell RNA-sequencing or plated for culture. In addition, a workflow is described for the preparation of human arterial tissue for spatial transcriptomics, specifically for a commercially available platform, although this method is also suitable for other spatial transcriptome profiling techniques. This methodology can be applied to different vessels collected from a variety of donors in health or disease states to gain insights into EC transcriptional and epigenetic regulation, a pivotal aspect of endothelial cell biology.
Lining the lumen of blood vessels, endothelial cells (ECs) are crucial regulators of vascular tone and tissue perfusion. ECs are remarkable in their ability to react to the extracellular environment and adapt to changes in the dynamics and composition of blood flow. These dynamic responses are mediated through a network of intracellular signaling events, including transcriptional and post-transcriptional modulations with spatio-temporal resolution. The dysregulation of these responses is implicated in many pathologies, including but not limited to cardiovascular disease, diabetes, and cancer1,2.
A large proportion of studies make use of cell lines or animal models to interrogate EC transcriptome. The former is a useful tool, given the relative ease of use and inexpensiveness. However, serial culturing can introduce phenotypic alterations to ECs, such as fibroblastic features and a lack of polarization, disconnecting them from their in vivo state3. The primary cells, e.g., human umbilical vein EC (HUVEC) have been a popular choice since the 1980s but are derived from a developmental vascular bed that does not exist in adults, thus unlikely to fully represent mature ECs. Animals, especially mouse models, better represent the physiological or pathophysiological environment of ECs and allow interrogation of transcriptomes as a result of genetic perturbation. Murine ECs can be isolated from various tissues, including the aorta, lungs, and adipose tissues using enzyme-based procedures4,5,6,7. However, the isolated cells cannot be used for multiple passages unless transformed6 and are often limited in numbers, which requires pooling from multiple animals5,8,9.
The advent of new technologies exploring the vessel architecture at a transcriptomic level, particularly with single-cell resolution, has enabled a new era of endothelial biology by revealing novel functions and properties of ECs5, 10,11,12,13,14. A rich resource built by Tabula Muris investigators collected single-cell transcriptomic profiles of 100,000 cells including ECs across 20 different murine organs15, which revealed both common EC marker genes and unique transcriptomic signatures with inter-and intra-tissue differences5,13. Nevertheless, there are clear differences between mouse and human in genome, epigenome, and transcriptome, especially in the non-coding regions16,17,18. These aforementioned drawbacks emphasize the importance of analysis of ECs using human samples in order to gain a faithful profile of ECs in their native state in health and disease.
Most EC isolation methods rely on physical dissociation through homogenization, finely cutting, and mincing the tissue before incubation with proteolytic enzymes for differing times. The enzymes and conditions also vary considerably between tissue types, from trypsin to collagenase, used alone or in combination19,20,21. Further antibody-based enrichment or purification are often included to increase the purity of ECs. Typically, antibodies against EC membrane markers, e.g., CD144 and CD31 are conjugated to magnetic beads and added to the cell suspension22,23. Such a strategy can be generally adapted for EC isolation from multiple human and mouse tissues, including the techniques introduced in this protocol.
In their native state, ECs interact with multiple cell types and may exist in vascular niches where cell proximity is crucial for function. While single-cell and single-nuclear RNA-sequencing (scRNA and snRNA-seq) studies have been paramount to the recent breakthroughs in describing EC heterogeneity, the dissociation process disrupts tissue context and cell-cell contact, which are also important to understand EC biology. Developed in 2012 and named Method of the Year in 202024, spatial transcriptome profiling has been utilized to profile global gene expression while retaining the spatial features in various tissues including brain25, tumor26, and adipose tissue27. The technologies can be targeted, using specialized probes specific for particular RNA sequences attached to affinity reagents or fluorescent tags, thus detecting select genes at subcellular resolution28,29,30,31. They can also be untargeted32,33, typically using spatially barcoded oligonucleotides to capture RNA, which together get converted to cDNA for subsequent seq library preparation and hence has the advantage of deducing whole tissue gene expression in an unbiased manner. However, spatial resolution is not currently achieved at a single cellular level with commercially available technologies. This can be overcome to some extent with data integration with scRNA-seq data, ultimately allowing the mapping of single-cell transcriptome in a complex tissue context while retaining its original spatial information34.
Herein, a workflow is described to profile EC transcriptome using human superior mesenteric artery, a peripheral artery that has been used to study vasodilation, vascular remodeling, oxidative stress, and inflammation35,36,37. Two techniques are described: 1) to isolate and enrich ECs from the intima of blood vessels combining mechanical dissociation and enzymatic digestion suitable for single-cell transcriptome sequencing or subsequent in vitro culture; 2) to prepare arterial sections for spatial transcriptome profiling (Figure 1). These two techniques can be performed independently or complementarily to profile ECs and their surrounding cells. Furthermore, this workflow can be adapted for use on any medium or large artery.
Human tissue studies were conducted on deidentified specimens obtained from the Southern California Islet Cell Resource Center at City of Hope. The research consents for the use of postmortem human tissues were obtained from the donors' next of kin, and ethical approval for this study was granted by the Institutional Review Board of City of Hope (IRB No. 01046).
1. Physical dissociation (estimated time: 1-2 h)
2. Preparation for scRNA-seq studies (estimated time: 3-4 h)
3. Spatial transcriptome profiling (estimated time: 3-4 h)
4. Sequencing data analysis (estimated time: up to 1 week depending on familiarity with software)
NOTE: For spatial transcriptomic analysis only, skip to step 4.8. scRNA-seq data is processed using the standardized pipeline aligned to human hg38 reference transcriptome. The R package Seurat (v3.2.2) is used to analyze scRNA-seq data following published guidelines40.
The analysis of ECs from mesenteric artery using a combination of mechanical and enzymatical dissociation or cryopreservation for use in various downstream assays is depicted here (Figure 1). ECs can be profiled in mesenteric arteries using the following steps: A) mechanical dissociation from the intima coupled with collagenase digestion to culture cells; B) generation of single-cell suspension for scRNA-seq; or C) cross-sections of the artery can be embedded in OCT to be cryosectioned to profile spatial transcriptome (Figure 1 and Figure 2).
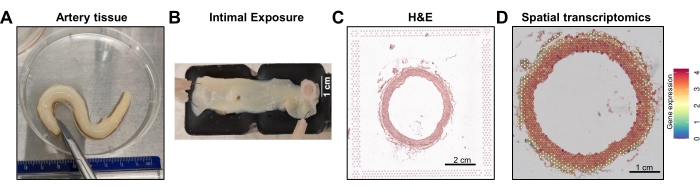
Figure 1: Arterial tissue processing and spatial profiling. (A) A cleaned-up mesenteric artery. (B) Vessel cut open to expose intima. (C) Hematoxylin and Eosin (H&E) staining of mesenteric artery cross-section in the fiducial frame. Image captured using a 5x lens under widefield fluorescence inverted microscope. (D) Representative Space Ranger output file of total gene expression. Please click here to view a larger version of this figure.
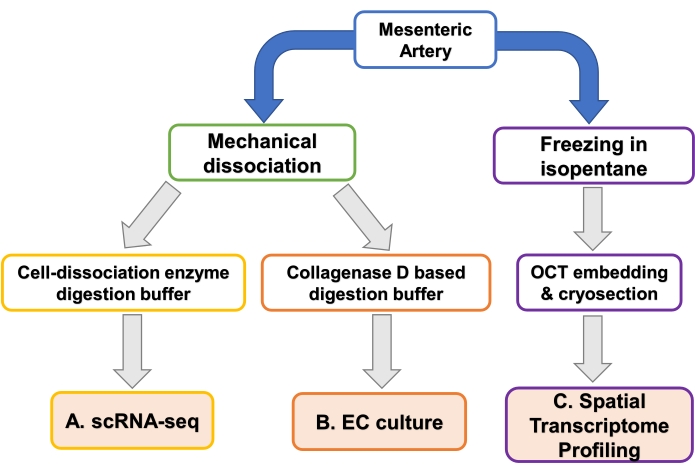
Figure 2: Overview of EC isolation and profiling techniques. Flow diagram showing different methods of processing mesenteric artery. Processing techniques result in cell suspensions suitable for single-cell (sc) RNA-seq, endothelial cell (EC) culture, or whole tissue is embedded in optimal cutting temperature compound (OCT) for spatial transcriptome profiling. Please click here to view a larger version of this figure.
Isolated ECs cultured using the described protocol display a distinct cobblestone-like morphology with minimal contaminating cells (Figure 3A). Expression of EC marker vascular endothelial (VE)-Cadherin was confirmed using immunofluorescence visualizing cell-cell junctions (Figure 3B). Isolated ECs were subjected to flow cytometry analysis for CD31. As negative controls, unstained HUVECs (without antibody) produced a 1.1% signal and HUVECs incubated with IgG yielded a 0.8% signal. As a positive control, HUVECs stained with CD31 antibody displayed 99% purity and were used to gate the channels for human mesenteric arterial endothelial cells (HMAECs). Approximately 80% of cells were CD31 positive indicating HMAECs made up the majority of the freshly isolated cell population (Figure 3C). Unsuccessful isolations, through either scraping too hard/deep, seeding the cells at too low a density, or maintaining the culture beyond passage 3 results in cells with disturbed morphology, potentially expressing mesenchymal markers (αSMA) or elongating resembling a fibroblastic state (Figure 3D).
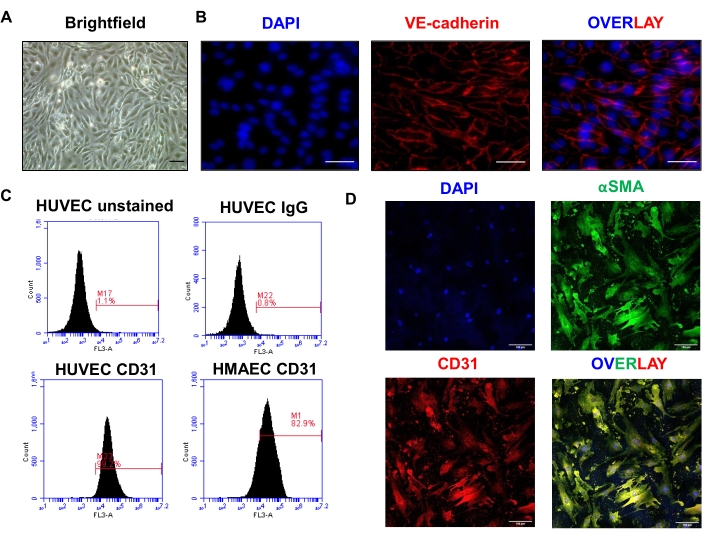
Figure 3: Validation of isolated cultured mesenteric arterial ECs. (A) Brightfield image of isolated ECs, 10x lens, scale bar = 50 µm. (B) Immunofluorescence of VE-Cadherin expression with 4′,6-diamidino-2-phenylindole (DAPI) as a nuclear marker. Image captured using a 10x lens under widefield fluorescence inverted microscope. Representative image shows VE-Cadherin localization. Scale bar = 50 µm. (C) FACS plots of unstained HUVEC (top left), HUVEC stained with IgG control (top right), HUVEC stained with CD31 (bottom left), and the isolated human mesenteric arterial endothelial cells (HMAEC) stained with CD31 (bottom right) (D) Immunofluorescence images of HMAECs with DAPI (nuclear marker), alpha-smooth muscle actin (αSMA) and CD31. 40x lens, scale bar = 100 µm. Please click here to view a larger version of this figure.
ECs isolated using cell-dissociation enzyme underwent scRNA-seq. Figure 4A shows a representative uniform manifold approximation and projection (UMAP) isolated from mesenteric artery using the present protocol for scRNA-seq on isolated HMAECs, with 34% cells clustered as ECs using PECAM1 and VWF (Figure 4B,C respectively) as markers.
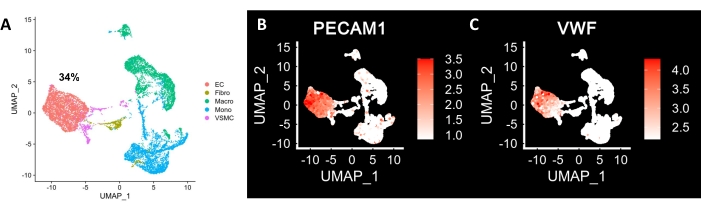
Figure 4: scRNA-seq of mesenteric arterial ECs. (A) Uniform Manifold Approximation and Projection (UMAP) plot of scRNA-seq data from mesenteric artery. A 2-dimensional projection of the manifold in a high dimensional space, where each point represents a single cell and the proximity to other points indicate how similar the transcriptome is with each other. Cells are color-coded by their cell types. (B) PECAM1 expression projected onto UMAP. (C) VWF expression projected onto UMAP. Color bars represent the expression of levels of genes where the RNA levels are depicted by log-normalized unique molecular identifier counts. Please click here to view a larger version of this figure.
For spatial transcriptomic workflow, extracted RNA from tissue sections was electrophorized on a gel to visualize RNA quality. A weak signal or absence of 18S and 28S ribosomal RNA bands, and the presence of degradation products observed in Figure 5A, lane A1, is an example of poor-quality RNA and should not be processed further. Samples with a concentration out of the range could lead to lower RIN (Figure 5A, lane B1). However, diluting the RNA by two times increased RIN sufficient for proceeding (Figure 5A, lane C1). Before determining gene expression, a tissue optimization was performed to determine the optimal permeabilization time to release RNA to be captured by the oligonucleotides on the gene expression slide (Figure 5B). Based on the fluorescence imaging of complementary DNA (cDNA) footprint, 18 min permeabilization produced the lowest background but strongest signal, and thus was selected to be the optimal duration. Hematoxylin and eosin (H&E) staining visualized the morphology of the vessel allowing regions of interest to be identified (Figure 5C). Library quality was assessed (Figure 5D) and determined to be suitable for sequencing. UMI counts per spot, number of reads per spot, and total genes are quality metrics produced by the Space Ranger pipeline, the variability of each displayed in Figure 5E. Finally, gene expression (using Actin alpha-2 (ACTA2) as an example, Figure 5F) was visualized with spatial anchoring on the H&E stained vessel.
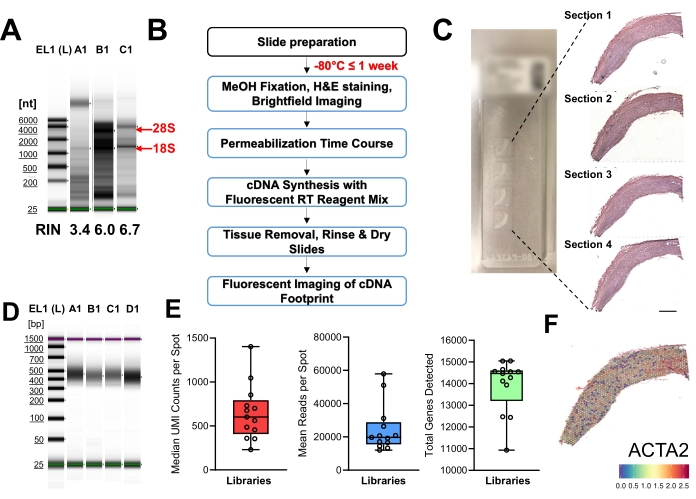
Figure 5: Spatial transcriptomic workflow and representative results (A) Quality assessment of RNA extracted from two samples of mesenteric artery, A1 from one sample, B1 from the second sample, C1 diluted 2x from B1. Red arrows indicate ribosomal 28S and 18S bands. (B) Spatial tissue optimization (TO) workflow. (C) Gene expression (GEX) slides showing the tissue sections (left panel); H&E images of the tissue sections loaded on the GEX slide before permeabilization for 18 min, reverse transcription and library construction (right panel), scale bar = 1 cm. (D) Quality assessment of the libraries prepared. (E) Output metrics from Space Ranger show ranges between average reads, UMIs, and genes per spot for different libraries. Error bars denote min and max. (F) ACTA2 expression across vessel section. All microscopy images were taken using a widefield inverted microscope, from a 5x lens, tilescan module.Please click here to view a larger version of this figure.
The presented workflow details a set of techniques to profile ECs from a single piece of human artery with single-cell and spatial resolution. There are several critical steps and limiting factors in the protocol. One key to transcriptome profiling is the freshness of the tissue and RNA integrity. It is important to maintain tissues on ice as much as possible prior to processing to minimize RNA degradation. Typically, the post-mortem tissues are processed between 8-14 h after the time of death. However, beginning the isolation or the cryopreservation as soon as possible post extraction from the donors is recommended. Specifically for spatial transcriptome mapping, the tissue should be kept on dry ice and no more than one freeze-thaw cycle should be allowed. More than one vessel cross-section should be embedded in OCT, to allow repeats if necessary. Efforts should also be made to promote an RNase-free environment during tissue processing and cell isolation. Secondly, the size of the vessels can be a limiting factor. For spatial transcriptomics, the protocol can be performed on 1 mm of the vessel in total, regardless of the diameter. For the dissociation protocol for cell culture and scRNA-seq, the lower limit would be if the vessel is too narrow (i.e., below 1 mm in diameter) to enable insertion of dissection scissors. Based on these principles, the dissociation protocol can be adapted for any medium or larger size artery or vein as long as the size of vessels allows the opening up, and the spatial transcriptome procedure can be applied to any vessels that can fit either entirely or partially into the fiducial frame.
To process tissue for single-cell transcriptome analysis, several groups have described the use of liberase and elastase to obtain all cell populations within the vessel wall9,43,44. However, the resulting datasets contain on average only 3-7% of the total cell population annotated as ECs9,45. One way to improve the limited EC representation in the scRNA-seq data is by enriching the EC fraction by leveraging the EC surface markers via FACS44,46. However, this usually requires large amounts of starting tissue and expensive equipment that may not be routinely available for all laboratories. This protocol takes advantage of the unique anatomical position of ECs, viz. primarily in the intimal layer, which allows for enrichment of ECs without the need for harsh tissue digestion and enhances cell viability for scRNA-seq or subsequent culture. The percentage of ECs in the final cell mixture for scRNA-seq can be increased by adding a step using VE-Cadherin/CD144 antibody-conjugated magnetic beads. However, this step may not exclude all other cells that interact with ECs due to the native cell-cell interaction. Nonetheless, although traditionally the other cell types (e.g., macrophages, smooth muscle cells, and fibroblasts) would be regarded as "contamination" in EC isolation, they can provide useful information for cell-cell interactions in the tissue context. In the scRNA-seq data analysis, ECs can be efficiently annotated using the EC markers and the cell-cell interactions can be inferred bioinformatically using several popular bioinformatics methods (e.g., CellChat47, CellphoneDB48, CytoTalk49 among others). Furthermore, the inclusion of these data can enable more effective integration and deconvolution of the spatial transcriptome profiling data, which are not at single-cell resolution (see below)34.
For spatial transcriptome, there is currently no gold standard for preparing any tissue for this technique and limited research in preparing vasculature, with most of the published research using animal tissue50,51. The technique requires commercially available slides with specialized fudicial frames with a capture area containing approximately 5,000 barcoded spots with a diameter of 55 µm. The spots are placed 100 µm apart from the center of the spot to adjacent spots leaving approximately 45 µm gaps between spots that will not be profiled, limiting the resolution. Furthermore, a single spot will contain multiple cells, as the majority of the cells are below 55 µm in area. Thus, as aforementioned, this is not a single-cell sequencing technique. However, by integrating the data with scRNA-seq, the resolution can be enhanced, and the heterogeneity within a spot can be revealed34. Although the present protocol focuses on one spatial transcriptomic profiling assay, this technique could be adapted for other emerging spatial profiling methods52,53 as the protein and RNA quality is maintained in this procedure.
The authors have nothing to disclose.
This work was supported by NIH grants R01HL108735, R01HL145170, R01HL106089 (to Z.B.C.); DP1DK126138 and DP1HD087990 (to S.Z.); an Ella Fitzgerald Foundation grant and a Wanek Family Project (to Z.B.C.); and a Human Cell Atlas seed network grant (to Z.B.C. and S.Z.). Research reported in this publication included work performed in the Integrative Genomics Core at City of Hope supported by the National Cancer Institute of the National Institutes of Health under award number P30CA033572. The authors would like to thank Dr. Ismail Al-Abdullah and Dr. Meirigeng Qi of the islet transplantation team at City of Hope for isolation of human tissues, Dr. Dongqiang Yuan at City of Hope for his assistance with scRNA-seq analysis, and Dr. Marc Halushka at the Division of Cardiovascular Pathology, Johns Hopkins University School of Medicine for his invaluable insights into vascular histology.
1.5 mL micro-centrifuge tube | USA Scientific | 1615-5500 | |
10 cm dish | Genesee Scientific | 25-202 | |
23G needles | BD | 305145 | |
2-methylbutane | Thermo Fisher | AC327270010 | |
40 µm strainer | Fisher | 14100150 | |
4200 TapeStation System | Agilent Technologies | G2991BA | |
5 mL tube | Thermo Fisher | 14282300 | |
6-well plate | Greiner Bio-One | 07-000-208 | |
Attachment factor | Cell Applications | 123-500 | Attachment reagent in the protocol |
Black wax | Any commercial black wax can be used | ||
Bovine serum albumin heat shock treated | Fisher | BP1600-100 | |
CaCl2 | Fisher | BP510 | |
Centrifuge | Eppendorf | ||
Chloroform | Fisher | C607 | |
Collagenase D | Roche | 11088866001 | |
Cryostat | Leica | ||
Cryostat brushes | |||
D-Glucose | Fisher | D16-1 | |
Dimethyl sulfoxide | Fisher | MT25950CQC | |
Dispase II | Roche | 4942078001 | Bacteria-derived protease in the protocol |
Disposable Safety Scalpels | Myco Instrumentation | 6008TR-10 | |
D-PBS | Thermo Fisher | 14080055 | |
Ethanol | Fisher | BP2818-4 | |
Fetal bovine serum | Fisher | 10437028 | |
Hemocytometer | Fisher | 267110 | |
HEPES | Sigma Aldrich | H3375-100g | |
High sensitivity D1000 sample buffer | Agilent Technologies | 5067-5603 | |
High sensitivity D1000 screen tape | Agilent Technologies | 5067-5584 | |
Incubator | Kept at 37 °C 5% CO2 | ||
Isopropanol | Fisher | BP26324 | |
KCl | Fisher | P217-3 | |
Liquid nitrogen | |||
Medium 199 | Sigma Aldrich | M2520-10X | |
Metal cannister | |||
Microscope | Leica | To assess cell morphology | |
Microvascular endothelial culture medium | Cell Applications | 111-500 | |
NaCl | Fisher | S271-1 | |
New Brunswick Innova 44/44R Orbital shaker | Eppendorf | ||
Optimal Cutting Temperature compound | Fisher | 4585 | |
Plastic cryomolds | Fisher | 22363553 | |
RNA screen tape | Agilent Technologies | 5067-5576 | |
RNA screen Tape sample buffer | Agilent Technologies | 5067-5577 | |
RNase ZAP | Thermo Fisher | AM9780 | |
RNase-free water | Takara | RR036B | RNase-free water (2) in kit |
Sterile 12" long forceps | F.S.T | 91100-16 | |
Sterile fine forceps | F.S.T | 11050-10 | |
Sterile fine scissors | F.S.T | 14061-11 | |
Superfrost PLUS Gold Slides | Fisher | 1518848 | |
TRIzol reagent | Fisher | 15596018 | |
Trypan Blue | Corning | MT25900CI | |
TrypLE Express Enzyme (1X) phenol red | Thermo Fisher | 12605010 | Cell-dissociation enzyme in the protocol |
Visium Accessory Kit | 10X Genomics | PN-1000215 | |
Visium Gateway Package, 2rxns | 10X Genomics | PN-1000316 | |
Visium Spatial Gene Expression Slide & Reagent Kit, 4 rxns | 10X Genomics | PN-1000184 |